R E S E A R C H A R T I C L E
Open Access
Combining serological and contact data
to derive target immunity levels for achieving
and maintaining measles elimination
Sebastian Funk
1,2*, Jennifer K. Knapp
3, Emmaculate Lebo
3, Susan E. Reef
3, Alya J. Dabbagh
4,
Katrina Kretsinger
4, Mark Jit
1,2,6,7, W. John Edmunds
1,2and Peter M. Strebel
5Abstract
Background: Vaccination has reduced the global incidence of measles to the lowest rates in history. However, local interruption of measles virus transmission requires sustained high levels of population immunity that can be
challenging to achieve and maintain. The herd immunity threshold for measles is typically stipulated at 90–95%. This figure does not easily translate into age-specific immunity levels required to interrupt transmission. Previous estimates of such levels were based on speculative contact patterns based on historical data from high-income countries. The aim of this study was to determine age-specific immunity levels that would ensure elimination of measles when taking into account empirically observed contact patterns.
Methods: We combined estimated immunity levels from serological data in 17 countries with studies of age-specific mixing patterns to derive contact-adjusted immunity levels. We then compared these to case data from the 10 years following the seroprevalence studies to establish a contact-adjusted immunity threshold for elimination. We lastly combined a range of hypothetical immunity profiles with contact data from a wide range of socioeconomic and demographic settings to determine whether they would be sufficient for elimination.
Results: We found that contact-adjusted immunity levels were able to predict whether countries would experience outbreaks in the decade following the serological studies in about 70% of countries. The corresponding threshold level of contact-adjusted immunity was found to be 93%, corresponding to an average basic reproduction number of approximately 14. Testing different scenarios of immunity with this threshold level using contact studies from around the world, we found that 95% immunity would have to be achieved by the age of five and maintained across older age groups to guarantee elimination. This reflects a greater level of immunity required in 5–9-year-olds than established previously.
Conclusions: The immunity levels we found necessary for measles elimination are higher than previous guidance. The importance of achieving high immunity levels in 5–9-year-olds presents both a challenge and an opportunity. While such high levels can be difficult to achieve, school entry provides an opportunity to ensure sufficient
vaccination coverage. Combined with observations of contact patterns, further national and sub-national serological studies could serve to highlight key gaps in immunity that need to be filled in order to achieve national and regional measles elimination.
Keywords: Measles, Elimination, Vaccination, Immunisation, Contacts, Social mixing, Modelling, Threshold
*Correspondence:[email protected]
Dr Strebel is currently employed by the US Centers for Disease Control and Prevention and seconded to Gavi the Vaccine Alliance
1Centre for the Mathematical Modelling of Infectious Diseases, London School of Hygiene & Tropical Medicine, Keppel Street, London, UK
2Department of Infectious Disease Epidemiology, London School of Hygiene & Tropical Medicine, Keppel Street, London, UK
Full list of author information is available at the end of the article
Background
Measles, a highly contagious immunising infection, could be a future target for eradication [1,2]. Since the intro-duction of vaccination in the early 1960s, mortality and morbidity from measles has declined drastically [3]. Nev-ertheless, outbreaks continue to occur, and achieving regional elimination, or interruption of transmission, has been challenging [4].
Control of measles is achieved through vaccination in early childhood, and the vaccine is part of routine immu-nisation schedules worldwide. In principle, a functioning health system would aim to vaccinate every child. In prac-tice, 100% coverage with all recommended doses is never achieved. Moreover, not every administration of a vac-cine confers immunity, and protection from a vacvac-cine can wane over time. However, even if not everyone in a popu-lation is immune, the indirect protection provided by the presence of immune individuals can be sufficient to pre-vent outbreaks [5]. For measles, it has been shown that in a randomly mixing population, the level of immunity required to achieve this so-called “herd immunity” is in the order of 90–95% [6].
Knowledge of the level of immunity required in a pop-ulation to achieve herd immunity can be used to set national vaccination targets. However, even if current lev-els of vaccination are high enough to achieve the level of immunisation required for herd immunity in new birth cohorts, outbreaks can occur if there are immunity gaps in older age groups. To assess the ability of a country or region to achieve and maintain elimination, that is the sus-tained absence of endemic transmission, immunity levels must therefore be considered across all age groups. These levels are affected by historical and current routine vac-cination coverage, but also by vacvac-cination campaigns and past outbreaks that conferred natural immunity.
For this reason, in the late 1990s, the World Health Organization (WHO) European Region (EURO) derived age-specific target immunity profiles, or the levels of immunity necessary in different age groups in order to achieve elimination [7]. These profiles are widely applied within and occasionally outside Europe to assess progress towards elimination [8–16]. Based on a basic reproduc-tion number (or number of secondary cases produced by a typical infective in a totally susceptible population) of 11, it was recommended to ensure that at least 85% of 1–4-year-olds, 90% of 5–9-year-olds and 95% of 10-year-olds and older possess immunity against measles [17]. Unlike vaccination coverage targets, immunity targets reflect the effect of susceptibility in all age groups and highlight the potential need for campaigns to close any gaps in immunity.
The aforementioned target immunity levels derived in the late 1990s were based on assumed age-specific contact patterns matched to the pre-vaccination measles
epidemiology in England and Wales. Since then, much work has gone into better quantifying the amount of transmission-relevant contact occurring between differ-ent age groups. Diary-based studies have been conducted across Europe [18,19], as well as in Vietnam [20], China [21], Uganda [22], Zimbabwe [23] and elsewhere. While other methods for measuring social contact patterns exist [24–26], contact data from diary studies have become the de facto standard for studying age-specific infectious disease dynamics. Mathematical models of transmission based on these observed patterns have consistently out-performed those based on homogeneous mixing [27–29].
Here, we aimed to evaluate current guidelines on target immunity levels for measles taking into account contact patterns observed in diary studies. To this end, we com-bined the observed age-specific social mixing patterns with observed or hypothesised immunity levels to calcu-latecontact-adjustedimmunity, akin to the mean level of immunity across the population but taking into account that some age groups have more contact with each other than others. We validated this method by testing the extent to which contact-adjusted immunity levels based on nationwide serological studies conducted in different countries in the late 1990s and early 2000s could have been used to predict the case load in the following decade. We then calculated contact-adjusted immunity levels from a range of hypothetical scenarios of age-specific immu-nity, including previous recommended immunity levels. We assessed whether these levels would be sufficient for achieving and maintaining elimination.
Methods
Predicting elimination from seroprevalence data
We estimated population-level immunity levels from sero-prevalence data using the different model variants out-lined below and compared them to the number of cases experienced over 10 years using Spearman’s rank correla-tion coefficient.
We further tested different thresholds for these levels to classify countries as being at risk of outbreaks or not. We calculated the misclassification error (MCE) as the pro-portion of countries that were incorrectly classified based on the given immunity threshold level and a threshold of the number of cases experienced in the 10 years following the seroprevalence study.
Immunity model: contact-adjusted vs. plain
We assumed that the force of infectionλiexperienced by age groupionly depends on the rate of contact with the same and other age groups and the prevalence of infection in the respective age groups:
λi=
j λij=
j βij
Ij
Nj
whereλijis the force of infection exerted by age groupj on age groupi,βijis the infection rate, or the rate at which individuals in age groupicontact individuals out of a total numberNjin age groupjand become infected if these are infectious, andIjis the number of infectious people in age groupj. This formulation of the force of infection assumes that the rate of infection between two random individu-als depends on their ages only and that the probability of a given contacted member of age groupjto be with some-one infectious depends on population-level prevalence of infection only.
We further write the infection rateβijas:
βij=pInfφij (2)
where pInf is the probability that a contact between a susceptible and infectious person leads to infection, here assumed age-independent, andφijis the number of con-tacts an individual of age groupjmakes with those of age groupiper unit time.
The basic reproduction number R0 is defined as the
mean number of new cases generated by a single infec-tious individual in a completely susceptible population. In a system with multiple host types (here: age groups), it can be calculated as the spectral radius (or largest eigenvalue) of the next-generation matrix (NGM)K[30]:
R0=ρ(K) (3)
The elements of the next-generation matrix K can be written as:
kij=qφij
Ni
Nj
(4)
where qis a scale factor that, assuming that infectious-ness stays constant while a person is infectious, is the probability of infection upon contactpInfmultiplied with
the duration of infectiousness DInf. If a proportion ri of age groupiis immune, this changes the initially suscep-tible population fromNitoNi(1−ri). The reproduction number for an invading infection in such a population is:
R=ρ(K) (5)
where, again, ρ denotes the spectral radius and K is a matrix with elements:
kij =qφij
Ni(1−ri)
Nj
. (6)
In classical mathematical epidemiology in a well-mixed population, the relationship between the basic reproduction numberR0and the effective reproduction
numberRis:
R=(1−r)R0 (7)
where r is the proportion of the population that is immune. We interpret:
r=(1−R/R0)=
1−ρ(K
)
ρ(K)
(8)
as contact-adjusted immunity, that is the equivalent of population immunity once age-specific contact patterns are taken into account. Note that q cancels out, so that calculation of contact-adjusted immunity only requires the contact matrixφij, population sizesNiand immunity levelsri.
An assumption of homogeneous mixing is equivalent to assuming thatφij=δnj, that is the rate of contact of group
ibeing with group jdepends only on an overall level of contactδand the proportionnj=Nj/Nof the population that are in groupj,N=Njbeing the overall population size. This, in turn, means that the infection rate isβij = δpinfnjand the force of infection (Eq.1) is independent of age group:
λi=δpinf I
N (9)
This is equal to the force of infection in a standard SIR model with infection rateβif we setβ =δpinf, that is the
infection rate is equal to the rate of contact times the prob-ability of infection upon contact between a susceptible and infectious individual.
In that case, the NGM of Eq. (4) reduces to:
kij=qniδ (10)
withq = pInfDInf. This matrix has rank 1 (as all rows are
equal), and its only non-zero eigenvalue is given by the trace:
R0=qδ=βDInf (11)
If the proportion immune of those in age groupiisri, the elements ofKare:
kij =q(1−ri)niδ (12)
and
R=βDInf
i
(1−ri)ni=rR0 (13)
where r is the proportion of the population that is immune. We call this factorr plainimmunity.
R0model: fixed vs. scaled
Elimination is equivalent to a situation whereR < 1 in Eq.5. For a given basic reproduction numberR0, this
cor-responds to contact adjusted immunity r being greater than a threshold levelr∗in Eq.8.
difference, schooling, population density or demography) would be expected to underlie such differences. It is unclear, though, whether these differences are measur-able in diary studies, or whether it is masked by inherent uncertainty in these observations, as well as differences in study design and data collection. We therefore tested two interpretations of the contact matrices estimated by diary studies in order to establish this threshold.
Under the first, more conservative interpretation (fixed R0), the contact matrices were taken to capture differences in contact rates between age groups, but not differences between overall levels of contact between the countries. This is equivalent to settingR0to be equal across coun-tries while still allowing difference in the relative contact rates between age groups. In this case, we would expect a single threshold level of contact-adjusted immunity given byr∗=1−1/R0.
Under the second interpretation (scaled R0), we
assumed R0 to scale according to the observed contact
patterns in each country. In this case, every country would be expected to have a different threshold of contact-adjusted immunity depending on its value ofR0, reflecting
the average basic reproduction number within the coun-try. We calculated a scaling factorcfor each country such that the basic reproduction number in the country was given by:
R0=cR0 (14)
whereR0is the mean basic reproduction number across countries. The factorccan be calculated as the spectral radius of a given contact matrix divided by the mean of the spectral radii across countries. Instead of working with different values of the basic reproduction numberR0, we
rescaled contacted-adjusted immunity in each country as:
r=1−(1−r)c (15)
With this formulation, we would again expect a single threshold of scaled contact-adjusted immunity given by
r∗=1−1/R0.
Vaccination model: projected vs. ignored
Seroprevalence studies only provide a single, cross-sectional snapshot of immunity in a population. Follow-ing such a study, vaccination uptake, natural immunity and ageing combine to change the age-specific immu-nity levels. We compared a model where vaccination was
ignored and the measured seroprevalence taken as fixed over the 10-year time period to one where we used an average ofprojectedimmunity levels, which were updated using information on vaccination uptake in the years fol-lowing the seroprevalence study. In principle, updating immunity levels with measured vaccination coverage and wild-type measles circulation should improve estimates of population-level immunity. In practice, this relies on
accurate measurements of both vaccination coverage and case numbers as well as modelling decisions on assumed vaccine efficacy, maternal immunity and distribution of multiple doses (e.g. randomly vs. preferentially to children that have already received a dose), which could mask any gains made from having up-to-date immunity estimates.
Here, we focused on added immunity due to vaccination and assumed that the added immunity due to wild-type measles circulation was negligible. Serological samples from under-1-year-olds were only available from 7 of the 17 countries in the ESEN2 study, and the number of sam-ples from each country is too small to produce good estimates (676 samples in total); we combined all these samples to produce an overall estimate of maternal immu-nity of approximately 40% amongst under-1-year-olds. We assumed that immunity in the age group that contained the scheduled age of the first dose of measles was given by a country-specific scaling factor multiplied with the reported coverage in that year. This factor would reflect the proportion of children in that age group immunised at any point in time, as a fraction of the ones immu-nised by the time of departure from the age group. The factor was estimated by comparing the observed sero-prevalence with the level of coverage reported in that year. For any subsequent doses, we assumed that the vaccine was preferentially given to those that had received a pre-vious dose or doses of the vaccine, as could be estimated from the reported coverage at the time children in that cohort would have been eligible for the previous dose(s). We assumed a vaccine efficacy per dose of 95% [32].
Contact matrices
We established contact matrices from diary studies con-ducted in a range of different settings using a bootstrap, randomly samplingPindividuals with replacement from the P participants of a contact survey. We then deter-mined a weighted average dij of the number of contacts in different age groupsjmade by participants of each age groupi, giving weekday contacts 5/2 times the weight of weekend contacts. We further obtained symmetric matri-ces, i.e. ones fulfillingcijni=cjinjby rescaling:
cij= 1 2
1
ni
dijni+djinj (16)
This gave the elements of the contact matrixφij = cij/T, scaled by the time period T over which contacts were measured (usually 24 h).
Data sources
at the times of the studies [10]. Equivocal samples were interpreted as positive as in the original study, but we also tested scenarios where they were removed from the sample or interpreted as negative. We took into account uncertainty by drawing from the individual samples using a bootstrap (n = 1000) and using the re-sampled immu-nity levels with re-sampled contact matrices to estimate contact-adjusted immunity. We ensured visually that the number of bootstrap samples chosen produced stable mean estimates of contact-adjusted immunity levels (see Additional file1: Figure S1). Since contact studies were not available for all countries in ESEN2, contact studies from representative countries were used where necessary (for mediterranean countries, Italy; for Eastern European countries, Poland; for Sweden, Finland; for Ireland, Great Britain).
We used diary studies available on the Zenodo Social Contact Data Repository (https://zenodo.org/
communities/social_contact_data), to determine contact
matrices for 17 countries and the Hong Kong Special Administrative Region of China [33–37], a study con-ducted in Uganda [22] and a further study conducted in five countries of South East Asia.
Computation
All computations were done with the R statistical com-puting language [38]. Contact matrices were calculated using thecontact_matrixfunction in thesocialmixr pack-age [39], and contact-adjusted immunity calculated using theadjust_immunityfunction in theepimixrpackage [40].
Results
Contact-adjusted immunity levels from serological studies
We first tested the ability of nationwide seroprevalence studies to predict the cases in the decade following,
using different definitions of population-level immunity. Overall, the 17 countries that took part in the ESEN2 study in the early 2000s reported 59,494 measles cases to WHO in the 10 years following the study. The num-ber of cases experienced by individual countries varied widely (Fig.1and Table1). Slovakia, where measles was declared eliminated in 1999, only reported a total of 2 cases (both in 2004) in these 10 years. Bulgaria, on the other hand, reported over 20,000 cases, largely as part of a large outbreak in 2009/10.
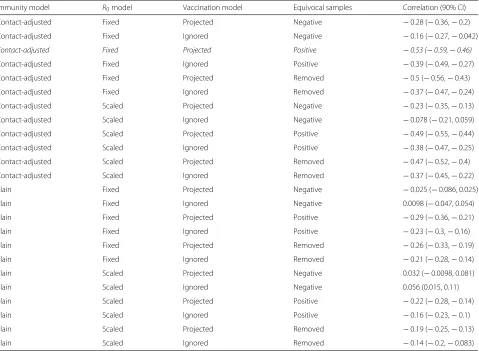
Comparing the immunity levels with the mean number of annual measles cases in the 10-year period yielded the expected negative correlation with most models (Table2). Contact-adjusted immunity levels estimated based on the serological profiles were better correlated with the case load than plain immunity levels. Further, interpreting equivocal samples as positive yielded the best correla-tion, but scalingR0 according to measured contacts did
not improve correlations compared to using a fixedR0.
Projecting national vaccination uptake in the years follow-ing the serological surveys onto the observed immunity levels yielded better correlations than just using the snap-shots of seroprevalence. For the remaining analyses, we therefore used a fixedR0, interpreted equivocal samples as
positive, and corrected immunity levels with vaccination uptake. The resulting immunity levels for the 17 coun-tries in the ESEN2 study are shown in the rightmost two columns of Table1.
The best model had correlation of−0.53 (Spearman’s rank correlation, 90% credible interval (CI) −0.59– (−0.46)) for contact-adjusted immunity and−0.29 (90%
CI −0.36–(−0.21)) for plain immunity. Notable
outliers in the correlation between immunity levels and case load were Latvia (contact-adjusted immunity 71%, plain 82%, 16 cases over 10 years) in one direction
Table 1Measles cases in the 10 years following the ESEN2 serological study, and mean estimated population
immunity (contact-adjusted or not, with fixedR0and equivocal samples interpreted as positive) based on the study and adjusted for vaccination uptake
Cases Immunity
Country Total (10 years) Maximum annual Mean annual (per million) Maximum annual (per million) Contact-adjusted Plain
Slovakia 2 2 0.037 0.37 0.96 0.96
Hungary 12 5 0.12 0.5 0.95 0.95
Czech Republic 84 30 0.82 2.9 0.98 0.98
Latvia 16 7 0.72 3.1 0.71 0.82
Sweden 210 62 2.4 7 0.94 0.94
Lithuania 58 35 1.7 10 0.91 0.93
Slovenia 26 22 1.3 11 0.96 0.96
Malta 14 6 3.5 15 0.93 0.95
Luxembourg 10 8 2.3 18 0.95 0.96
UK 6001 1445 10 25 0.92 0.96
Spain 3419 1842 8.6 46 0.95 0.98
Belgium 1066 576 10 56 0.85 0.94
Cyprus 111 90 11 87 0.84 0.93
Ireland 1687 443 40 105 0.88 0.91
Israel 1792 931 30 155 0.94 0.95
Romania 20570 7450 93 337 0.92 0.96
Bulgaria 24416 22004 305 2750 0.82 0.88
(low estimated immunity but no outbreaks), and Spain (contact-adjusted immunity 95%, plain 98%,>3000 cases) and Israel (contact-adjusted immunity 94%, plain 95%,>1500 cases) in the other (high estimated immunity but outbreaks).
To test the predictive ability of estimated seroprevalence levels in combination with age-specific mixing, we split the countries into those that experienced large outbreaks in the 10 years following the serological studies and those that did not. We set the threshold at an average of 5 per million or, equivalently, a maximum annual cases of 20 per million (see dashed line in Fig.1). We then tested differ-ent threshold immunity levels (ranging from 80% to 99%, in increments of 1%) and classified countries as being at risk of outbreaks or not based on whether their estimated immunity levels fell below the threshold or not.
The threshold of contact-adjusted immunity yielding best predictions was 93%, in which case about 70% of countries were correctly classified (Fig. 2). With plain immunity, this level is at 94%, and the corresponding MCE is greater than with contact-adjusted immunity. More generally, the behaviour of the MCE as a func-tion of threshold level was more erratic when considering plain instead of contact-adjusted immunity. In assessing elimination prospects below, we used the threshold value of 93%.
Scenarios
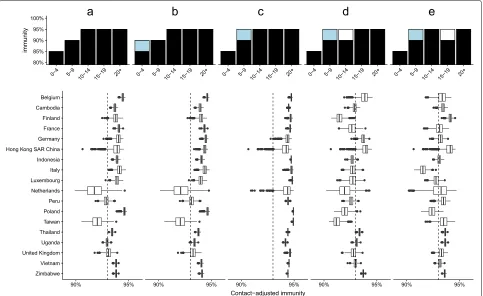
We investigated contact-adjusted immunity under pre-viously recommended target immunity levels (85% in under-5-year-olds, 90% in 5–9-year-olds and 95% in all older age groups) in the settings for which we had access to contact studies (17 countries and Hong Kong, Fig.3a). We used the identified threshold level of 93% as an indicator of being at risk of outbreaks, implying that the meanR0value
we found predictive of outbreaks in Europe was a good estimate elsewhere. In this scenario, 5 out of 18 settings had greater than 10% probability of adjusted immunity levels lower than the 93% level found to best identify coun-tries at risk of outbreaks: Taiwan (probability 95%), The Netherlands (90%), Peru (68%), Uganda (63%) and the UK (40%).
Table 2Spearman’s rank correlation between immunity estimated from nationwide serology and (if contact-adjusted) contact studies on the one hand and the mean number of cases in the 10 years following the studies on the other
Immunity model R0model Vaccination model Equivocal samples Correlation (90% CI)
Contact-adjusted Fixed Projected Negative −0.28 (−0.36,−0.2)
Contact-adjusted Fixed Ignored Negative −0.16 (−0.27,−0.042)
Contact-adjusted Fixed Projected Positive −0.53 (−0.59,−0.46)
Contact-adjusted Fixed Ignored Positive −0.39 (−0.49,−0.27)
Contact-adjusted Fixed Projected Removed −0.5 (−0.56,−0.43)
Contact-adjusted Fixed Ignored Removed −0.37 (−0.47,−0.24)
Contact-adjusted Scaled Projected Negative −0.23 (−0.35,−0.13)
Contact-adjusted Scaled Ignored Negative −0.078 (−0.21, 0.059)
Contact-adjusted Scaled Projected Positive −0.49 (−0.55,−0.44)
Contact-adjusted Scaled Ignored Positive −0.38 (−0.47,−0.25)
Contact-adjusted Scaled Projected Removed −0.47 (−0.52,−0.4)
Contact-adjusted Scaled Ignored Removed −0.37 (−0.45,−0.22)
Plain Fixed Projected Negative −0.025 (−0.086, 0.025)
Plain Fixed Ignored Negative 0.0098 (−0.047, 0.054)
Plain Fixed Projected Positive −0.29 (−0.36,−0.21)
Plain Fixed Ignored Positive −0.23 (−0.3,−0.16)
Plain Fixed Projected Removed −0.26 (−0.33,−0.19)
Plain Fixed Ignored Removed −0.21 (−0.28,−0.14)
Plain Scaled Projected Negative 0.032 (−0.0098, 0.081)
Plain Scaled Ignored Negative 0.056 (0.015, 0.11)
Plain Scaled Projected Positive −0.22 (−0.28,−0.14)
Plain Scaled Ignored Positive −0.16 (−0.23,−0.1)
Plain Scaled Projected Removed −0.19 (−0.25,−0.13)
Plain Scaled Ignored Removed −0.14 (−0.2,−0.083)
The model with the greatest absolute correlation is highlighted in italics
Fig. 3Contact-adjusted immunity in different theoretical scenarios, with age-specific mixing as measured in diary studies. Each column represents one of the scenarios of age-specific immunity (top), with differences between the settings given by their different mixing patterns. Scenarios from left to right:aCurrent target levels.b5% higher immunity in under 5-year-olds.c5% higher immunity in 5–9-year-olds.d5% lower immunity in 10–14-year-olds.e5% higher immunity in 5–9-year-olds and 5% lower immunity in 15–19-year-olds
In scenarios where immunity in 5-to-9-year-olds was raised but a gap in immunity was introduced in older gen-erations, contact-adjusted immunity dropped below the threshold level of 93% in some settings. A scenario of reduced immunity in 10-to-14-year-olds by 5 to 90% while retaining higher immunity in younger age groups resulted in elevated risks of outbreaks in 13 out of 18 countries. A scenario of reduced immunity in 14-to-19-year-olds by 5 to 90% while retaining higher immunity in younger age groups resulted in elevated risks of outbreaks in 11 out of 18 countries.
Discussion
Taking into account age-specific mixing patterns and applying these to immunity levels observed across Europe, we were better able to predict outbreaks than by con-sidering immunity alone. Combined with previous evi-dence that using observed age-specific mixing improves the accuracy of mathematical models, this suggests that there is a case for taking these into account when interpreting the results of serological studies [27–29].
A threshold of 93% contact-adjusted immunity was found to best predict outbreaks in the subsequent decade, with approximately 70% of countries correctly assessed to either be facing large outbreaks or not. However, in the absence of any more detailed information on setting-specific basic reproduction numbers, such a threshold will only ever be an approximation. On the other hand, setting-specific parameters are difficult to establish, are subject to method-specific biases and can span a wide range of values [31, 41]. In principle, country-specific reproduction numbers should depend on the frequency and types of contact within the population and should therefore be amenable to measurement in contact studies such as the ones used here. Yet, scaling estimated suscepti-bility levels with the relative number of contacts reported in each study gave no improved results over the simpler version not using such scaling. In other words, while there probably are differences in R0 between countries, these
patterns. We therefore argue that while the achieved 70% of accuracy in predicting outbreaks is far from perfect, aiming to achieve 93% or greater contact-adjusted immu-nity in a population is a pragmatic choice that can be informed by measurable quantities, that is age-specific immunity levels and mixing patterns.
Current guidelines on target immunity levels are based on estimates derived almost 20 years ago, and were based on assumed mixing patterns matched to pre-vaccination data from England and Wales. We have used trans-mission models in combination with recently observed age-specific contact patterns from a variety of European and some non-European settings to assess whether these guidelines are sufficient for achieving measles elimina-tion. We investigated a range of settings with different demographic profiles and cultural contexts: from high-income settings characterised by low birth rates and an ageing population (e.g., Germany or the UK) to hav-ing more (Vietnam) or less (Taiwan) recently under-gone the demographic transition to low birth rates, or characterised by a high birth rate and young popula-tion (Uganda). With observed mixing patterns, several settings were found to be at risk of outbreaks even if they achieved previously recommended target immunity levels, including ones with very different demographic profiles. Achieving 95% immunity in 5-to-9-year-olds, on the other hand, would reduce transmission sufficiently to achieve elimination in all except the most extreme scenarios.
The importance of immunity levels in 5-to-9-year-olds presents both a challenge and an opportunity: Levels as high as 95% in this age group can only be maintained through high levels of two-dose immunisation prior to school entry. At the same time, entering this age group coincides with school entry, which involves a level of organisation that provides the opportunity to both check the immunisation status of children and offer additional vaccinations if necessary. The experience of the Pan-American Health Organization in eliminating measles supports these findings. A key component to interrupt-ing measles virus transmission were periodic ‘follow-up’ vaccination campaigns of pre-school children, timed at 4-year intervals to ensure high immunisation by the time of school entry [42,43]. Studies in the USA, where measles was eliminated in 2000, suggest that different mini-mum vaccine coverage levels were required to prevent measles virus transmission among different age groups [44]. School-aged populations accounted for the majority of measles cases between 1976 and 1988, and compul-sory vaccination as part of school attendance laws played an important role in reducing measles incidence on the path to elimination [45]. Where there were less stringent vaccination requirements at school entry, more cases of measles were observed [46]. Analyses of pre-elimination
measles outbreaks in the USA indicated that transmis-sion occurred among highly vaccinated school-aged pop-ulations, suggesting that higher population immunity levels were needed among school-aged children com-pared to preschool-aged children [47]. It has been pro-posed that minimum coverage levels as low as 80% at the second birthday of children may be sufficient to prevent transmission among preschool-aged children in the USA if population immunity is at least 93% among over-5-year-olds [48].
While our results stress the role of 5-to-9-year-olds, they also highlight the importance of not having gaps in immunity in older age groups. This is particularly impor-tant close to elimination as a lower force of infection pushes cases into older age groups [49]. Given the higher rate of complications of measles when experienced at older age, ensuring immunity among adults will be impor-tant not only for interrupting transmission, but also to prevent serious episodes of disease [50].
Our study has several limitations. The delineation of countries into having experienced outbreaks or not is somewhat arbitrary, if in agreement with a milestone towards measles eradication established by the World Health Assembly [51]. Furthermore, the applied thresh-old of 93% was found to best distinguish between coun-tries that experienced outbreaks and those that did not, but similar performance would have been achieved with thresholds of 92% and, to a slightly lesser extent, 94%. These values correspond roughly to the commonly used range of 12–18 for the basic reproduction number. Apply-ing these thresholds would have had strong consequences for the assessment of elimination prospects for different immunity profiles, leading to higher (for a threshold of 94%) or lower (for a threshold of 92%) age-specific immu-nity targets. Depending on the local situation with respect to measles elimination, a country may therefore decide to apply less or more stringent immunity thresholds. Moreover, population immunity represents past levels of vaccine coverage or natural infection which may not be reflective of the future. For example, immunity may be high just after a major outbreak but such outbreaks could occur again if coverage is sub-optimal. In addition, pop-ulation migration can change immunity levels in a way that is not captured by vaccination coverage figures. An important caveat is therefore that seeing immunity suf-ficient to interrupt transmission does not guarantee that elimination is maintained if current levels of coverage are insufficient.
the contact-adjusted immunity levels we estimated from serological studies did not always correctly predict where outbreaks could be expected. On the one hand, Latvia did not experience large numbers of cases in spite of low levels of contact-adjusted immunity. It was among the smallest in our group of countries for which we had serological data available and may have been at lower risk of imported cases. Still, they would have been expected to have seen more cases given the results of the serological studies in 2003 and 2004, respectively. Immunity levels were as low as 76% among all age groups and 62% in 5- to 9-year-olds in 2003, but only 16 cases of measles were reported in the 10 years 2004–2013. Even with the high rates of vaccina-tion coverage (95% coverage of both first and second dose) over these 10 years, outbreaks would have been expected within the age cohorts with large amounts of suscepti-bility. To our knowledge, there were no supplementary immunisation activities that could explain the absence of outbreaks. It would be of value to determine whether the country is now at high risk of large outbreaks in spite of having previously interrupted transmission, or whether there were issues with the serological tests conducted at the time.
Israel and Spain, on the other hand, experienced large numbers in spite of high levels of contact-adjusted immu-nity. Three potential causes for this discrepancy suggest themselves: First, in Spain, the samples were collected in 1996 when there was an ongoing large measles outbreak and may therefore not reflect population-level immunity in the years following. Second, drops in vaccination cov-erage as well as vaccination campaigns may have changed the risk of outbreaks during the 10 years following the serological studies, although we found nothing in the publicly available national-level vaccination data to sug-gest any significant changes. Both Spain and Israel con-sistently reported 94% first-dose MMR coverage in the years following the seroprevalence studies. Third, serol-ogy based on residual and population-based samples may not always be representative of relevant immunity levels. In Spain, a disproportionate number of cases occurred in young adults [11], but there was nothing in the serological data to suggest that this might be expected. Moreover, if those lacking immunity are preferentially in contact with each other because they cluster socially or geographically, outbreaks could occur in these groups; population-level serology might not provide a good estimate of realised immunity levels in outbreak settings. In Israel, outbreaks occurred in orthodox religious communities with very low vaccination coverage [52]. More generally, herd immunity thresholds have been shown to increase if non-vaccination is clustered [53].
These examples highlight that taking into account het-erogeneity is crucial. Our method can be applied to lower levels than countries, such as municipalities or
counties. Further sub-national serological and epidemi-ological studies, particularly in low-income countries at high risk of measles outbreaks, could generate key insights on the relationship between immunity levels, heterogene-ity of susceptibilheterogene-ity and outbreak risk [54,55]. At the same time, further studies of contact patterns across settings, combined with models of such patterns where no data have been collected, will make it possible to expand our results to other countries and regions [56].
Conclusions
We have shown that combining national measles sero-prevalence studies with data on contact patterns increases their utility in predicting the expected case load and in assessing how close a country is to eliminating measles. Comparing past seroprevalence levels to the case load in the following decade enabled us to establish a thresh-old level of 93% contact-adjusted immunity that appeared sufficient to ensure elimination. Translating this into tar-get age-specific immunity levels that would be necessary to achieve this level of immunity, we found that greater immunity in 5–9-year-olds is needed than was previ-ously recommended. While such high levels can be dif-ficult to achieve, school entry provides an opportunity to ensure sufficient vaccination coverage. Combined with observations of contact patterns, further national and sub-national serological studies could serve to highlight key gaps in immunity that need to be filled in order to achieve national and regional measles elimination.
Additional file
Additional file 1: Supplementary Figure 1. Mean estimated of contact-adjusted immunity as a function of the number of bootstrap samples. Each line represents one country. (PDF 69 kb)
Abbreviations
ESEN2: European Sero-Epidemiology Network 2; EURO: European Region; MCE: Misclassification error; WHO: World Health Organization
Acknowledgements
We would like to thank the ESEN2 group for sharing serological data, and the SMILI group for contact data. We further acknowledge fruitful discussions with members of the World Health Organization Strategic Advisory Group of Experts on measles and rubella.
Authors’ contributions
SF conducted the analyses and wrote the first draft. All authors contributed to subsequent and final drafts. All authors read and approved the final manuscript.
Funding
SF was supported by a Career Development Award in Biostatistics from the UK Medical Research Council (MR/K021680/1) and a Wellcome Trust Senior Research Fellowship in Basic Biomedical Science (210758/Z/18/Z).
Availability of data and materials
et al., 2018), and the data for 5 South East Asian countries (Cambodia, Indonesia, Taiwan, Thailand, Vietnam) which are based on the Social Mixing for Influenza Like Illness (SMILI) project. For access to these data, researchers should contact John Edmunds (john@[email protected]) or Jonathan Read ([email protected]).
National-level measles case data were downloaded from the World Health Organization (https://www.who.int/immunization/monitoring_surveillance/ data/en/).
Seroprevalence data are based on the European Sero-Epidemiology Network 2 (ESEN2) project. Aggregate data have been published previously. For access to the individual-level data, researchers should contact Richard Pebody ([email protected]).
All the results in this paper can be reproduced using code athttps://github. com/sbfnk/immunity.thresholds.
Ethics approval and consent to participate
Institutional ethics approval was not sought because this is a retrospective study, and the databases are anonymised and free of personally identifiable information.
Consent for publication Not applicable.
Competing interests
The authors declare that they have no competing interests.
Author details
1Centre for the Mathematical Modelling of Infectious Diseases, London School
of Hygiene & Tropical Medicine, Keppel Street, London, UK.2Department of Infectious Disease Epidemiology, London School of Hygiene & Tropical Medicine, Keppel Street, London, UK.3Centers for Disease Control and Prevention, 1600 Clifton Rd, Atlanta, GA, USA.4World Health Organization,
Avenue Appia 20, Geneva, Switzerland.5GAVI Alliance, Chemin du Pommier 40, Le Grand-Saconnex, Switzerland.6Modelling and Economics Unit, National
Infections Service, Public Health England, 61 Colindale Avenue, London, UK.
7School of Public Health, University of Hong Kong, 7 Sassoon Road, Hong
Kong SAR, China.
Received: 11 April 2019 Accepted: 20 August 2019
References
1. World Health Organization. Global measles and rubella strategic plan 2012–2020. Geneva: WHO Press; 2012.
2. Roberts L. Is measles next? Science. 2015;348(6238):958–63.https://doi. org/10.1126/science.348.6238.958.
3. Strebel P, Cochi SL, Hoekstra E, Rota PA, Featherstone D, Bellini W, Katz SL. A world without measles. J Infect Dis. 2011;204 Suppl 1:1–3.https:// doi.org/10.1093/infdis/jir111.
4. Kupferschmidt K. Public health. Europe’s embarrassing problem. Science. 2012;336(6080):406–7.https://doi.org/10.1126/science.336.6080.406. 5. Fine PE, Eames K, Heymann DL. “Herd immunity”: a rough guide. Clin
Infect Dis. 2011;52(7):911–6.
6. Nokes D, Anderson R. The use of mathematical models in the epidemiological study of infectious diseases and in the design of mass immunization programmes. Epidemiol Infect. 1988;101(1):1–20.https:// doi.org/10.1017/S0950268800029186.
7. Ramsay M. A strategic framework for the elimination of measles in the European Region. Copenhagen: Regional Office for Europe; 1999. 8. Borˇci´c B, Mažuran R, Kai´c B. Immunity to measles in the croatian
population. Eur J Epidemiol. 2003;18(11):1079–83.https://doi.org/10. 1023/a:1026109201399.
9. Pistol A, Hennessey K, Pitigoi D, Ion-Nedelcu N, Lupulescu E, Walls L, Bellini W, Strebel P. Progress toward measles elimination in romania after a mass vaccination campaign and implementation of enhanced measles surveillance. Vaccine. 2003;187(Supplement 1):217–22.https://doi.org/10. 1086/368228.
10. Andrews N, Tischer A, Siedler A, Pebody RG, Barbara C, Cotter S, Duks A, Gacheva N, Bohumir K, Johansen K, Mossong J, Ory F. d., Prosenc K, Sláˇciková M, Theeten H, Zarvou M, Pistol A, Bartha K, Cohen D,
Backhouse J, Griskevicius A. Towards elimination: measles susceptibility in australia and 17 european countries. Bull World Health Organ. 2008;86: 197–204.
11. Peña-Rey I, Martínez de Aragón V, Mosquera M, de Ory F, Echevarrıa JE, Measles Elimination Plan Working Group in Spain. Measles risk groups in Spain: implications for the European measles-elimination target. Vaccine. 2009;27:3927–34.https://doi.org/10.1016/j.vaccine.2009.04.024. 12. Theeten H, Hutse V, Hens N, Yavuz Y, Hoppenbrouwers K, Beutels P,
Vranckx R, van Damme P. Are we hitting immunity targets? the 2006 age-specific seroprevalence of measles, mumps, rubella, diphtheria and tetanus in belgium. Epidemiol Infect. 2010;139(4):494–504.https://doi. org/10.1017/s0950268810001536.
13. Poethko-Müller C, Mankertz A. Sero-epidemiology of measles-specific IgG antibodies and predictive factors for low or missing titres in a German population-based cross-sectional study in children and adolescents (KiGGS). Vaccine. 2011;29(45):7949–59.https://doi.org/10.1016/j.vaccine. 2011.08.081.
14. Mollema L, Smits G, Berbers G, Van Der Klis F, Van Binnendijk R, De Melker H, Hahné S. High risk of a large measles outbreak despite 30 years of measles vaccination in the Netherlands. Epidemiol Infect. 2014;142(5):1100–8.
15. Keenan A, Ghebrehewet S, Vivancos R, Seddon D, MacPherson P, Hungerford D. Measles outbreaks in the UK, is it when and where, rather than if? a database cohort study of childhood population susceptibility in liverpool, UK. BMJ Open. 2017;7(3):014106.https://doi.org/10.1136/ bmjopen-2016-014106.
16. Tomášková H, Zelená H, Kloudová A, Tomášek I. Serological survey of measles immunity in the Czech Republic, 2013. Cent Eur J Public Health. 2018;26(1):22–7.https://doi.org/10.21101/cejph.a5251.
17. Gay NJ. The theory of measles elimination: implications for the design of elimination strategies. J Infect Dis. 2004;189 Suppl 1:27–35.https://doi. org/10.1086/381592.
18. Mossong J, Hens N, Jit M, Beutels P, Auranen K, Mikolajczyk R, Massari M, Salmaso S, Tomba GS, Wallinga J, Heijne J, Sadkowska-Todys M, Rosinska M, Edmunds W. Social contacts and mixing patterns relevant to the spread of infectious diseases. PLoS Med. 2008;5(3):74.https://doi.org/ 10.1371/journal.pmed.0050074.
19. Danon L, Read JM, House TA, Vernon MC, Keeling MJ. Social encounter networks: characterizing Great Britain. Proc R Soc B. 2013;280(1765): 20131037.
20. Horby P, Thai PQ, Hens N, Yen NTT, Thoang DD, Linh NM, Huong NT, Alexander N, Edmunds W, Duong TN, et al. Social contact patterns in Vietnam and implications for the control of infectious diseases. PLoS ONE. 2011;6(2):16965.
21. Read JM, Lessler J, Riley S, Wang S, Tan LJ, Kwok KO, Guan Y, Jiang CQ, Cummings DA. Social mixing patterns in rural and urban areas of southern China. Proc R Soc Lond B Biol Sci. 2014;281(1785):20140268. 22. le Polain de Waroux O, Cohuet S, Ndazima D, Kucharski AJ, Juan-Giner
A, Flasche S, Tumwesigye E, Arinaitwe R, Mwanga-Amumpaire J, Boum Y, Nackers F, Checchi F, Grais RF, Edmunds W. Characteristics of human encounters and social mixing patterns relevant to infectious diseases spread by close contact: a survey in Southwest Uganda. BMC Infect Dis. 2018;18(1):172.https://doi.org/10.1186/s12879-018-3073-1.
23. Melegaro A, Del Fava E, Poletti P, Merler S, Nyamukapa C, Williams J, Gregson S, Manfredi P. Social contact structures and time use patterns in the Manicaland Province of Zimbabwe. PLoS ONE. 2017;12(1):0170459. 24. Read JM, Edmunds W, Riley S, Lessler J, Cummings DAT. Close
encounters of the infectious kind: methods to measure social mixing behaviour. Epidemiol Infect. 2012;140(12):2117–30.https://doi.org/10. 1017/S0950268812000842.
25. Smieszek T, Barclay VC, Seeni I, Rainey JJ, Gao H, Uzicanin A, Salathé M. How should social mixing be measured: comparing web-based survey and sensor-based methods. BMC Infect Dis. 2014;14:136.https://doi.org/ 10.1186/1471-2334-14-136.
26. Smieszek T, Castell S, Barrat A, Cattuto C, White PJ, Krause G. Contact diaries versus wearable proximity sensors in measuring contact patterns at a conference: method comparison and participants’ attitudes. BMC Infect Dis. 2016;16(1):341.
28. Meyer S, Held L. Incorporating social contact data in spatio-temporal models for infectious disease spread. Biostatistics. 2016.https://doi.org/ 10.1093/biostatistics/kxw051.http://arxiv.org/abs/1512.01065v2. 29. Santermans E, Goeyvaerts N, Melegaro A, Edmunds W, Faes C, Aerts M,
Beutels P, Hens N. The social contact hypothesis under the assumption of endemic equilibrium: elucidating the transmission potential of vzv in europe. Epidemics. 2015;11:14–23.https://doi.org/10.1016/j.epidem. 2014.12.005.
30. Diekmann O, Heesterbeek JAP, Roberts MG. The construction of next-generation matrices for compartmental epidemic models. J R Soc Interface. 2010;7(47):873–85.https://doi.org/10.1098/rsif.2009.0386. 31. Guerra FM, Bolotin S, Lim G, Heffernan J, Deeks SL, Li Y, Crowcroft NS.
The basic reproduction number (r0) of measles: a systematic review. Lancet Infect Dis. 2017.https://doi.org/10.1016/S1473-3099(17)30307-9. 32. Centers for Disease Control and Prevention. CDC Health Information for
International Travel 2014: The Yellow Book. Oxford: Oxford University Press; 2014.
33. Leung K, Jit M, Lau EHY, Wu JT. Social contact data for Hong Kong. Version. 2018.https://doi.org/10.5281/zenodo.1165562.
34. Melegaro A, Fava ED, Poletti P, Merler S, Nyamukapa C, Williams J, Gregson S, Manfredi P. Zimbabwe social contact data. Version. 2017. https://doi.org/10.5281/zenodo.1127694.
35. Grijalva CG, Goeyvaerts N, Verastegui H, Edwards KM, Gil AI, Lanata CF, Hens N. Peruvian social contact data. Version 1.0. 2017.https://doi.org/10. 5281/zenodo.1215891.
36. Mossong J, Hens N, Jit M, Beutels P, Auranen K, Mikolajczyk R, Massari M, Salmaso S, Tomba GS, Wallinga J, Heijne J, Sadkowska-Todys M, Rosinska M, Edmunds W. POLYMOD social contact data. Version 1.1. 2017.https://doi.org/10.5281/zenodo.1215899.
37. Béraud G, Kazmercziak S, Beutels P, Levy-Bruhl D, Lenne X, Mielcarek N, Yazdanpanah Y, Boëlle P-Y, Hens N, Dervaux B. France social contact data. Version. 2018.https://doi.org/10.5281/zenodo.1158452. 38. R Core Team. R: a language and environment for statistical computing.
Vienna: R Foundation for Statistical Computing; 2018. https://www.R-project.org/.
39. Funk S. Socialmixr: social mixing matrices for infectious disease modelling. 2018. R package version 0.0.1.https://cran.r-project.org/ package=socialmixr.
40. Funk S. Epimixr: epidemiological analysis using social mixing matrices. 2018. R package version 0.0.1.https://github.com/sbfnk/epimixr. 41. Li J, Blakeley D, Smith RJ. The failure ofr0. Comput Math Methods Med.
2011;2011:1–17.https://doi.org/10.1155/2011/527610.
42. de Quadros C, Hersh B, Nogueira A, Carrasco P, da Silveira C. Measles eradication: experience in the americas. MMWR Morb Mortal Wkly Rep. 1999;48(SU01):57–64.
43. Andrus JK, de Quadros CA, Solórzano CC, Periago MR, Henderson D. Measles and rubella eradication in the americas. Vaccine. 2011;29 Suppl 4: 91–6.https://doi.org/10.1016/j.vaccine.2011.04.059.
44. Orenstein WA, Papania MJ, Wharton ME. Measles elimination in the united states. J Infect Dis. 2004;189(Suppl 1):1–3.
45. Centres for Disease Control and Prevention. School immunization requirements for measles – united states, l982. MMWR Morb Mortal Wkly Rep. 1982;31:65–7.
46. Salmon DA, Teret SP, MacIntyre CR, Salisbury D, Burgess MA, Halsey NA. Compulsory vaccination and conscientious or philosophical exemptions: past, present, and future. Lancet. 2006;367(9508):436–42.https://doi.org/ 10.1016/S0140-6736(06)68144-0.
47. Markowitz LE, Preblud SR, Orenstein WA, Rovira EZ, Adams NC, Hawkins CE, Hinman AR. Patterns of transmission in measles outbreaks in the United States, 1985–1986. N Engl J Med. 1989;320(2):75–81.https:// doi.org/10.1056/NEJM198901123200202.
48. Hutchins SS, Baughman AL, Orr M, Haley C, Hadler S. Vaccination levels associated with lack of measles transmission among preschool-aged populations in the United States, 1989–1991. J Infect Dis.
2004;189(Supplement_1):108–15.
49. Anderson RM, May RM. Age-related changes in the rate of disease transmission: implications for the design of vaccination programmes. J Hyg (Lond). 1985;94(3):365–436.
50. Orenstein WA, Perry RT, Halsey NA. The clinical significance of measles: a review. J Infect Dis. 2004;189(Supplement 1):4–16.
51. World Health Organization. Measles: key facts. 2018.http://www.who.int/ news-room/fact-sheets/detail/measles. Archived athttp://www. webcitation.org/713YeLhwt. Accessed 20 July 2018.
52. Anis E, Grotto I, Moerman L, Warshavsky B, Slater PE, Lev B, Israeli A. Measles in a highly vaccinated society: the 2007-08 outbreak in Israel. J Infect. 2009;59:252–8.https://doi.org/10.1016/j.jinf.2009.07.005. 53. Truelove SA, Graham M, Moss WJ, Metcalf CJE, Ferrari MJ, Lessler J.
Characterizing the impact of spatial clustering of susceptibility for measles elimination. Vaccine. 2019;37(5):732–41.https://doi.org/10.1016/ j.vaccine.2018.12.012.
54. Metcalf CJE, Farrar J, Cutts FT, Basta NE, Graham AL, Lessler J, Ferguson NM, Burke DS, Grenfell BT. Use of serological surveys to generate key insights into the changing global landscape of infectious disease. Lancet. 2016.https://doi.org/10.1016/S0140-6736(16)30164-7.
55. Trentini F, Poletti P, Merler S, Melegaro A. Measles immunity gaps and the progress towards elimination: a multi-country modelling analysis. Lancet Infect Dis. 2017;17(10):1089–97. https://doi.org/10.1016/s1473-3099(17)30421-8.
56. Prem K, Cook AR, Jit M. Projecting social contact matrices in 152 countries using contact surveys and demographic data. PLoS Comput Biol. 2017;13(9):1005697.https://doi.org/10.1371/journal.pcbi.1005697.
Publisher’s Note