Feature Based Growth Rate Analysis and Pattern
Recognition of Mesenchymal Stem Cells
R.Nathiya Research Scholar
Pondicherry Engineering college Kalapet, Puducherry -605014
S.Priyavadani M.Tech - ECE
Christ College of Engineering & Technology Moolakulam, Puducherry – 605010
G.Sivaradje
Electronics and Communication Engineering
Pondicherry Engineering College, Kalapet, Puducherry -605014
Abstract - Stem cell is a generic cell that can make exact copies of it. Stem cells are master cells and can grow into different cell types in the body during evolution. Different parts of your body are made up of different kinds of cells. Stem cells are not specific to one area in the body and can turn into skin, bone, blood or brain cells. Occasionally stem cells do not build up accurately once injecting to human body, which will lead to complicated. To avoid this problem the growth of the stem cell should be monitored with the help of morphological and textural characteristics. Meanwhile, with the rapid development of feature extraction and pattern recognition techniques, it provides people with new thought on the study on complex image retrieval while it’s very difficult for traditional machine learning method to get ideal retrieval results. Pattern Recognition is one of the very important and actively searched trait or branch of artificial intelligence. It is the science which tries to make machines as intelligent as human to recognize patterns and classify them into desired categories in a simple and reliable way. For this reason, proposed a new approach for image features based on Modified Non Subsampled Contourlet Transform (MNSCT), Radial Basis Function Kernel Principal Component Analysis (RBFKPCA), and Relevance Vector Machine (RVM). The proposed method is used to extract the salient features of stem cell images by using efficiency of Modified Non Subsampled Contourlet Transform (MNSCT) that finds the best feature points. Relevance Vector Machine (RVM) is a probabilistic model whose functional form is equivalent to the SVM. It achieves comparable recognition accuracy to the SVM, yet provides a full predictive distribution, and also requires substantially fewer kernel functions.
Keywords: Mesenchymal stem cells - Non Sub sampled Contourlet Transform (NSCT) - Modified Non Sub sampled Contourlet Transform (MNSCT) - Radial Basis Function Kernel Principal Component Analysis (RBFKPCA) - Support Vector Machine (SVM) - Relevance Vector Machine (RVM).
I. INTRODUCTION
algorithm is used to reduce the number of features. The proposed method is explained in section 2, Section 3 shows the Results and Discussions of this method, and finally concludes this remarks in section 4.
II. MATERIALS AND METHODS
Pattern recognition is used for the identification of the healthier stem cells used for analyzing the growth rate. There are various methods for finding Pattern Recognition, Relavance vector machine (RVM) is the most significant and efficient method used for Classification. In order to find the growth rate of Stems cells accurately, sparse property is implemented in RVM. Growth rate is calculated based on some texture features. The features required for the calculation of the growth rate are extracted using modified NSCT with Radial basis function of KPCA. In modified NSCT the various filters present in the filter bank are combined as a single filter, hence the filter used modified NSCT has the efficiency of all the filters in the filter bank. The features of mesenchymal stem cells are extracted by using modified NSCT and the patterns are recognized by RVM and the overall block diagram shown in given below
Fig: 1 Overall architecture
2.1NON SAMPLED CONTOURLET TRANSFORM (NSCT):
Fig: 2 NSCT Structure
When the decomposition level of NSPFB is the low pass sub-band image and L high pass sub-band images can be obtained through decomposition. Because there is no down-sampling, all the sub-band images have the same sizes with the original images. The realization process of NSDFB is up-sampling can be conducted on the filter, and secondly the wave filtering is conducted on the decomposed sub-band images in the two channel direction of last stage, so as to achieve the more accurate directional decomposition in the frequency domain. 2 t directional sub-band images which have the same size as the original images can be obtained through l stage directional decomposition of NSDFB on a scale sub-band image. NSPFB is combined with NSDFB to achieve NSCT. The band-pass sub-band images, which are obtained after decomposing the original images through NSPFB, are NSDFB and the band-pass directional sub-band images can be obtained, so as to achieve the multi-scale and multi-direction decomposition of images.
2.1.1 NSCT ALGORITHM:
1. Compute the NSCT of the input image for N levels. 2. Estimate the noise standard deviation of the input image. 3. For each level DFB,
(a) Estimate the noise variance.
(b) Compute the threshold and the amplifying ratio.
(c) At each pixel, compute the mean and the maximum magnitude of all directional subbands at this level, and classify it by (1) into strong edges, weak edges, or noises.
(d) For each directional subband, use the nonlinear mapping function given in (2) to modify the NSCT coefficients according to the classification.
4. Reconstruct the enhanced image from the modified NSCT coefficients.
2.2 MODIFIED NON SUBSAMPLED CONTOURLETTRANSFORMATION (NSCT):
In former NSCT method, the directional filter bank contains one or more filters but the particular filter is used according to the input images which are undergone to decomposition. And also aliasing effect is present in the directional filter. To increase the efficiency of the decomposition filter, the filters present in the directional filter banks are combined to form a single filter to utilize the advantage of all the filters and also more filters are used in the modified NSCT. This will increase the decomposition efficiency by make use of all the filters.
Filter in MNSCT:
1. "Haar" Filters
2. McClellan Transformed Of The Filter
3. Ladder Filters
4. Ideal Filter
2.3 PRINCIPAL COMPONENT ANALYSIS (PCA):
Principal Component Analysis (PCA) [11] is a statistical technique used to reduce a set of correlated multivariate measurements to a smaller set where the features are uncorrelated to each other and also it is a powerful technique for extracting structure from possibly high dimensional data sets. The goal of PCA is to reduce the dimensionality of the data whileretaining as much as possible of the variation present in the dataset. Each dimensionality reduction technique finds an appropriate transformation by satisfying certain criteria.
2.3.1 PCA ALGORITHM:
1. Subtract the mean from all the data points
2. Compute the covariance matrix S= ∑c
n=1 Xn X n T
3. Diagonalize S to get its eigen values and eigenvectors
4. Retain c eigenvectors corresponding to the c largest eigenvalues such that
equals the desired variance to be captured.
5. Project the data points on the eigenvectors
2.4 KERNEL PRINCIPAL COMPONENT ANALYSIS (KPCA):
kernel principal component analysis (kernel PCA) [12] is an extension of principal component analysis (PCA) using techniques of kernel methods .Using a kernel, the originally linear operations of PCA are done in a reproducing kernel Hilbert space with a non-linear mapping. Kernel based principle components analysis is a non linear PCA created using the kernel trick. KPCA maps the original inputs into a high dimensional feature space using a kernel method. To transform the current features into a high-dimensional space and the calculate eigenvectors in this space. To ignore the vectors with really low eigen values and then do learning in this transformed space. KPCA is computationally intensive and takes a lot more time compared to PCA. The reason being that the number of training data points in PCA is much higher then KPCA.There are many types of kernels like Gaussian, Polynomial and the Sigmoid, comparing to the other types of kernels, they had better advantages in the Radial Basis Function of Kernel Principal Component Analysis.
2.5 RADIAL BASIS FUNCTION KPCA (RBFKPCA):
Radial basis function is a kind of supervised neural networks. It has a design of NN as curve-fitting problem and also learning the find surface in multidimensional space best fit to training data. Generally it has been used the multidimensional surface to interpolate the test data and find the approximate function with linear combination of Radial basis functions a F(x) = S wi h(x) ,Where h(x) is mostly Gaussian function
N j j c
j 1 j / 1
Fig: 3 Radial Basis Function Architecture
When the above architecture has three types of layers Input layer, hidden layer, Output layer. The input layer has denoted by f(x), the source nodes that connect to the network to its environment and the second layer is the hidden layer, these layer provides hidden units provide a set of basis function and it has a high dimensionality layers and final layer is the Output layer, these layer has functions of x1 , x2 , x3 , x4 …xn has linear combination of hidden functions.
2.6 SVM
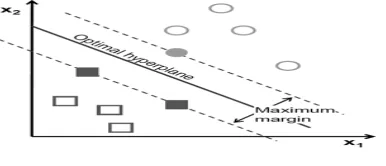
Support Vectors Machines (SVM) [14] has recently shown their ability in pattern recognition and classification [15].The potential of the SVM is illustrated on a 3D object recognition task using the Coil database and on an image classification task using the Corel database. The images are either representated by a matrix of their pixel values (bitmap representation) or by a color histogram. Support vectors (SVs) contain highlighted pixels that help to create the margins or boundaries in an image. SVM is a mostly used method in pattern recognition and object recognition initially, given a set of points which belong to either of two classes; a linear SVM finds the hyper plane leaving the largest possible fraction of points of the same class on the same side, while maximizing the distance of either class from the hyper plane.
Support Vector Machines (SVM) as a classification method. It has been provide better classification results that other widely used pattern methods, such as the maximum likelihood and neural network classifiers. SVM are very attractive for the classification of remotely sensed data.
The SVM approach seeks to find the optimal separating hyper plane between classes by focusing on the training cases that are placed at the edge of the class descriptors. These training cases are called support vectors. Training cases other than support vectors are discarded. This way, not only is an optimal hyper plane fitted, but also less training samples are effectively used; thus high classification accuracy is achieved with small training sets.This feature is very advantageous, especially for remote sensing datasets and more specifically for Object-based Image Analysis, where object samples tend to be less in number than in pixelObject-basedapproaches.
Fig 3.2 Hyper plane in SVM
parameters whose values are determined during the learning process. Relevance Vector Machine (RVM) makes the probabilistic predictions and yet that keeps the excellent predictive performance of the support vector machine. It also can make the preservation of the sparseness property of the SVM. In fact, for a wide variety of test problems it actually results in models which are dramatically sparser than the corresponding SVM, while sacrificing little if anything in the accuracy of prediction. RVM is used for detecting the cancer cells and the classification of DNA sequences. It utilizes fewer kernel functions than SVM.
Relevance vector machine (RVM) is a special case of a sparse linear model, where the basis functions are formed by a kernel function φ centered at the different training points While this model is similar in form to the support vector machines (SVM), the kernel function here does not need to satisfy the Mercer’s condition, which requires φ to be a continuous symmetric kernel of a positive integral operator.
Multi-kernel RVM is an extension of the simple RVM model. It consists of several different types of kernels. The sparseness property enables automatic selection of the proper kernel at each location by pruning all irrelevant kernels, though it is possible that two different kernels remain on the same location.
III. RESULTS AND ANALYSIS
3.1FEATURE EXTRACTION RESULTS
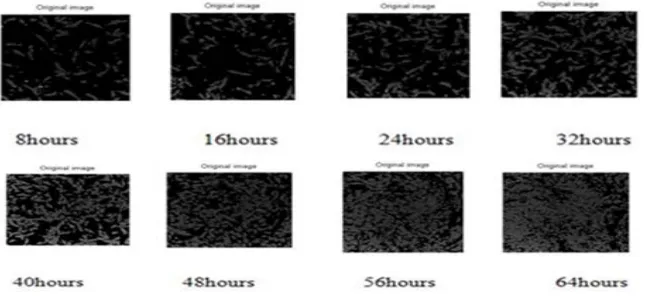
Fig: 4 Input Images Mesenchymal Stem Cells
The eight frames of images can be reclaiming from the 72hour video lapse of distinctive hours subsequently. When the above Mesenchymal Stem Cells are progenitor connective tissues cells. The height and width of stem cells is 720pixels. When the above images can be calculated from the different hours of growing the stem cells to analyze the growth rate.
Fig: 5 Decomposed NSCT Original Images Mesenchymal Stem Cells
Input Hours Autocorrelation Contrast Dissimilarity Energy Homogenity Entropy Image 1 8 hours 45.9456 4.6422 0.9417 0.5787 0.8215 3.6407 Image 2 16 hours 42.5495 4.6406 1.0063 0.5787 0.8134 3.7506 Image 3 24 hours 38.5282 5.7792 1.1490 0.4938 0.7956 4.8811 Image 4 32 hours 32.3821 6.4195 1.3116 0.4128 0.7752 4.0047 Image 5 40 hours 29.8924 7.3105 1.4031 0.3901 0.7638 4.0463 Image 6 48 hours 24.0953 8.3983 1.5304 0.3773 0.7479 4.0811 Image 7 56 hours 20.1897 8.3983 1.5429 0.3968 0.7463 4.0600 Image 8 64 hours 17.4842 8.1784 1.5115 0.4224 0.7503 4.0252
Table 1: Tabulation of Non Sampled Contour let Transform
Table 2: Tabulation of Modified Non Sampled Contour let Transform
Fig: 6 NSCT+PCA+SVM Graphs
The above graph is denoted by using NSCT+PCA+SVM. SVM (Support Vector Machine) is a binary classifier. It is used to separates the classified data and it is a non-probab ilistic decision machine.SVM has been growing linearly with the size of training set, they had estimate the error is minimized and maximize the margin of the lines.Compare to the MNSCT+KPCA+RVM , the above graph performance is poor because SVM had some of the limitation has cross validation of parameters is c and ∑ and the Decisions at outputs instead of probabilities then they had a large number of kernels (in spite of sparsity) and also the kernels must satisfy Mercer criterion
Fig: 7 MNSCT+KPCA+RVM Graphs
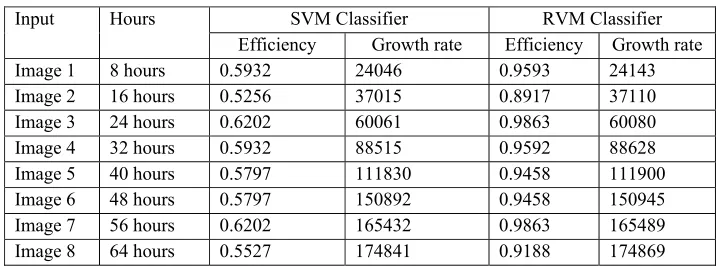
Input Hours SVM Classifier RVM Classifier
Efficiency Growth rate Efficiency Growth rate
Image 1 8 hours 0.5932 24046 0.9593 24143
Image 2 16 hours 0.5256 37015 0.8917 37110
Image 3 24 hours 0.6202 60061 0.9863 60080
Image 4 32 hours 0.5932 88515 0.9592 88628
Image 5 40 hours 0.5797 111830 0.9458 111900 Image 6 48 hours 0.5797 150892 0.9458 150945 Image 7 56 hours 0.6202 165432 0.9863 165489 Image 8 64 hours 0.5527 174841 0.9188 174869
The above table 3 denote the SVM and RVM classifiers. Compare to the SVM, RVM is a Bayesian sparse kernel technique for regression and classification. When the efficiency and growth rate of the SVM classifier values are decreased compare to the RVM classifier because they had some of the peculiar properties of RVM had the error rates compare to the SVM is less.They had no cross validation of parameters. It is one of the applicable to wide choice of basis function multi-class classification and theProbabilistic outputs dramatically fewer kernels (by an order of magnitude) but, slower to train than SVM.
3.3 OVERALL PERFORMANCE
Fig: 8 Overall Graphs
When the above graph denotes the overall performance of graphs. The x - axis denotes the images and the y-axis denotes the growth rate. The red color denotes the NSCT, PCA, SVM performance and the blue color denotes the MNSCT, KPCA, RVM performance .The performance of modified NSCT, KPCA, and RVM is better performance compare to the SVM performance.
IV. CONCLUSIONS
In this paper, introduced an efficient feature-based extraction for mesenchymal stem cell images, which is employing with MNSCT + KPCA + RVM, transform. As a result, the proposed method gives promising results compare to the NSCT+PCA+SVM. According to the experiments, we can conclude that the method proposed is maintaining good performance; The different classifier models analyzed in this report show that they are very promising to achieve higher efficiency and speed in lesser time results. Also the KPCA is used for dimensionality reduction. The RVM classifier performs well and provides high recognition rate compared to SVM. In future using the multikernel RVM for getting the better accuracy of the images.
REFERENCES
[1] Cunha, A.L., J. Zhou and M.N. Do, 2005. The non sub sampled contour let transform: Theory, design, and applications. IEEE Trans. Img. Proc., 15(10): 3089-4101.
[2] Do, M.N. and M. Vetterli, 2005. The contourlet transform: An efficient directional multiresolution image representation. IEEE Trans. Image Process., 14(12): 2091-2106.
[3] Bamberger, R.H. and M.J.T. Smith, 1992. A filter bank for the directional decomposition of images: Theory and design. IEEE Trans. Signal Process., 40(4): 882-893.
[4] H.P. Chan, K.Doi, S.Galhotra, C.J.IIVyborny, H.Macmahon & P.M. Jokich, “Image feature Analysis and Computer- Aided Diagnosis in Digital Radiography”, Medi.Phy.,Jul-Aug 1987,Vol.14 ,pp. 538-548.
[5] Davis DH, Dance DR. “Automated computer detection of clustered calcifications in digital mammogram”, Physics in medicine and Biology. Vol.35, Aug -1990, pp.1111-1118.
[6] Nigel RH, Nishikawa RM, Papaioannou J, Doi K, “Analysis of methods for reducing false positives in the automated detection of clustered microcalcifications in mammograms”, Medical physics, Vol. 25 , Aug- 1998, pg.1502-1506
[7] Bazzani A, Bevilacqua a, Bollini D, Brancaaio R, Camanini R, Lancoonelli N et al “Automated detection of clustered microcalcifications in digital mammograms using SVM classifier”, In Proceedings of the European Symposium on Artificial Networks, April 2000, pp.195-200.
[8] M.-K. Hu, “Visual pattern recognition by moment invariants”, IRE Trans. Inform. Theory, pp. 179–187, Feb. 1962.
[9] C. Teh and R. Chin, “On image analysis by the methods of moments”, IEEE Trans. Pattern Anal. Machine Intell., vol. 10, pp. 496– 513, July 1988.
[17] M. E. Tipping, “The relevance vector machine,” in Advances in Neural Information ProcessingSystems, vol. 12, S. A. Solla, T. K. Leen, and K.-R. Müller, Eds. Cambridge, MA: MIT Press, 2000
[18] W. Liyang, Y. Yongyi, R. M. Nishikawa, M. N. Wernick, and A. Edwards, “Relevance vector machine for automatic detection of clustered microcalcifications,” IEEE Trans. Med. Imag., vol. 24, no. 10, pp. 1278–1285, Oct. 2005.
[19] F. Melgani and L. Bruzzone, “Classification of hyperspectral remote sens- ing images with support vector machines,” IEEE Trans. Geosci. Remote Sens., vol. 42, no. 8, pp. 1778–1790, Aug. 2004.