A Survey on Integrating Business Intelligence with
Cloud Computing
Poornima Nedunchezhian
PG Scholar
Department of computer science
and engineering,
Anna University of technology,
Coimbatore,
India.
Vidhyasree Venkatesh
Moorty
PG Scholar
Department of computer science
and engineering,
Anna University of technology,
Coimbatore,
India.
Palanikkumar Durai
Thirunavukkarasu
Assistant Professor
Department of computer science
and engineering,
Anna University of technology,
Coimbatore,
India.
ABSTRACT
Business Intelligence (BI) is the term that is widely used in recent days. BI is used to predit the future of the organization so that it can be compared (Bench marked) with the other related organization and the results can be used for further developement. This BI with Data Warehousing (DW) and Data Mining (DM) help to find the patterns in business using 3 dimensional (3D) views. The BI along with Cloud Computing is used for resource sharing and database sharing but the issues in the cloud computing ia also embedded on BI. This paper surveys these issues.
Keywords
Online Analytical Processing (OLAP), Data Base Management System (DBMS), Entity Ralationship (ER),Extract Transform Load (ETL), Artificial Intelligence (AI), Knowledge Discovery in Database (KDD) ,Decision Support system (DSS),Relational Database Management Syatem (RDBMS), Structured Query Language (SQL)
1.
INTRODUCTION
The BI is the most attractive technology for the improvement of a business organization. The BI should have a database to store all the business data so that all these databases are merged in to a larger database called Data Warehousing (DW).The database is a collection of data and the user can access/ reterive several views using queries. The DW is the relational integration of many databases. The DW has a staging area which does data cleansing, then the cleansed data is sent to operational data store (ODS) then finally sent back to DW. DW can be split into number of data marts. The DW and the data marts have the chicken and egg syndrome.The DM is the extraction of specific data from a largest database called DW. The results of DM are the analysis of the performance of an organization and report generation. In DM the three dimensional reports such as bar charts, graphs etc predict the business process.
The Figure 1 shows the DW is the collection of several databases which is used by the BI. The 3D reports are generated for bench marking. After the staging area they are sent to the presentation servers which will handle the organized data. The DW is the combination of the related databases and its storing is done in 2 approach namely dimensional and normalized model. The cloud computing has several advantages such as virtualization (i.e.) hiding all the complexities such as storage, network and host from the
user/customers. The multitenency is allowing several users to work on the same software.
The cloud computing systems are Amazon EC2, Microsoft Azure etc. The disadvantage also gets inherited automatically in the BI such as privacy and the security issue.
Fig1: BI overview.
The two dimensional reports contains simply the rows and columns and the relationships between them whereas 3D report give the diagramatic representation and also help for the logical statistical analysis of the data.
There are several BI tools that may be offline/online. These give the results in Excel, Spreadsheet, Digital dashboard, Piecharts, Barcharts, DM, and DW. There are 1) Open source free products such as: Eclipse BIRT project, Rapid Miner, SpagoBIRI, KNIME 2) Open source commercial products: Palo (OLAP db)-OLAP server-work sheet server and ETL server, Pentaho- reporting, analysis, dashboard, DM 3) Property free products: Intel soft and Micro strategy etc. 4) Proprietary products: IBM Cognos, jackbe, jreport, List and label, Informatica, myDIALS, SAP, SAS reports and zoho reports.
Progen is an open source BI tool that has Piπthat allows user to share the reports. Konnet is used for the community analysis. It gives the user Multidimensional OLAP (MOLAP) and gives demographic survey (dynamically change with time. These reports can also be embedded into the web site and its live report can be shown).
The decision support system (DSS) provides the decision for all their customers i.e. business, organization etc. This has
Databases
BI 3D reports
DW
Cloud
the knowledge base (database) as in Artificial Intelligence (AI). The taxonomies of DSS are 1) Community- driven, 2) Data-driven, 3) Document-driven, 4) knowledge-driven and 5) Model-driven. There are three components in DSS 1) Database/ knowledge base, 2) Model and 3) Unique identifier.
2.
MONITORING EXAMPLE
0 20 40 60 80 100
2012 2016 2020
Raymond
Life Style
Fig 2: Textile report.
In figure 2 the two textiles namely Raymond and Life style are taken for example. These two databases have their own attributes. They contain rows such as the quantity, dress type, barcode, cost per item and type .The datawarehouse combines these two databases are stored in the normalized approach by eliminating the redundancy using third normalization form (3NF). This has all the rows and columns of these databases. The null values also exist.
The data mining is applied on the textile datawarehouse and thus the comparision of both the textile is made and the result is generated and is reported to the requested user/customer. The unique identifier (Uid) is used to find the needed row from massive storage. The DW can also contain the aggregated data on the sales percentage, and the details regarding the data stored in the DW.
The bar chart is the 3D report generated as the result of mining. Here the profit of these two textiles is analyzed and the future prediction is done for the years 2016 and 2020. On seeing these reports the textiles finds the reason for the degradation of the profit and can rectify it.
3.
RELATED WORK
A database is a massive collection of raw data. It is used in business applications. The profit or loss/ degradation or in short, performance analysis should be done frequently in business environment for effective trade. So the analysis should be made on the raw data collected (i.e.) database (db). The DW is also a database that contains data about the data (metadata), raw data and the summarized details of the data, which helps in easier analysis and for report generation. The DM is a technique used on DW to extract only essential information from large values of data.
The data in the DW is stored by several operational systems which are treated by many data stores before loading. The DW can be subdivided into data marts because of these properties DW has its applications in business intelligence (BI). In DW, ETL [1] is a tool for BI, which extracts transforms and load the data in the database.The DW maintains the data history and integrates all the data sources to give unique data model.
The customer relationship management (CRM) system is the application of DW used in business. There are two approaches for data storing. One is dimensional approach which has a dimensional model/ star schema. The contents inside the model remain static and cannot be changed. The second model is normalized approach, uses ER model or normalized model. In a normalized approach the data are stored according to normalization rules. Here, those bulk data are organized into categories of related terms and they are considered as seperate entities.
Each and every entity is remodelled by new table and integrating these tables is difficult.Both these model uses ER diagram.There are two methodologies 1) Bottom-Up approach: the data marts are used for the report visualization. These data marts can be integrated and form a DW, and 2) Top-Down design: The DW contains all the information about the organization, it eliminates the noisy data and stores only lower level data. This approach gives a framework for BI.
Based on the data stored on DW they can be called as 1) subject-oriented 2) non-volatile 3) integrate and 4) time variant.The normalized way of storage avoids redundancy of data.The operational system will have the operational data store (ODS).The normalized database is not sufficient for BI report. The DW is a relational database that handles queries and performs actions.
It has online analytical processing (OLAP) [2] .This integrates the tables and so the conflicts may occur such as redundancy etc. The data in the DW is static and can be refered as a non-volatile system. The analysis is done on the prediction of the behaviour of the emerging techniques and trends. Both the DW and DM have the history of data. The subject oriented data storage stores the data on a particular business line.
If a business organization builts the own DW then the first step towards building is to develop a logical and physical design [3]. The logical design is not the exact implementaion. It has presice details regarding “how a DW should look like?” The physical design is the original implementation of DW contains data, environment, manipulations / transactions. If DW crashes the recovery is done by backup (copies of DW). In the creation of logical design we concentrate on the terms
Textile
Bar
Code
Dress
Qty
Cost per
1 item
Type
R
1
Shirt
132
1500
Ooto
R
12
Saree
221
700
Silk
LS
10
Jean
1084
5000
LS
102
Skirt
2053
1000
Bar
code
Dres
s
Qty
Cost
for 1
item
Type
1
Shirt 132
1500
R,j
12
Tie
221
700
R
Bar
code
Dres
s
Qty
Cost
per
1
item
10
Jean
1084
5000
102
skirt
2053
1000
Life Style (LS)
Data
Mining
Data warehouse
Raymond
(R)
entity and attributes. The entity is a small group of data that maps the table.
The attribute is a part of entity. There are several attributes in the table. Similar to a primary key in database a unique identifier (uid) is used to isolate one item from another. The entity representations can be done by ER model. The dimensional approach the large transaction data is divided into many dimensions for easier understanding. The dimensional approach is represented in star schema or datawarehouse schema. The diagramatic representation of star schema resembles the star topology.The centre location has original transaction table which is connected to several small dimensional model.
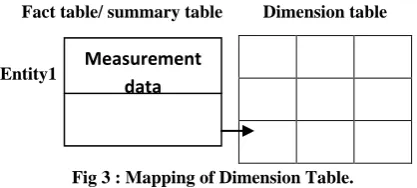
In normalized approach their normal form is used rather than star topology. In figure 3 there are two objects in DW schema. 1) Fact table 2) Dimension table. The normalized approach is represented by the ER-model whereas the star schema is used for the dimensional approach. The star schema has the fact and the dimensional table. The fact table has the numerical measurements and they are additive in nature. The fact table will have the id that maps the dimension table, which has the texual details regarding fact table.
Fact table/ summary table Dimension table
Entity1
Fig 3 : Mapping of Dimension Table.
The logical design [4] is converted into physical design by representing the logically collected data such as entities, relationship between those entities, attributes, unique identifier. There can be several views on a table. The query language such as SQL is responsible for transcation in the physical structure. When a query is applied on DW the view generation may take some time for report calcutaion. So the DW stores the materilized view of database which avoids the long running queries and this view looks like a separate table.
In figure 4 the DM extracts the data from large database/ DW. This helps to analyze the future behaviour of the organization which the analyst cannot predict. The mining generates automated analysis with the help of DM tools. This is done on DW with the help of powerful processor and with DM algorithms. The data collection is done on tapes, disks etc. The access to a data is done by SQL on RDBMS [5]. The DW is implemented by the technology OLAP. The greatest advantage of DM is the automatic prediction.
Fig 4 : DM Process.
It also helps the analyst to discover the unknown business patterns in BI. The DM uses techniques such as artificial neural networks, decision trees, genetic algorithms, nearest neighbour methods and rule methods.The data model is developed for any question and can be used as a reference for the unknown questions as a model for reference. OLAP server is used in BI.
In Walmart [6] (in US) the DM process on allowed on DB. It has 7.5 tera bytes of data on which the suppliers are allowed to mine the DW. This DM helps the suppliers to analyze the details of frequently bought products and helps the analyzer to find patterns that are bought on a month/ year/weak etc. The business yeild can be improved or maintained with this statistics. There exists four type of relation in DW 1) classes 2) clusters 3) association and 4) sequential pattern. ETL is applied on DW and the results are stored in multidimensional array and then the analysis tools are applied for useful report generation.
There are two drivers namely 1) database size: As the size of db increases the complexity of storing and performing the transaction increases 2) Query: Complex query for acquring the complex data. Depend on these methods artificial intelligence (AI), machine learning and DBMS the requried user data can be extracted from large db. The DM can be automatic or semi- automatic. For manual extraction of data we use bayes theorem and regression analysis of data. This bridges the gap between the statistics and behaviour. In figure 5 the Knowledge discovery in database (KDD) [7] process has five stages 1) selection 2) preprocessing 3) transformation 4) DM 5) evaluation.
Before applying DM algorithms on data mart or DW the preprocessing is done for data analysis. The data cleaning cleans the unwanted data and makes them healthy. The DM has tasks for detecting anamoly, clustering and summarization. The final step in the KDD generates several data patterns. Those data patterns may/ maynot be useful to users. Pattern is not available in the previous analyzed data set and is referrred as „overfitting‟. There are several standards for DM process such as CRISP-DM-1.0 and Java Data Mining (JDM) standard. There are many applications in DM such as games, science and engineering, business and spatial DM. There are several issues in DM such as geographic DW development support, temperature representaions and discovering diverse data types.
Fig 5 : Knowledge Discovery in Data base (KDD).
The BI provides details of current process and predicts the future events to improve the business application or process by integrating DM and performance mangement. BI is a technique to analyze the business data. The BI uses bench marking (i.e.) it enables the comparision with other business application for improvement of individuals business. This supports decision making at critical situation the system that is used for decision making [8] is decision support system. For a BI to be effective the data taken for analysis from database is not sufficient for effective report generation or performance comparision. The BI projects must be prioritized for certain benifits such as elimination of cost in the generation of report and reduced time consumption. The generated report can also alarm the user by showing the variation (colour, sounds etc). The BI data must be protected
Measurement
data
Foreign key
User
Report
DM
DW
OLAP
Server
Selection
Evaluation
Transformation
Pre processing
Data Mining
by some one from others. This BI data should be flexible and can be changed on demand. The semi structured data are used only once in the business. These data includes email, chats, reports, audio and vedio file etc. The organization without BI are said to be white color users. They waste the time in searching required details. The metadata contains summaries, topics etc.
Fig 6 : BI application providers
In figure 6 BI providers gives several business promises [9] to users so there occurs the confusion in choosing the best BI provider. If a BI is implemented in a proper way the new view of our business is watched. Better business comes from good decision making (by DSS) and is powered by BI. For integrating all the business needs the BI sloution throughout the business must be unique. The BI system will act as a watch dog of a company performance and inform the changes (high or low) frequently.
There are five values of BI such as isolated information based on structure, security, process and time, quality improvement, investment improvement, information workers and lowered cost. The decision tree is built in DM algorithms which segregates the new registered members from other members. The certified members are assigned with higher priority and non certified members are assigned with lower priorities. The BI uses the stack RDBMS.
The traditional BI [10] has some problems 1) User lack knowledge on territory: The uses of BI on those days are unfamiliar with tools and systems and CRM 2) Prototyping cost: To overcome the above problem the prototype is built for all projects. So the cost increases to some percentage. The budjet approval is difficult.so the returm-on-Investment (ROI) study is needed. ROI evaluate the status of our business investment (ROI = [Gain of investment-Cost of investment]/ Cost of investment) 3) Expensive infrastructure: The cost for the hardware resources are high. 4) Rigid project methodologies: These methods are not flexible enough for the development 5) Inertia: One time solution is used for all problems.
When cloud computing is integrated with BI. It fastens the self-service [11].The cloud computing accelerates the delivery time of the business projects. About 50% of the business people take critical decisions without any knowledge regarding consequences. For collecting data to make decision it take several months in accordance with the complexity of the problem. The self service BI analyzes itself without depending fully on other IT resources. The business needs will be changing basesd on culture, geography etc.
The cloud computing when integrated with BI hides the complexity of database and DW so the customers will be more satisfied. There are many cloud service models such as software-as-a-service (Saas), Platform–as–a service (Paas), infrastructure-as-a-service (Iaas). The cloud computing increases the response time of BI. The „Cloudization‟ is the business application and the data cannot be retrieved back.
Combinng cloud computing with BI the issue is also inherited in default. Those issues are security, privacy, energy waste etc. The organization should be careful in selecting the apt BI. All the business organization is fully dependent on BI and CC for the virtualization and scheduling concept. The SLA [12] are satisfied in BI cloud computing.
There are several issues in BI. 1) Organization and people 2) Data and technology. In an organization the IT professional has more stress so they donot concentrate on the improvement in the organization. To develop BI system the customers should work on BI data and change all the past data. After the delivery of the system if an organization find mismatch with their logical design [13] then the system must be reviewed untill they match with the design.
The delivered system is not on time as prescribed in SLA and the budjet. The data can be represented in several ways in different systems. There may be several unwanted data and should be cleaned up in a regular fashion else it will destroy the actual properties of BI in CC. The BI technology limits the usage of systems by reduced response time and limited flexibility for retrieval.
The DW should be sharp so that the requested data will be viewed appropriately. All the projects should meet the budjet requirement and highest priority in DW. All the applications on BI should be built on existing hardware and software application. Several million dollors are spent on a year for data gathering and analysis. If the direction of collection of data is inefficient then the total work will be a waste of time. There is only few standardized BI tool [14]. A business need is to reduce all the complex efforts and to increase the response time with the customer since they are unaware of internal details.
The cloud service providers [15] such as Amazon, Microsoft Azure etc gives the several services. When integrating it with BI there occur several issues such as 1) Moving a data to the cloud: It has largest network cost 2) Storing a data in the cloud: when storing a large database in cloud the privacy must be concentrated. Security is also another issue so the encryption keys and secure socket layer (SSL) certificates are used 3) BI component as a service: There are only limited BI vendors in cloud. These systems generate the reports 4) Integration with on premise data: This is the greatest issue since it accesses the data beyond the firewall. There are three approaches for BI with cloud 1) Specific BI solutions are provided by cloud 2) BI stack using non-standard technology 3) The cloud using specialized analytics.
The on-demand [16] IT solution is provided by BI which can be termed as SaaS. Multitenancy is one of the application of cloud computing. There are many dedicated servers that can be leased to other applications. The benefit of cloud computing for BI is the business organization need not worry for resources such as hardware, software, database etc. Since cloud is a shared environment it can share the available resource in the network on pay-per-usage scheme.
The applications in mobile BI are iphone and have no generalized standard till now. The BI centric collaboration: One of the analysis objects such as dash board is shared by all the users. Problamatic mid-market [17] enterprise: Integration of database causes overload. In cloud computing the bandwidth usage is restricted to the users. The BI acts as a stand alone system.
As the data storage increases the speed decreases i.e. both these are inversely propotional. So the solution is provided by implementing super computers instead of normal computers. A normal computer is converted into super computer in two ways 1) colossal computer [18]: It is designed by the integration of large volume of CPU eg. Cray II whereas 2) Google uses cluster computing by networking more than thousands of computers. Cloud provides: Unrestricted data storage, Data computation, Cost effective, decrement in operational resource, Optimized resource
BI
provider
s
deployment, SLA driven services, Improved data redundancy, and enhanced software development. There are several problems in cloud computing such as transition from public to private cloud. The applications in cloud needs high speed connection and large database. This database is maintained in backroom of customers. So high bandwidth is needed which is a restriction in the CC. The back up process occurs frequently to recover from system failure. The user authentication and authorization, data transport, data confidentiality, legal and security issues in cloud computing.
There are few services in BI namely business to business services (B2B) [19], Business to customer services (B2C) and self service. The services can be distributed/marketing/non-marketing services. The graph is drawn based on this information.
The BI and the performance management (PM) [20] have 12 key issues and some of them are discused here. The BI tools should understand the needs of the business. The issues in application are not renewed rather they concentrate on smaller issues. The cause and effect should be displayed to the users. For viewing the results one has to move fro one screen to another is the greatest issue in the PM.
More than 70% of the BI plan fails due to Information Quality (IQ) [20] problem. The data collection is difficult in BI. In business the sales margin, profit / loss change abruptly and without any intimation so the result generation must be according to the dynamic changes. The data preparation is affected by both internal and external factors of the organization.
The traditional database uses query based approach but when the data volume increases rapidly OLAP is used which is the extension of SQL [21]. Here the complex computations are pre-computated for the quick response. The DM has its applications in audio/ vedio/ image/hand writting recognition, risk analysis, customer retention, targeted marketing etc.
The data mining is the combination of datawarehousing and AI [22]. The data mining gives the relationship between the data and gives the decision as DSS to both the technical and non-technical users. The extracted data is the unuseful or unintelligeable, all these data are related in some way to make them meaningful.
The social network analysis (SNA) [23] has the actors/ customers and the relation among them is provided by the tie. The BI gives the real time operational environment like enterprise resource planning (ERP) [24] and customer relationship management (CRP). The services can be used without downloading the software and installing the setup to our personal computer. The larger projects are spilt into smaller ones and they run faster in the cloud environment. Figure 6 says there are three layer in BI they are data layer, logic layer and access layer.
Fig 6: BI Layers.
4.
CONCLUSION
Eventhough several advantages prevail in the integration of cloud computing with the BI their issues gets into it
automatically such as energy wastage, security and privacy etc. This paper does not give the solution to these issues. The future work can be the solutions to these problems.
5.
REFERENCES
[1] http://en.wikipedia.org/wiki/Data_warehouse.
[2] http://docs.oracle.com/cd/B10501_01/server.920/a96520/ concept.htm .
[3] http://docs.oracle.com/cd/B10501_01/server.920/a96520/ logical.htm#94683.
[4] http://docs.oracle.com/cd/B10501_01/server.920/a96520/ physical.htm#98276 .
[5] http://www.thearling.com/index.htm#wps.
[6] http://www.anderson.ucla.edu/faculty/jason.frand/teacher /technologies/palace/sources.htm.
[7] http://en.wikipedia.org/wiki/Data_mining.
[8] http://en.wikipedia.org/wiki/Business_intelligence.
[9] http://www.axi.ca/tca/jul2003/index.shtml.
[10] http://www.information-management.com/issues /21 _5/cloud-computing---the-catalyst-for-self-service-bi-10021095-1.html?zkPrintable=1&nopagination=1.
[11] http://www.information-management.com/channels/ business-intelligence.html.
[12] http://www.rapid-business-intelligence-success. Com /what-is-business-intelligence.html.
[13] http://www.athena-solutions.com/index.shtml.
[14] http://www.b-eye-network.com/articles/.
[15] http://thebusinessintelligenceguide.com/About_Business _Intelligence.php.
[16] http://www.dbms2.com/2011/11/21/big-vendor-execution -analytics/.
[17] http://wiki.pentaho.com/display/AGILEBI/1.+Introductio n+to+Business+Intelligence.
[18] Amar Khalid , Husnain Mujtaba ,”Data processing in cloud computing”, 2009 second international conference on machine vision.
[19] Michel Goul,”Business intelligence in the cross roads: convergence or confusion ahead?”.
[20] Gartner research,”Key issues for BI and performance management initiatives “, publication date 14th
march 2008.
[21] Chid Apte,T.J.Watson,”Data mining analysis for business intelligence and decision support” Reaserch center,IBM research division.
[22] Lect.Shital P.Bora,”Data mining and dataware housing ”.
[23] I.Hsien Ting ,Chia-Hung Lin, Chen-shu wang,”Constructing a cloud computing based social networks data ware housing and analysis system”,2011 international conference on advances in social networks analysis and mining.