1
Professor, Department of Applied Mechanics, Visvesvarya National Institute of Technology, Nagpur, India 440 011, email: [email protected], [email protected]
ABSTRACT
A raft foundation supports numerous columns distributed evenly through a thick reinforced concrete raft. It is used when heavy loads exist relative to soil capacity. Raft foundations, however, are suited to seismic regions due to their continuity and inherent rigidity. When a structure is subjected to earthquake forces, column loads and base moments get affected causing increase in column load, on one side, and corresponding decrease, on the other. This causes a large eccentricity of loads with respect to the C.G. of the raft. This behavior induces differential settlement causing additional moments in the raft. Hence, it is necessary to investigate the effect of earthquake loading for the design of the raft. In the present study the effect of two dynamic analysis methods namely seismic coefficient and response spectrum are compared for a building.
In case of response spectrum analysis, the signs of the forces are lost due to SRSS combination, however, in analysis of raft, it is necessary to apply the forces with proper sign i.e. up and down. Pressure distribution under the raft for Response spectrum method is rectangular with no signs attached to it unlike other cases. Seismic coefficient method mostly gives results, which are conservative as compared with response spectrum method. Time History Analysis results can be assumed as exact but involves very laborious calculations and are time consuming and are not suitable without powerful analysis software packages, hence its use, for normal structures is not feasible. In this paper, emphasis is given on the pressure distribution under the raft for the first two methods and a modified response spectrum analysis is suggested for the analysis and design for the raft foundation. As the signs of forces in response spectrum method are lost, as an alternative the signs of seismic coefficient method are attached to the response spectrum forces while applying on the raft model and the analysis is performed.
INTRODUCTION
The purpose of a foundation under static conditions is to transfer vertical loads from the superstructure into ground. Under seismic conditions however, the strength demand of the foundation becomes more complicated. The movement of the ground during an earthquake becomes the source of dynamic loading. Suddenly the foundation must transmit seismic inertia forces in the structure caused by the ground motion back into the ground. Thus horizontal base shear, overturning moment, and axial force develop in the structure that must be resisted to effectively avert serious seismic damage.
A raft foundation is a large concrete slab, which transmits the loading from several columns in a building or the entire building loads to the ground. A raft is often used when the soil is of poor quality, or the column loads are so large, that more than 50% of the building-plan area is covered by footings. Rafts are also used beneath silo clusters, nuclear reactors, storage tanks, chimneys and other structures where a single foundation element beneath all parts of the structure is required.
RCC rafts are complex structures having intricate reinforcement details and their interaction with soil, which is generally with varying properties, makes the analysis very difficult. The analysis of RCC plated structures is a complex problem because of heterogeneous nature of concrete, uncertain material laws, variation in reinforcement in different parts etc. apart from these, in rafts the interaction with soil also becomes important.
Also with ease in availability of high power software, it is possible to perform nonlinear analysis of the raft structures for economy and to access proper results for important structures. In such cases, it is necessary to perform analysis with all possible load combination acting on the raft, where forces are combined with proper sign.
For the Seismic analysis of multistoried structure having raft foundation, various methods such as Seismic Coefficient Analysis, Response Spectrum Analysis and Time-History Analysis can be used for evaluation of earthquake forces. All the above stated methods have different approach for seismic analysis to get the structural deformations and member forces. In case of a raft foundation for a structure when analyzed for seismic forces with different methods, forces having different signs are induced depending upon the method of analysis used.
The Figure-1 a shows how the forces are induced in the structure basically foundation if seismic coefficient analysis is performed. The force application in seismic coefficient method for a raft of typical multistoried building structure results in compressive forces (on one side) and tensile forces (on other side) in the columns. These forces in term induce variation of pressure distribution on the raft.
In time history analysis from the time history graphs of the response, force amplitude with sign gives most exact results. But the method is very tedious compared with the other two. Here the comparison of these methods is carried out and emphasis is given to arrive at a more rational dynamics analysis procedure for design of rafts subjected to seismic forces. In the present study, the seismic analysis of plane and space frames is performed using SAP2000, which is a integrated finite element analysis and design program, for various structures including dynamic analysis. The forces in the columns at the foundation level are determined for seismic loads applied using three different approaches viz. seismic coefficient method, response spectra method and time history analysis. The effect of earthquake has been studied with respect to the variation of axial forces and hence, in the pressure distribution diagram for the raft.
PROBLEM CONSIDERED
General
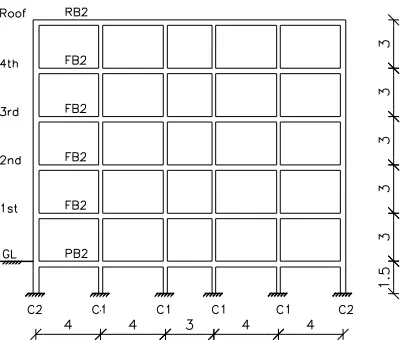
A ground plus four storey RC office building of plan dimensions 19 m x 10 m located in seismic zone III on medium soil is considered. It is assumed that there is no parking floor for this building. Seismic analysis is performed using the codal seismic coefficient method and Response Spectrum method as per in IS:1893-2002.
Plan of the building and sectional elevations of different RC frames are shown in Figures 2a, 2b and 2c. The sizes of the beams and columns are given in Figure 2a.
C1 C1
C1 C1
C1
C1
C1 C1 C1 C1 C2
C2 C2
C2
C3 C3 C3 C3
3 4 4
4 4
5
5
1 2 3 4 5 6
A
B
C
Column Beam
C1
300 x 500RB1, FB1
300 x 600
C2
400 x 400RB2, FB2
300 x 500
C3
400 x 500PB1 300 x 400
PB2 300 x 350
Slab thickness: 125
Figure 2a Plan of building (All dimensions in meters) Figure 1a Vertical force distribution
for Codal Coefficient method
Figure 1b Vertical force distribution Response Spectrum method
X
Y
3
5 FB1 1st
PB1
C2 GL
FB1
FB1 2nd
3rd
5 C2 C1
1
.5
3
3
3
Figure 2b Elevation of frame A, B & C Figure 2c Elevation of transverse frame 1&6
Earthquake Weight (Mass) Calculations
Table-1 gives Weight calculations at each floor level for whole building. Figure 3 shows weights at each floor level.
Table-1 Calculation of Weights at various levels (kN) Level Slab+
Finish
Parapet wall BK Wall LL Beams Columns Total load
Roof 784 267 555 - 220 69 1895
4th 784 - 1110 48 220 138 2300
3rd 784 - 1110 48 220 138 2300
2nd 784 - 1110 48 220 138 2300
1st 784 - 555* 48 220 138 1745
GL - - - -
Total 3920 267 4440 192 1100 621 10540
242 kN
197 kN
118 kN
61 kN
16 kN
Figure 3.a Earthquake Force Distribution
The earthquake forces
distribution, storey wise, is shown in Figure-3a. Figure 3b and Figure 3c shows earthquake force applied on the
b. Earthquake Forces in X direction
c. Earthquake forces in Y direction
Figure 3 Loading diagram for showing codal coefficient earthquake forces
Analyses
Two widely used methods of dynamic analysis of structures viz. seismic coefficient method and Response spectrum method are studied. For both these methods i.e. Seismic coefficient method and Response Spectrum method for earthquake analysis, procedure stated in IS–1893 is followed. The analysis is performed for rigid and flexible ( in bending) rafts.
Rigid Raft
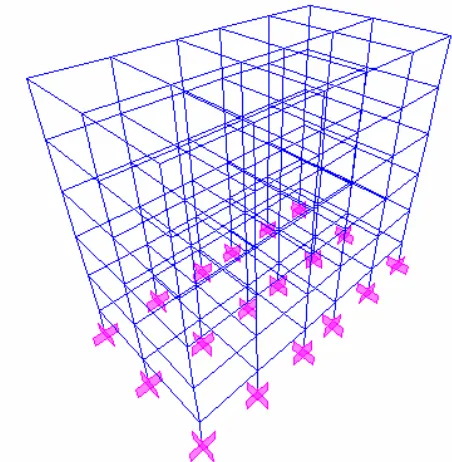
The analysis is performed and the column forces are transferred to the raft for further analysis. The maximum and minimum pressures for one component of earthquake, is tabulated in Table-2 for transverse frame and Table-3 for longitudinal frame. The mathematical model is shown in Figure 4. Figure 5 show the pressure distribution at bottom of raft in transverse direction The pressure is evaluated assuming the raft as rigid.
pressure. ( 120+120 / (4x10) = 6 kN/sqm).
Table 2 – Pressure variation under raft for transverse frame s1
(kN/sqm) s2 (kN/sqm)
Remarks
SCM +19.80 -19.80 Triangular Pressure RSM ±6.00 ±6.00 Uniform rectangular pressure
a. SCM Earthquake Forces b. RSM Earthquake Forces
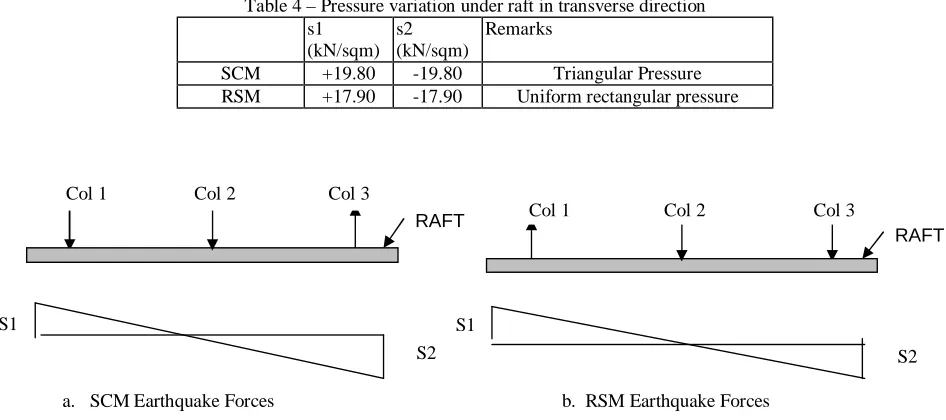
Figure 5 Schematic Pressure Diagram below Raft in transverse direction
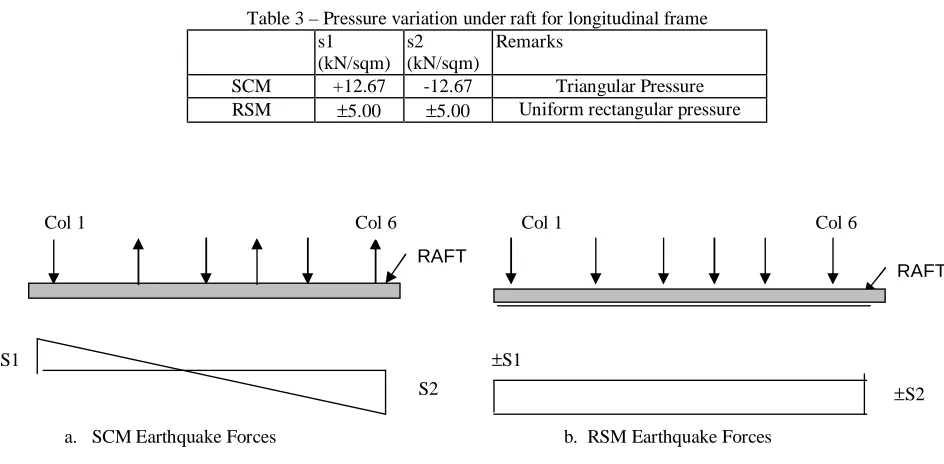
Similar results for the maximum and minimum values of pressure distribution at the corners of raft are obtained for longitudinal direction earthquake and they are presented in Table 3 and Figure 6.
Table 3 – Pressure variation under raft for longitudinal frame s1
(kN/sqm) s2 (kN/sqm)
Remarks
SCM +12.67 -12.67 Triangular Pressure RSM ±5.00 ±5.00 Uniform rectangular pressure
a. SCM Earthquake Forces b. RSM Earthquake Forces
Figure 6 Schematic Pressure Diagram below Raft
Figure 7 shows the graphical presentation of column reactions due to codal co-efficient method and response spectrum method in transverse and longitudinal direction.
S1
Col 1 Col 3
S2
RAFT
Col 2
S1
Col 1 Col 3
S2
RAFT
Col 2
S1
Col 1 Col 6
S2
RAFT
±S1
Col 1 Col 6
±S2
-200 -100 0 100 200
1 2 3
Column location C ol um n R e a c ti on EQY EQYRSM -200 -100 0 100 200
1 2 3 4 5 6
Column Location C ol um n R e a c ti on EQX EQXRSM
a. Transverse Frame b. Longitudinal frame
Figure-7 Plot showing column reactions
It can be seen that the center of gravity of the pressure changes when response spectrum results are used without any sigh. This may lead to change in pressure distribution under the raft when combined with other load cases.
Modified Response Spectrum forces
As the signs of forces in response spectrum method are lost, as an alternative the signs of seismic coefficient method can be attached to the response spectrum results and the analysis can be performed. To study this effect few models are analyzed with the same and the variation in the pressure under raft can be observed from the graphs. The results are shown in Table- 4 and Figure 8.
Table 4 – Pressure variation under raft in transverse direction s1
(kN/sqm) s2 (kN/sqm)
Remarks
SCM +19.80 -19.80 Triangular Pressure RSM +17.90 -17.90 Uniform rectangular pressure
a. SCM Earthquake Forces b. RSM Earthquake Forces
Figure 8 Schematic Pressure Diagram below Raft with modified Response spectrum forces
Similar results for the maximum and minimum values of pressure distribution at the corners of raft are obtained for longitudinal direction earthquake and the results are shown in Table- 5 and Figure 9.
Table 5 – Pressure variation under raft in longitudinal direction s1
(kN/sqm) s2 (kN/sqm)
Remarks
SCM 19.80 19.80 Triangular Pressure RSM ±6.00 ±6.00 Uniform rectangular pressure S1
Col 1 Col 3
S2
RAFT
Col 2
S1
Col 1 Col 3
S2
RAFT
Col 2
a. SCM Earthquake Forces b. RSM Earthquake Forces
Figure 9 Schematic Pressure Diagram below Raft with modified Response spectrum forces
Flexible Raft
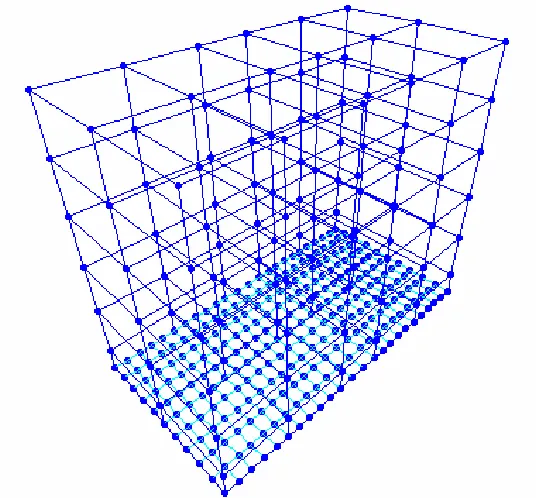
The raft is modeled as plate elements supported by springs as per Winkler Hypothesis[2]. The raft foundation considered here is main beams between the column as raft slab spanning between these beams. Modulus of subgrade reaction assumed as 10,000 kN/cum for the soft soils. The modulus of subgrade is assumed in such a way that the dynamic properties (i.e. frequency of predominant mode) is same with as compared with the fixed base mathematical model. The mathematical model is shown in figure 10. The pressure diagram below raft along the transverse frame and longitudinal frame is shown in Figure 11 and 12.
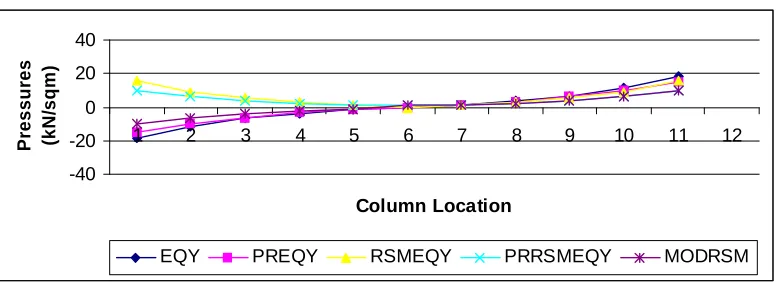
The analysis is performed with the seismic forces obtained using codal co-efficient method (EQX, EQY), Response spectrum method (RSMEQX, RSMEQY) in transverse and longitudinal direction. The pressure diagram obtained with these four cases is compared with statically applying column reactions on the raft at the location of the columns. These cases are presented as PREQX, PRRSMEQX, PREQY and PRRSMEQY for codal co-efficient forces and Response spectrum forces in transverse and longitudinal direction.
Figure 10 Mathematical model with raft modeled S1
S2
RAFT
S1
S2
-40 -20 0 20 40
1 2 3 4 5 6
Column Location
P
re
s
s
u
re
s
(k
N
/s
q
m
)
EQX PREQX RSMEQX PRRSMEQX MODRSM
Figure 11 Pressure distributions along transverse direction
-40 -20 0 20 40
1 2 3 4 5 6 7 8 9 10 11 12
Column Location
P
re
s
s
u
re
s
(k
N
/s
q
m
)
EQY PREQY RSMEQY PRRSMEQY MODRSM
Figure 12 Pressure distribution along longitudinal direction
It can be seen that if the response spectrum forces are used with the sign attached with the codal co-efficient results, the pressure diagram represents proper distribution as expected with lateral forces.
CONCLUSIONS
It is important to note that the Response Spectrum results are always positive, and that the correspondence between different values has been lost. It can be seen that the center of gravity of the pressure changes when response spectrum results are used without any sigh. This may lead to change in pressure distribution under the raft when combined with other load cases. This problem can be overcome by attaching the sign of the codal co-efficient results to response spectrum forces. This also may help in performing nonlinear analysis in combination with gravity forces.
REFERENCES
1. IS 1893 (2002). Criteria for Earthquake Resistant Design of Structures, Part I, Bureau of Indian Standards, New Delhi.
2. Bowles J. E. (1997). Foundation analysis and design,. McGraw-Hill International Companies. Inc.