Validity of the Strengths and Dif
fi
culties
Questionnaire in Preschool-Aged
Children
Simone Croft, MSca, Christopher Stride, PhDb, Barbara Maughan, PhDc, Richard Rowe, PhDa
abstract
BACKGROUND:The Strengths and Difficulties Questionnaire (SDQ) is widely used to screen forchild mental health problems and measure common forms of psychopathology in 4- to 16-year-olds. Using longitudinal data, we examined the validity of a version adapted for 3- to 4-year-olds.
METHODS:We used SDQ data from 16 659 families collected by the Millennium Cohort Study, which charts the development of children born throughout the United Kingdom during 2000–2001. Parents completed the preschool SDQ when children were aged 3 and the standard SDQ at ages 5 and 7. The SDQ’s internal factor structure was assessed by using confirmatory factor analysis, with a series of competing models and extensions used to determine construct, convergent, and discriminant validity and measurement invariance over time. Predictive validity was evaluated by examining the relationships of age 3 SDQ scores with age 5 diagnostic measures of attention-deficit/hyperactivity disorder, autism spectrum disorder/Asperger syndrome, and teacher-reported measures of personal, social, and emotional development.
RESULTS:Confirmatory factor analysis supported a 5-factor measurement model. Internal reliability of subscales ranged fromv= 0.66 (peer problems) tov= 0.83 (hyperactivity). Item-factor structures revealed measurement invariance over time. Strong positive correlations between ages 3 and 5 SDQ scores were not significantly different from correlations between age 5 and 7 scores. Conduct problems and hyperactivity subscales independently predicted developmental and clinical outcomes 2 years later.
CONCLUSIONS:Satisfactory psychometric properties of the adapted preschool version affirm its utility as a screening tool to identify 3- to 4-year-olds with emotional and behavioral difficulties.
WHAT’S KNOWN ON THIS SUBJECT:Although the psychometric properties of the school-age
Strengths and Difficulties Questionnaire (SDQ)
have been extensively examined by using longitudinal data, the preschool version of the SDQ has only been explored in a limited number of cross-sectional studies.
WHAT THIS STUDY ADDS:This is thefirst psychometric study of the preschool SDQ using longitudinal data. We report measurement invariance over time, satisfactory reliability, construct and criterion validity, and predictive utility for subsequent behavioral problems (4 years) and clinical disorders (2 years).
aPsychology Department,bInstitute of Work Psychology, University of Sheffield, Sheffield, United Kingdom; and cSocial Genetic & Developmental Psychiatry Research Centre, Institute of Psychiatry, Psychology and
Neuroscience, King’s College London, London, United Kingdom
Ms Croft contributed to the choice of analysis, carried out the analyses, and drafted the manuscript; Dr Stride conceptualized and designed the analyses and reviewed and revised the manuscript; Dr Maughan conceptualized the study and critically reviewed the manuscript; Dr Rowe coordinated the research team, contributed to the choice of analysis, and reviewed and revised the manuscript; and all authors approved thefinal manuscript as submitted.
www.pediatrics.org/cgi/doi/10.1542/peds.2014-2920
DOI:10.1542/peds.2014-2920 Accepted for publication Feb 18, 2015
Address correspondence to Simone Croft, MSc, Department of Psychology, University of Sheffield, Western Bank, Sheffield S10 2TP, UK. E-mail: s.e.croft@sheffield.ac.uk
PEDIATRICS (ISSN Numbers: Print, 0031-4005; Online, 1098-4275).
The Strengths and Difficulties Questionnaire (SDQ)1is widely used
in research, clinical, and community settings to screen for externalizing and internalizing problems.2–4Five
subtypes of children’s behavior (conduct problems, hyperactivity, emotional problems, peer problems, and prosocial behaviors) are each assessed with 5 questions. Three versions are available for school-aged children: parent- and teacher-reported versions (4–16 years) and a self-report version (11–17 years).
Several studies have addressed the validity of the parent-reported SDQ in school-aged samples, predominantly confirming the intended 5-factor structure.5,6A 3-factor configuration
of externalizing (conduct problems and hyperactivity), internalizing (emotional and peer problems), and prosocial factors has also been proposed and suggested for use in epidemiologic studies and in low-risk populations.7,8The internal reliability
of SDQ subscales has been predominantly examined by using Cronbach’sa, a measure of the interrelatedness of items; however, aestimates are a lower bound for reliability and is often
underestimated.9A meta-analytic
review reported weighted mean acoefficients extracted from 26 studies that showed generally modest reliabilities for parent reports (0.53 ,a,0.76).10McDonald’sv, which
estimates the proportion of a scale measuring a construct, typically yields higher reliability estimates but has rarely been used to assess reliability of the SDQ. A comparative study reported highervcoefficients (0.74,v,0.91) thanacoefficients (0.54,a,0.82) for the school-age SDQ.9
Previous research offers strong evidence of the school-age SDQ’s relatedness to separate constructs (convergent validity). Weighted-average correlation coefficients between equivalent pairs of SDQ and Child Behavior Checklist subscales11
from 9 parent-reported studies were uniformly strong and positive (range: 0.52,r,0.71).10Several studies
showed strong correlations between SDQ subscales and“real world” outcomes such as clinical diagnoses (criterion validity); SDQ scores identified school-aged children with concurrent behavioral and emotional disorders, including attention-deficit/ hyperactivity disorder (ADHD) and autism spectrum disorder/Asperger syndrome (ASD/AS), and predicted their occurrence 3 years later.4,12,13
However, multitrait-multimethod analyses have not provided consistently strong evidence of discriminant validity of the school-age SDQ subscales. For example cross-informant, within-subscale correlations have sometimes been no stronger than cross-subscale
correlations,4suggesting that the
intended behaviors are measured with some overlap between constructs.4,14
A slightly modified version of the SDQ has been developed for preschool-aged (3–4 years old) populations (http://www.sdqinfo.org). Preschool is a valuable time to identify and treat childhood psychopathology, and parent report is likely to provide a particularly informative perspective.
Assessing the psychometric properties of the parent-reported preschool SDQ is imperative before widespread adoption can be recommended. However, only 4 studies15–18have done so, and none
performed a single comprehensive assessment of convergent,
discriminant, and criterion validity, measurement invariance across time, and internal reliability.
The previous studies were based in The Netherlands,15Spain,16
Germany,17and Japan.18Each
supported a 5-factor
configuration.15–18Table 1 presents
preschool internal reliabilities compared with the school-age SDQ.10
Only 1 preschool validation study TABLE
used McDonald’svcoefficient to estimate internal reliability. Significant correlations between equivalent pairs of SDQ and Child Behavior Checklist11 internalizing
and externalizing subscales indicated external convergent validity. SDQ total difficulties scores (summed hyperactivity, conduct, emotional, and peer problem scores) were significantly associated with “treatment status”and“presence of any disorder”criteria, supporting concurrent criterion validity of the measure.15,16However, each
preschool SDQ study was limited to a cross-sectional design, prohibiting examination of factor structure stability over time and validity in predicting future psychopathology.
This study is thefirst, to our knowledge, to assess the psychometric properties of the preschool SDQ by using longitudinal data. We used parent-reported preschool SDQ scores at age 3 in conjunction with school-age SDQ responses collected at ages 5 and 7 to determine the optimal factor
structure and the extent of
measurement invariance across time. We examined internal reliability with aand vcoefficients and convergent and discriminant validity by using average variance explained (AVE) scores. Finally, we used criterion outcome measures at age 5, which included parent-reported diagnoses of ADHD and ASD/AS and teacher-reported measures of personal, social, and emotional (PSE) development to assess the utility of the preschool SDQ to predict clinical outcomes 2 years later.
METHODS Participants
The Millennium Cohort Study (MCS) is a UK longitudinal study of children born between September 2000 and August 2001.19This article uses
3 waves of data collected when children were3, 5, and 7 years old.
At age 3, 19 942 families were sampled; 15 590 responded to at least 1 part of the MCS (response rate: 78%) and 14 444 completed the SDQ (mean child age at data collection = 3.15 years; age range = 2.65–4.57 years). At age 5, 19 184 families were sampled; 15 246 responded (79%) and 14 615 had SDQ data (mean child age = 5.22 years; range = 4.40–6.13 years). At age 7, 17 031 families were sampled; 13 857 responded (81%) and 13 358 had SDQ data (mean child age = 7.24 years; range = 6.34–8.15 years). Only 1 child from each of 246 families containing multiple births was included. Observations collected when children were.1 year older or younger than the intended study age were excluded. Ourfinal analysis sample consisted of 42 417 observations from 16 659 distinct children (48% boys) for whom we had SDQ scores on at least 1 occasion. MCS sampling was stratified to oversample children living in socioeconomic deprivation and poverty and in ethnically diverse areas. Sampling weights were provided to adjust for oversampling relative to UK demographic
characteristics, attrition, and nonresponse.19
The National Health Service Research Ethics Committee provided ethical approval to the MCS. Informed consent procedures included obtaining written parental consent.
SDQ Measures
The parent-report SDQ1contains
25 items forming 4 difficulties subscales–conduct problems, hyperactivity, emotional problems, peer problems and a prosocial subscale. The preschool version (administered at age 3) and standard version (ages 5 and 7) were used. In the preschool version (www.sdqinfo. org), 3 items are adjusted to reflect age-appropriate behaviors and contexts. Specifically,“argumentative with adults”and“can be spiteful” replace“often lies or cheats”and
“steals from home, school or elsewhere”(conduct problems subscale), and“can stop and think before acting”replaces“thinks things out before acting”(hyperactivity subscale). Parents rated statements as either 0 (not true), 1 (somewhat true), or 2 (certainly true).
Criterion Measures
When the children were age 5, the parents were asked whether a health professional had ever diagnosed the child with ADHD and ASD/AS. Medical records were not consulted. Prevalence rates were 0.9% for ADHD and 0.9% for ASD/AS (0.2% for comorbid disorders).
PSE development (a subscale of the Foundation Stage Profile) was rated by teachers for children aged 4 to 5 years (www.education.gov.uk/ eyfs). The scale contains 27 dichotomous items that measure dispositions and attitudes, eg,“maintains attention and concentrates”; social development, eg,“plays alongside others”; and emotional development, eg,“separates from main carer with support.”The internal reliability of this scale in the MCS wasa= 0.91.
Analysis
Analysis of the preschool SDQ comprised 5 stages, in turn assessing internal factor structure, internal reliability, measurement stability over time (measurement invariance), construct validity, and predictive criterion validity.
First, the preschool and school-age SDQ’s factor structure was examined by using confirmatory factor analysis. The established 5-factor model was compared against a 3-factor model (externalizing: conduct problems and hyperactivity; internalizing: emotional and peer problems; and prosocial factors)7
only the item-factor arrangement fixed to be equal (configural invariance). Second, 2 internal reliability measures, Cronbach’sa (interrelatedness of subscale items) and McDonald’sv(proportion of subscale measuring construct), were calculated for each subscale within a structural equation model framework that accounts for the ordinal nature of item response distributions. Equality of coefficients across time was assessed by using bootstrapped confidence intervals (1000 replications).20,21
Third, we examined factorial invariance, ie, stability of the 5-factor measurement model across time. The configural invariance model from the first stage of analyses provided a baseline. Factor loadings (metric invariance), then thresholds (scalar invariance), andfinally factor loadings and thresholds (strong invariance) were sequentiallyfixed equal across time.* Increasing degrees of factorial invariance were demonstrated if modelfit was not diminished by additional constraints. Initially, the invariance of each subscale was tested independently of other subscales. All subscales were then tested in the same model, implementing constraints to establish the best-fitting measurement model.
Fourth, construct validity was evaluated by using the average variance explained in subscales items by their associated factor (AVE score). Factors with AVE scores.0.50 demonstrate satisfactory internal convergent validity. Factors with AVE scores exceeding their highest squared correlation with another factor achieve adequate external discriminant validity.22The
effectiveness of the adapted
preschool items (see Measures) was examined by usingR2values, ie, amount of variance in each item
explained by its associated factor. A confirmatory factor analysis model in which factor loadings of the 3 items were free to vary across time was compared with one in which they were constrained.
Finally, predictive validity was examined. We tested predictive criterion validity using age 5 outcomes of ADHD and ASD/AS (binary measures) by using probit regression and PSE (continuous) by using linear regression. Probit regression
coefficients range from21 to 1: 1-point increases in predictors equate to increases in the outcomezscore (SDs above the mean) at the magnitude of the regression coefficient. Predictive validity of the preschool SDQ was also assessed through correlations with school-age SDQ scores.
Mplus v7.11 was used for all
analyses.23SDQ items were treated as
ordinal, with weighted least-squares means and variance–adjusted estimation used.23Given the
x2statistic’s propensity to reject good
models when samples are large and/ or complex, the comparativefit index (CFI) and root mean square error of approximation (RMSEA) were used to assess modelfit. Modelfit was considered adequate where CFI values exceeded 0.95 and RMSEA values fell below 0.06.24For testing
competing models in very large samples, we followed Cheung and Rensvold’s (2002) suggestion that parsimonious models are superior when increases in the CFI offered by more complex model are#0.01.25 Acknowledging the high power achieved with our large sample, the statistical significance level for testing parameters was set atP,.0005. Effect sizes and 99.95% confidence intervals were reported
appropriately.
RESULTS
The 5-factor model (x2= 28 332, degrees of freedom [df] = 2520,P,
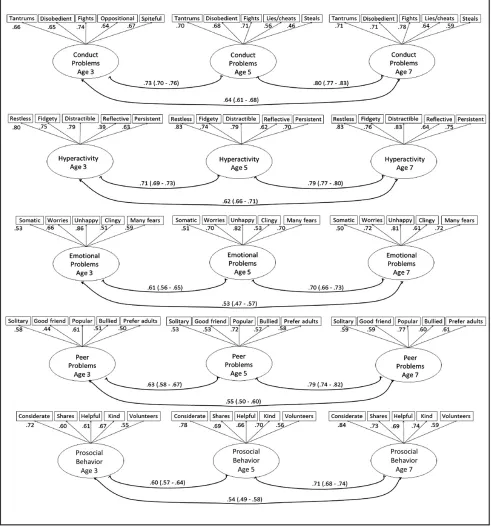
.0005, RMSEA = 0.025, CFI = 0.905) fitted the data better than 3-factor (x2= 36 769, df = 2589,P,.0005, RMSEA = 0.028, CFI = 0.874) and 1-factor (x2= 62 172, df = 2622,P, .0005, RMSEA = 0.037, CFI = 0.780) models, so was used in subsequent analyses. Standardized factor loadings for the 5-factor
configuration (Fig 1) ranged from 0.46,b,0.74 (conduct problems), 0.39,b,0.80 (hyperactivity), 0.51,b,0.86 (emotional problems), 0.44,b,0.61 (peer problems), and 0.55,b,0.72 (prosocial). Several items had factor loadings,0.6 (Table 2). However, the underlying factor explained .20% of item variance for all but 2 of the 25 preschool items.
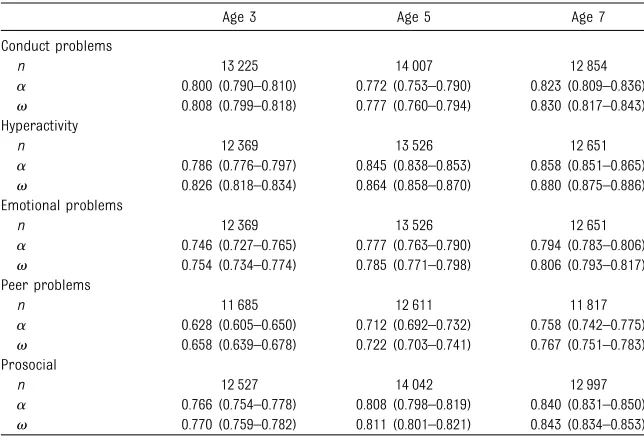
Reliability analyses yielded comparableaandvestimates. Internal reliability of the standard SDQ was acceptable at ages 5 (a: 0.71 ,a,0.85;v: 0.72,v,0.86) and 7 (0.76,a,0.86; 0.77,v, 0.88). By using the preschool version at age 3, only the peer problems subscale failed to achieve the 0.70 benchmark for satisfactory internal reliability (0.63,a,0.80; 0.66,v ,0.83). Examination of 99.95% confidence intervals indicates that, although mostly adequate at age 3, internal reliability was significantly higher at ages 5 and 7 (Table 3).
Factorial invariance analyses tested whether item-factor loadings and threshold values differed
significantly across time. For each subscale, when factor loadings were constrained to be equal across time, fit indices were not reduced
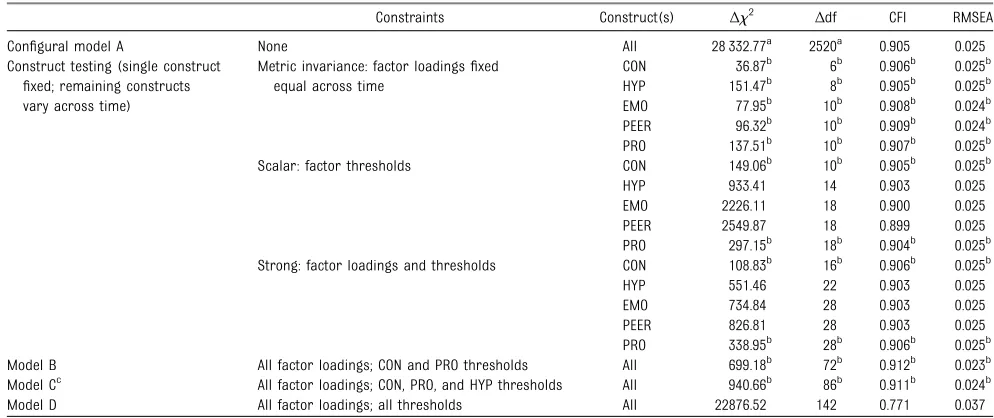
compared with the configural model (model A, Table 4), demonstrating metric invariance. Furthermore, constraining item-factor thresholds equally across time did not reducefit indices for the conduct problems and prosocial subscales, demonstrating scalar invariance. Three additional models were tested to establish the best-fitting model (Table 4). In model B, all factor loadings and
conduct problems and prosocial thresholds were constrained. Model C additionally constrained
hyperactivity thresholds, which showed an insubstantial loss offit from the configural model (DCFI =
0.002) when tested for scalar invariance (constraining thresholds only). In model D, all factor loadings and thresholds werefixed equal across time. Fit indices for model D were poor but were acceptable for
models B and C. Model C was preferred, due to its parsimony. Model C demonstrated strong (ie, factor loadings and thresholds) invariance for conduct problems, hyperactivity, and prosocial FIGURE 1
subscales and metric (ie, factor loadings) invariance for emotional and peer problems.
We assessed convergent and discriminant validity using AVE scores. Although itemR2values (ie, proportion of item variance explained by the underlying factor) increased slightly with age, factor loadings were not significantly different across ages in the unconstrained model A (Table 5). AVE scores for the preferred model C ranged from 0.34 (peer problems) to 0.60 (hyperactivity), with only hyperactivity achieving the 0.50 benchmark for satisfactory internal convergent validity.22However,
every subscale demonstrated adequate external discriminant validity, with AVE scores exceeding squared interfactor correlations. Likewise, correlations between SDQ factors at age 3 ranged from 0.15,r ,0.68, fulfilling Kline’s (2005)“r, 0.85”benchmark for distinct factors Kline, RB. (2005). Principles and practice of structural equation modeling (2nd ed.). New York: Guilford.
Three adapted items distinguish the preschool and school-age SDQs (see Methods). We found significantly higherR2values for preschool conduct problem items (compared with standard SDQ age 5 equivalent)
and, conversely, lowerR2values for the standard age 5 hyperactivity item (compared with the adapted
preschool equivalent) (Table 6).
The predictive validity of SDQ subscales was supported by strong positive correlations between age 3, 5, and 7 SDQ factors (Fig 1, Table 7). No significant differences between correlations were found. By using probit and linear regression
analyses, only the preschool conduct problems and hyperactivity
subscales independently predicted age 5 outcomes (Table 8).
Hyperactivity positively predicted ADHD (b= 0.41) and ASD/AS (b= 0.58) and negatively predicted PSE development (b=20.16), whereas conduct problems positively predicted ADHD (b= 0.40). In a simple model without covariates, conduct problems also predicted ASD/AS, but this relationship became negative (b=20.55) when covariates were added
(Supplemental Table 9).
DISCUSSION
This is thefirst longitudinal examination of the psychometric properties of the parent-reported preschool SDQ from preschool to school-age developmental stages. The 5-factor model established for the school-age SDQ provided an adequatefit to preschool SDQ data. Subscales exhibited good internal reliability and adequate discriminant validity, albeit alongside weaker internal convergent validity. All subscales demonstrated metric factorial invariance over time, with conduct problems, hyperactivity, and prosocial subscales presenting strong factorial invariance over time. Conduct problems and hyperactivity subscales also predicted clinical disorders 2 years later.
Ourfindings diverge from previous research in 2 areas. First, we reported poor modelfit for the alternative 3-factor configuration;
TABLE 2 Items at Each Time Point With Standardized Factor Loadings,0.6 Taken From the Configural Model A (No Across-Time Constraints)
Subscale Item Age 3 Age 5 Age 7
FL R2 FL R2 FL R2
Conduct Lies/cheats Ad Ad 0.56 31 NA NA
Steals Ad Ad 0.46 21 0.59 35
Hyperactivity Reflective 0.39 15 Ad Ad Ad Ad
Emotional Somatic 0.53 28 0.51 26 0.50 25
Clingy 0.51 26 0.53 28 NA NA
Peer Solitary 0.58 34 0.53 28 0.59 35
Good friend 0.43 18 0.53 28 0.59 35
Prosocial Volunteers 0.55 30 0.56 31 0.59 35
N= 16 659. Ad, item different in preschool and school-age; FL, factor loading; NA, standardized factor loadings not below
0.60;R2, percentage of variance in items explained by behavioral construct.
TABLE 3 Internal Reliability: Cronbach’saand McDonald’svCoefficients (99.95% Confidence Intervals) at Age 3, 5, and 7 Time Points
Age 3 Age 5 Age 7
Conduct problems
n 13 225 14 007 12 854
a 0.800 (0.790–0.810) 0.772 (0.753–0.790) 0.823 (0.809–0.836) v 0.808 (0.799–0.818) 0.777 (0.760–0.794) 0.830 (0.817–0.843) Hyperactivity
n 12 369 13 526 12 651
a 0.786 (0.776–0.797) 0.845 (0.838–0.853) 0.858 (0.851–0.865) v 0.826 (0.818–0.834) 0.864 (0.858–0.870) 0.880 (0.875–0.886) Emotional problems
n 12 369 13 526 12 651
a 0.746 (0.727–0.765) 0.777 (0.763–0.790) 0.794 (0.783–0.806) v 0.754 (0.734–0.774) 0.785 (0.771–0.798) 0.806 (0.793–0.817) Peer problems
n 11 685 12 611 11 817
a 0.628 (0.605–0.650) 0.712 (0.692–0.732) 0.758 (0.742–0.775) v 0.658 (0.639–0.678) 0.722 (0.703–0.741) 0.767 (0.751–0.783) Prosocial
n 12 527 14 042 12 997
alternative validation studies observed adequatefit for both configurations using school-aged4
and preschool-aged16 populations.
Second, we reported higher Cronbach’sareliability scores than most preschool and school-aged validation studies,10,15with only the
preschool peer problems subscale failing to meet thea.0.70 criteria for satisfactory internal reliability. Because of skewness and the ordered categorical nature of our variables, we estimatedawithin a structural equation model
framework, which resulted in higher acoefficients.20Ourv reliability
analyses yielded results consistent with previous studies reportingv reliabilities for preschool and school-age SDQs.9,16
This was thefirst examination of discriminant validity using the preschool SDQ. Satisfactory discriminant validity was observed for all preschool subscales. However, weak internal convergent validity suggested that some items are not strongly related to their associated factors. Item variance explained by respective factors increased with age, consistent with previous research that observed parent-reported SDQ factors typically accounted for 50% of item variance for 10 to 12 year olds and,50% for 5 to 7 year olds.27The 2
preschool-specific conduct problem items had adequate communalities compared with the age 5 equivalent;
TABLE 4 CFA for Factorial Invariance Testing
Constraints Construct(s) Δx2 Δdf CFI RMSEA
Configural model A None All 28 332.77a 2520a 0.905 0.025
Construct testing (single construct
fixed; remaining constructs vary across time)
Metric invariance: factor loadingsfixed equal across time
CON 36.87b 6b 0.906b 0.025b
HYP 151.47b 8b 0.905b 0.025b EMO 77.95b 10b 0.908b 0.024b PEER 96.32b 10b 0.909b 0.024b PRO 137.51b 10b 0.907b 0.025b
Scalar: factor thresholds CON 149.06b 10b 0.905b 0.025b
HYP 933.41 14 0.903 0.025
EMO 2226.11 18 0.900 0.025
PEER 2549.87 18 0.899 0.025
PRO 297.15b 18b 0.904b 0.025b
Strong: factor loadings and thresholds CON 108.83b 16b 0.906b 0.025b
HYP 551.46 22 0.903 0.025
EMO 734.84 28 0.903 0.025
PEER 826.81 28 0.903 0.025
PRO 338.95b 28b 0.906b 0.025b Model B All factor loadings; CON and PRO thresholds All 699.18b 72b 0.912b 0.023b Model Cc All factor loadings; CON, PRO, and HYP thresholds All 940.66b 86b 0.911b 0.024b
Model D All factor loadings; all thresholds All 22876.52 142 0.771 0.037
x2 Estimates were obtained by using DIFFTEST (Mplus, Muthén & Muthén, Los Angeles, CA).N= 16 659. CFA, confirmatory factor analysis; CON, conduct problems; EMO, emotional
problems; HYP, hyperactivity; PEER, peer problems; PRO, prosocial.
aConfigural (baseline) model.
bAcceptable change infit indices (compared with configural model).
cIndicates preferred model (model C).
TABLE 5 ItemR2Values for Configural Model A and AVE Scores for Preferred Model C
Factor Item Configural (Model A),R2
Age 3 Age 5 Age 7 Preferred (Model C),R2
Conduct Tantrums 0.44 0.49 0.50 0.47
Disobedient 0.43 0.47 0.51 0.46
Fights 0.54 0.50 0.61 0.54
AVE 0.47 0.49 0.54 0.49
Hyperactivity Restless 0.64 0.69 0.70 0.68
Fidgety 0.56 0.55 0.58 0.56
Distractible 0.62 0.62 0.68 0.64
Persistent 0.40 0.50 0.56 0.50
AVE 0.56 0.59 0.63 0.60
Emotional Somatic 0.28 0.26 0.25 0.26
Worries 0.43 0.48 0.52 0.49
Unhappy 0.74 0.68 0.67 0.69
Clingy 0.26 0.28 0.37 0.31
Many fears 0.35 0.49 0.52 0.46
AVE 0.41 0.44 0.46 0.44
Peer Solitary 0.33 0.28 0.35 0.31
Good friend 0.19 0.29 0.35 0.27
Popular 0.37 0.52 0.60 0.50
Bullied 0.27 0.33 0.36 0.32
Prefer adults 0.25 0.33 0.37 0.32
AVE 0.28 0.35 0.41 0.34
Prosocial Considerate 0.51 0.60 0.70 0.60
Shares 0.36 0.48 0.53 0.46
Helpful 0.37 0.43 0.48 0.42
Kind 0.45 0.50 0.54 0.49
Volunteers 0.30 0.31 0.34 0.31
AVE 0.40 0.46 0.52 0.46
conversely, the preschool“reflective” item was a poor indicator, with the hyperactivity subscale explaining only 15% of item variance.
Substantial positive correlations between corresponding factors measured at ages 3, 5, and 7 years support the predictive validity of SDQ subscales across 2- and 4-year periods. Moreover, correlations between preschool and age 5 scores were comparable to those between age 5 and 7 scores, supporting the predictive validity of the preschool SDQ as similar to the school-age SDQ administered at age 5.
Preschool conduct problems and hyperactivity subscales demonstrated predictive criterion validity over 2 years. Hyperactivity positively predicted ADHD, ASD/AS, and PSE
development. Conduct problems positively predicted ADHD. We also report a weak positive simple relationship between conduct problems and ASD/AS, which became negative when other SDQ subscales were covaried (Supplemental Table 9). A similar negative relationship between conduct problems and ASD/ AS while controlling for other SDQ subscales was reported with older children.4This negative relationship
may reflect overlap with other SDQ subscales, particularly hyperactivity, a robust independent predictor of later ASD/AS.
Limitations
We found substantial continuities in peer and emotional problems, as measured by the SDQ, from preschool-to school-aged children; however,
these subscales did not independently predict external measures of
psychopathology. Rather than suggesting that these scales lack clinical value, thisfinding is likely to reflect the range of outcomes available in the MCS data set. Specifically, it is plausible that these subscales would independently predict future internalizing problems such as depressed mood and anxiety. Multiple informants of child behaviors would enhance the validity offindings, with teacher report likely to be most valuable at this age, although difficult to collect in UK samples because preschool education is not compulsory. The SDQ impact supplement, which investigates chronicity, distress, social impairment, and burden, was excluded from analyses; although this supplement provides clinically useful information,5
the brevity and accessibility of the 25-item questionnaire increase its suitability for widespread use. Future research focused on application in clinical settings might usefully address the impact supplement and evaluate clinical cutoffs for psychiatric caseness.
Implications
The current study validates the SDQ as a brief measure of emotional and behavioral problems in preschool children, with psychometric
properties largely comparable to the extensively used school-age SDQ. The currentfindings encourage its application within research contexts and as a screening tool in clinical and community settings. Screening raises several issues beyond the
TABLE 6 R2Values for Adapted Preschool SDQ Items (and Equivalent Age 5 and 7 Items) and CFA Comparison With Configural Model A
Factor Items (age) ItemR2 Model Δx2 Δdf CFI RMSEA
Age 3 Age 5 Age 7 Configural Model A 28 332.77 2520 0.905 0.025
CON Argumentative (3 years); lies/cheats (5, 7 years)
0.41 0.32 0.41 CON factor loadingsfixed equal across time
91.957 4 0.906 0.025
Spiteful (3 years); steals (5, 7 years) 0.45 0.21 0.35 HYP Can be reflective (3 years); is reflective
(5, 7 years)
0.15 0.38 0.41 HYP factor loadingsfixed equal across time
197.896 2 0.903 0.025
N= 16 659. CFA, confirmatory factory analysis; CON, conduct problems; HYP, hyperactivity.
TABLE 7 Standardized Across-Time Factor Correlations
Conduct Hyperactivity Emotional Peer Prosocial
Conduct a 0.63 0.41 0.48 20.49
Hyperactivity 0.58 a 0.31 0.45 20.40
Emotional 0.40 0.28 a 0.54 20.20
Peer 0.42 0.37 0.50 a 20.40
Prosocial 20.40 20.30 20.12 20.27 a
N= 16 659. Age 3 with age 5 (below diagonal), age 5 with age 7 (above), all significant atP,.0005.
aSee Fig 1 for cross-time correlations between measurements of the same subscale.
TABLE 8 Standardized Probit (for ADHD, ASD/AS Outcomes) and Linear (for PSE Outcome) Regression Coefficient Estimates and SEs at Age 5
Factor (at age 3) Outcome, Age 5 Years
ADHD ASD/AS PSE
b SE b SE b SE
Conduct problems 0.40* 0.12 20.55* 0.16 20.08 0.07
Hyperactivity 0.41* 0.09 0.58* 0.09 20.16* 0.04
Emotional problems 20.31 0.13 20.13 0.15 0.03 0.09
Peer problems 0.25 0.13 0.40 0.16 20.15 0.10
Prosocial 0.16 0.11 20.40 0.12 20.03 0.08
psychometric properties of the instrument, which have been discussed elsewhere.28
CONCLUSIONS
The school-age SDQ has been extensively validated for its
intended use as a screening tool to detect 4- to 16-year-olds at risk of clinical or developmental
disorders.1,10,29The current study
confirms satisfactory psychometric properties for the adapted preschool version, affirming its utility as a brief measure to identify 3- to
4-year-olds with emotional and behavioral difficulties.
ACKNOWLEDGMENTS
We thank Professor Robert Goodman for reviewing previous drafts of the manuscript.
FINANCIAL DISCLOSURE:The authors have indicated they have nofinancial relationships relevant to this article to disclose.
FUNDING:This work was supported by an Economic and Social Research Council PhD studentship (ES/J500215/1), awarded to Ms Croft and supervised by Drs Rowe and Stride.
POTENTIAL CONFLICT OF INTEREST:The authors have indicated they have no potential conflicts of interest to disclose.
REFERENCES
1. Goodman R. The strengths and difficulties questionnaire: a research note.J Child Psychol Psychiatry. 1997;38(5):581–586
2. Goodman R, Ford T, Simmons H, Gatward R, Meltzer H. Using the Strengths and Difficulties Questionnaire (SDQ) to screen for child psychiatric disorders in a community sample.Br J Psychiatry. 2000;6:534–539
3. Goodman R. Psychometric properties of the strengths and difficulties
questionnaire.J Am Acad Child Adolesc Psychiatry. 2001;40(11):1337–1345
4. Goodman A, Lamping DL, Ploubidis GB. When to use broader internalising and externalising subscales instead of the hypothesisedfive subscales on the Strengths and Difficulties Questionnaire (SDQ): data from British parents, teachers and children.J Abnorm Child Psychol. 2010;38(8):1179–1191
5. Goodman R. The extended version of the Strengths and Difficulties Questionnaire as a guide to child psychiatric caseness and consequent burden.J Child Psychol Psychiatry. 1999;40(5):791–799
6. Smedje H, Broman JE, Hetta J, von Knorring AL. Psychometric properties of a Swedish version of the“Strengths and Difficulties Questionnaire”.Eur Child Adolesc Psychiatry. 1999;8(2):63–70
7. Dickey WC, Blumberg SJ. Revisiting the factor structure of the strengths and difficulties questionnaire: United States, 2001.J Am Acad Child Adolesc Psychiatry. 2004;43(9):1159–1167
8. Di Riso D, Salcuni S, Chessa D, Raudino A, Lis A, Altoe G. The Strengths and
Difficulties Questionnaire (SDQ): early evidence of its reliability and validity in a community sample of Italian children. Pers Individ Dif. 2010;49(6):570–575
9. Stone LL, Otten R, Ringlever L, et al. The parent version of the Strengths and Difficulties Questionnaire omega as an alternative to alpha and a test for measurement invariance.Eur J Psychol Assess. 2013;29(1):44–50
10. Stone LL, Otten R, Engels RCME, Vermulst AA, Janssens JMAM. Psychometric properties of the parent and teacher versions of the strengths and difficulties questionnaire for 4- to 12-year-olds: a review.Clin Child Fam Psychol Rev. 2010;13(3):254–274
11. Achenbach TM.Manual for the Child Behavior Checklist/4–18 and 1991 profile. Burlington, VT: Department of Psychiatry, University of Vermont; 1991
12. Goodman R, Renfrew D, Mullick M. Predicting type of psychiatric disorder from Strengths and Difficulties Questionnaire (SDQ) scores in child mental health clinics in London and Dhaka.Eur Child Adolesc Psychiatry. 2000;9(2):129–134
13. Russell G, Rodgers LR, Ford T. The Strengths and Difficulties Questionnaire as a predictor of parent-reported diagnosis of autism spectrum disorder and attention deficit hyperactivity disorder.PLoS ONE. 2013;8(12):e80247
14. Hill CR, Hughes JN. An examination of the convergent and discriminant validity of the Strengths and Difficulties
Questionnaire.Sch Psychol Q. 2007;22(3): 380–406
15. Theunissen MHC, Vogels AGC, de Wolff MS, Reijneveld SA. Characteristics of the Strengths and Difficulties Questionnaire in preschool children.Pediatrics. 2013; 131(2). Available at: www.pediatrics.org/ cgi/content/full/131/2/e446
16. Ezpeleta L, Granero R, de la Osa N, Penelo E, Domènech JM. Psychometric properties of the Strengths and Difficulties Questionnaire (3-4) in 3-year-old preschoolers.Compr Psychiatry. 2013;54(3):282–291
17. Klein AM, Otto Y, Fuchs S, Zenger M, von Klitzing K. Psychometric properties of the parent-rated SDQ in preschoolers. Eur J Psychol Assess. 2013;29(2):96–104
18. Doi Y, Ishihara K, Uchiyama M. Reliability of the Strengths and Difficulties Questionnaire in Japanese preschool children aged 4–6 years.J Epidemiol. 2014;24(6):514–518
19. Jones EM, Ketende, SC, Sosthenes C. Millennium Cohort Study: User Guide to Analysing MCS Data Using SPSS. 1st ed. London, UK: Centre for Longitudinal Studies; 2010
20. Maydeu-Olivares A, Coffman DL, García-Forero C, Gallardo-Pujol D. Hypothesis testing for coefficient alpha: an SEM approach.Behav Res Methods. 2010; 42(2):618–625
22. Fornell C, Larcker DF. Evaluating structural equation models with unobservable variables and
measurement error.J Mark Res. 1981; 18(1):39–50
23. Muthén LK, Muthén BO.Mplus User’s Guide.7th ed. Los Angeles, CA: Muthén & Muthén; 1998–2012
24. Hu L-t, Bentler PM. Cutoff criteria forfit indexes in covariance structure analysis: conventional criteria versus new alternatives.Struct Equ Modeling. 1999; 6(1):1–55
25. Cheung, GW, Rensvold, RB. Evaluating goodness-of-fit indexes for testing measurement invariance.Structural Equation Modeling: A Multidisciplinary Journal. 2002;9(2):233–255
26. Kline, RB.Principles and Practice of Structural Equation Modeling. 2nd ed. New York: Guilford;2005
27. Niclasen J, Skovgaard AM, Andersen A-MN, Sømhovd MJ, Obel C. A confirmatory approach to examining the factor structure of the Strengths and Difficulties Questionnaire (SDQ): a large scale cohort
study.J Abnorm Child Psychol. 2013;41(3): 355–365
28. Alexander KE, Brijnath B, Mazza D.‘Can they really identify mental health problems at the age of three?’Parent and practitioner views about screening young children’s social and emotional development.Aust N Z J Psychiatry. 2013;47(6):538–545
DOI: 10.1542/peds.2014-2920 originally published online April 6, 2015;
2015;135;e1210
Pediatrics
Simone Croft, Christopher Stride, Barbara Maughan and Richard Rowe
Children
Validity of the Strengths and Difficulties Questionnaire in Preschool-Aged
Services
Updated Information &
http://pediatrics.aappublications.org/content/135/5/e1210
including high resolution figures, can be found at:
References
http://pediatrics.aappublications.org/content/135/5/e1210#BIBL
This article cites 23 articles, 1 of which you can access for free at:
Subspecialty Collections
y_sub
http://www.aappublications.org/cgi/collection/psychiatry_psycholog
Psychiatry/Psychology
al_issues_sub
http://www.aappublications.org/cgi/collection/development:behavior
Developmental/Behavioral Pediatrics
following collection(s):
This article, along with others on similar topics, appears in the
Permissions & Licensing
http://www.aappublications.org/site/misc/Permissions.xhtml
in its entirety can be found online at:
Information about reproducing this article in parts (figures, tables) or
Reprints
http://www.aappublications.org/site/misc/reprints.xhtml
DOI: 10.1542/peds.2014-2920 originally published online April 6, 2015;
2015;135;e1210
Pediatrics
Simone Croft, Christopher Stride, Barbara Maughan and Richard Rowe
Children
Validity of the Strengths and Difficulties Questionnaire in Preschool-Aged
http://pediatrics.aappublications.org/content/135/5/e1210
located on the World Wide Web at:
The online version of this article, along with updated information and services, is
http://pediatrics.aappublications.org/content/suppl/2015/03/31/peds.2014-2920.DCSupplemental
Data Supplement at:
by the American Academy of Pediatrics. All rights reserved. Print ISSN: 1073-0397.