A Factorial Analysis Of The Barriers To
Market Orientation Adoption Among Small
And Medium Enterprises (SMEs) In
A Developing Country
Job Dubihlela, Vaal University of Technology, South Africa M. Dhurup, Vaal University of Technology, South Africa
ABSTRACT
The purpose of the study was to examine the barriers of market orientation by SMEs in South Africa.
Data were collected using the personal face-to-face interviews with the use of a structured questionnaire. A total of 350 SMES were selected randomly and visited within the various municipal areas in South Africa. Exploratory factor analysis was used to identify the dimensions using the principal component analysis.
A four-factor structure emerged accounting for 62% of total variance. The reliability analysis, reflected coefficient values ranging from 0.743 to 0.893, indicating satisfactory internal consistency amongst variables within each dimension.
By analysing the barriers, the adoption of market orientation among SMEs, managers, and marketers are presented with recommended strategies and implications on how to embrace market orientation for effective business performance. Marketing capacities of SMEs may be strengthened through the implementing of market orientation.
SMEs are vital for socio-economic progress for developing economies. Effective implementation of market orientation can assist SMEs’ growth and development.
Keywords: Market Orientation; SMEs; Exploratory Factor Analysis; South Africa
1. INTRODUCTION
mall and medium sized enterprises (SMES) contribute significantly to economic development (Storey, 1994; Tsukahara, 2006; Singh & Garg, 2008), to production, competitiveness, employment, industrial growth, organisational decentralization and social coherence (Barry & Milner, 2002). SMEs function as the source of new enterprises, new innovative products, dynamic applications and flexible business forms (Tambunan, 2011). In the process, they help meet the socio-economic needs and form the zoning plans for the distribution of employment and income within the economy (Singh & Garg, 2008). SMEs add to the variety of goods and services offerings for customers to choose from, some of which may otherwise not be provided by the large businesses (Jackson, 2004). SMEs also act as a catalyst for economic growth as well as the development of diverse industries such as the arts, human resources, education and sports (Cronje, Du Toit & Motlatla, 2004).
The importance of adopting market orientation (MO) cannot be underestimated and has the potential to positively impact SMEs’ business success. According to Vieira (2010), market orientation adoption is an indication of the extent to which a company implements its marketing strategy; facilitating its ability to anticipate, react to, and
capitalize on environmental changes that lead to superior business performance. Market orientation has attracted professional and scholarly interests as a driver of business success (Walsh & Lipinski, 2009). Roomi, Harrison and Beaumont-Kerridge (2009) posit that the adoption of market orientation by SMEs enables them to enhance their ability to increase their performance in the market. If market orientation positively impacts business performance of SMES, then a study identifying the barriers to market orientation adoption is vital in a South African setting. In that vein, brief review of the importance of SMES provides a good pedestal for this study. They provide personalised services and make a positive contribution to wealth creation in the South African economy (DTI, 2005). They are breeding grounds for entrepreneurial talent and a testing ground for new products and agents of change, widely facilitating innovation and competition within various national economies (Barry & Milner, 2002).
2. LITERATURE REVIEW
This section provides a review of literature on the importance and contribution of SMEs to various facets of the economy, showing how that research on SMEs has practical implications.
2.1 SMEs Sector Contribution to the Economic Development
The SME sector contributes to key economic aggregates such as employment, Gross Domestic Product (GDP), innovation, exports and others. There are different views among scholars and policy makers about the dynamic contribution of SMEs. According to Tambunan (2011), Audretsch (2009) and Tsukahara (2006), SMEs make a significant contribution to reduction of poverty by providing employment opportunities. Kurokawa et al. (2010) posit that if the challenges confronting SMEs are addressed, they have a huge potential to become key players in generating productivity and competitiveness of the national production systems. Similarly, Subrahmanya et al. (2010) view SMEs as crucial in upgrading skills of owners, managers and their employees, strengthening linkages in the economically diverse activities, transferring technology know-how and complimenting large and multinational corporations in enabling sustainable development. SMEs are flexible and often act as subcontractors to large enterprises, ultimately leading to equitable distribution of income within the economy (Lloyd, 2002).
A large percentage of the growth in GDP and of the reduction in unemployment rates is because of the activities of the SMEs. Mahemba and Bruijn (2003) cite the fact that SMEs make up more than 90% of all business establishments worldwide. In the Republic of South Africa (RSA), it is estimated that 91% of the formal business entities are SMEs. The SMEs establishments contribute over 80% to global economies as compared to 63.6% contribution from their larger counterparts (Cronje et al., 2004).
The growth pattern and the overall health of the economy depend largely on dynamic business activities of both large enterprises and SMEs (Saayman, 1997). Vosloo (1994:53) summarised the importance of small enterprises as follows: “People make things happen, enterprises begin with people, enterprising people give rise to production, which in turn gives rise to employment”. Without the spirit of enterprise as expressed in SMEs activities, there can be limited employment creation or retarded economic growth. At the back of this reality, the government has targeted the SME sector in trying to alleviate the socio-economic challenges and prop economic growth (Subrahmanya et al., 2010), wealth distribution, crime reduction and unemployment (Mantle et al., 1992).
2.2 Barriers to Market Orientation Adoption
Numerous studies have argued that the adoption of market orientation is important for effective marketing, and research efforts still continue to focus on the degree of market orientation implementation (Narver & Slater, 1990; Osuagwu, 2006; Kumar, 2009; Edigheji, 2010), as well as the barriers to market orientation (Walsh & Lipinski, 2009; Zebal & Goodwin, 2012 ). Barriers to market orientation are those factors that deter the development of specific attitudes and practices aimed at effectively implementing the market orientation (Zebal & Goodwin, 2012).
organisational stakeholders to adapt to change (Pelham, 2000). Such a capability, if hindered, fails to provide an organisation with the means for adapting the marketing processes to changes in an environment, such as the changes in customer demands, the emergence of new markets and channels, or competitive moves (Kumar et al., 2011). In other words, the barriers are the superfluous elements militating against a favourable environment for adopting and implementing a market orientation.
Barriers to market orientation often lead to negative effects on customer satisfaction and customer loyalty, resulting in poor organizational performance (Ellis, 2006). An organization that is not market-orientated results in employee dissatisfaction (Gatignon & Xuereb, 1997). Barriers to market orientation also indicate a weak customer focus and a poor understanding of the organisational strengths and weaknesses (Kotler & Armstrong, 2011). It also means an incomplete understanding of the competition from an organization perspective (Shapiro, 1988). To avoid the challenges of these barriers to market orientation, SMEs must strive to be market oriented. Barriers to market orientation are the obstacles of the implementation of a marketing philosophy, such that the level of market orientation would depend on the degree of implementation of the marketing concept (Deng & Dart, 1994). Failure to focus on consumer needs and organisations’ profits results from specific market orientation barriers related to the basic implementation of the marketing concept (Perreault et al., 2011).
According to Gounaris and Avlonitis (1997), market orientation adoption requires organisational values embracing philosophy, attitudes and behaviours that are conducive and enabling for market-oriented strategies. Organisations must build dynamic marketing capabilities that enable them to adapt, change, and renew operational approaches over time (Homburg & Pflesser, 2000) in order to overcome the barriers to market orientation. Capabilities that provide the means for adapting the operational processes to changes in the marketing environment, such as changes in customer demands, the emergence of new markets and channels, and competitive changes (Sinkula et al., 1997). Some barriers emanate from failure to set specific departmental guidelines that guide the flexibility of their departments’ to achieve some market orientation (Lichtenthal & Wilson, 1992). These operational procedures and guidelines, systems, activity frameworks, structures and processes, as well as marketing and operational capabilities that can be adjusted to drive a market orientation culture, are critical for market orientation implementation (Kim & Mauborgne, 2009). Organisations that are willing to overcome barriers to market orientation are increasingly recognising the strategic importance of becoming more market oriented; they focus on the importance of driving market orientation deep into their organisational cultures (Kumar, 2009). Osuagwu (2006) posits that translating market orientation into action is traceable to marketing know-how, skills and organisational operations.
3. PROBLEM STATEMENT
Despite an avalanche of theoretical contributions made by many scholars on market orientation literature, it appears that most SMEs in South Africa do not embrace market orientation as key for their marketing strategies and their performance. While there is considerable optimism that SMEs form one of the leading driving forces for economic expansion in post-apartheid South Africa, market orientation is admittedly the characteristic of a limited number of them. The majority of SMEs fail to develop and exploit the benefits of the market orientation concept. There is a difficulty associated with translating market orientation into action, traceable to lack of requisite marketing know-how, skills and systems.
The paper seeks to advance the findings advocated in previous studies on market orientation. It employs a factor analytical approach to identify the barriers to market orientation and analyses the adoption of market orientation among SMEs in a developing country.
4. METHODOLOGY
To obtain an impartial perspective, a literature review was conducted on the barriers of market orientation adoption as well as an empirical enquiry. Primary data were collected using a quantitative research procedure with the use of a structured questionnaire as the survey instrument. The rationale for selecting a quantitative study was that it is cheaper, flexible and allows for replication of the research procedure, thus enhancing validity and reliability of research findings. Quantitative studies possess the objectivity and coherence that is necessary for addressing the issues and difficulties (Malhotra, 2010) that underpin the non-adoption of market orientation by SMEs in South Africa.
4.1 Sampling and Instrumentation
The sample constituted small and medium sized businesses operating within the Vaal Triangle of South Africa. The target population was restricted to managers, SME owners, and Heads of Marketing departments. An appropriate sampling frame was assembled from various lists that included a register from the Gauteng Enterprise Propeller (GEP), the Vaal Triangle business directory, as well as SME databases from the relevant municipalities in the region. The sample size of 350 was chosen, consistent with that used by a number of researchers in the area of market orientation business performance relationship. SMEs were randomly selected from the population so each population unit had an equally non-zero chance of being selected, thus allowing statistical inferences to be made (Bradley, 2007).
A structured questionnaire was used to obtain data. The questionnaire contained mainly two sections. These solicited demographic information of respondents, the business profiles of the SMEs involved in the survey, and the barriers to market orientation. The construct in this study adapted the 24-item scale utilised in some previous studies (Kohli et al., 1993:53; Zebal, 2003:96). These entail four components - customer emphasis, information generation, inter-functional coordination, and intelligence responsiveness. The choice of adapting the MARKOR scale used for this study is because it is a ‘prudent’ measure of market orientation that is well accepted in the market orientation literature (Bhuian, 1998:13; Zebal, 2003:101). In addition, the scale developers (Jaworski & Kohli, 2000:45) reported the results of two single informant samples and reliability alpha coefficient ranging from 0.8947 to 0.9613 and provided for the convergent and discriminant validity.
4.2 Data Collection
A cross-industry field survey of SMEs was carried out in Vaal Triangle through interviewing respondents using a predesigned data collection instrument (Malhotra, 2010). Five research fieldworkers were hired from a list of registered fourth-year university students pursuing marketing degrees. The fieldworkers were briefly trained by the researcher for subject knowledge, interviewing skills, interpersonal skills and professionalism (Kanuk & Berenson, 1975). Data collection activities employed face-to-face interviews that took place in Vaal Triangle Region between 19 September and 31 October, 2012. Malhotra (2010) states that personal face-to-face interviews have the potential of yielding high quantity and quality of data compared to the other survey methods. It also tends to be flexible, though it is an expensive method. This study adopted this method considering the potential increase in quantity and quality of information that could be obtained (Zebal, 2003:119). In addition, the flexibility of the personal interviews justifies the increased cost of using it (Walsh & Lipinski, 2009). A structured data collection instrument (questionnaire) was used to collect data. The questionnaire and its components are discussed in the following section.
non-contacts, unsatisfactory questionnaires, delayed questionnaires), a total number of 273 usable questionnaires (39.3%) were available for the data analysis.
5. FINDINGS AND DISCUSSION
The results are explained taking into account the composition of the sample in terms of small and medium enterprises, the demographic analysis of the data, and the descriptive statistics explaining the variables relating to the barriers of market orientation adoption. Thereafter, the exploratory factor analytical procedure and extraction of factors is discussed.
5.1 Characteristics of the Surveyed SMEs
Table 1 provides the profile of the surveyed SMEs in terms of their legal form (business type), their period in existence (age of business in years), their annual turnover (revenue), and employment level (number of employees). In terms of legal business forms, the respondents’ feedback indicated that most entities that were surveyed were formally registered business enterprises. The sample consisted mainly of private limited companies (Pty Ltd) (38.8%, n = 106), partnerships (25.3%, n = 69), close corporations (CCs) (24.2%, n = 66), public companies (3.3%, n = 9), sole traders (6.6%, n = 18), and co-operatives (1.8%, n = 5). Of these business operations, 38.1% (n = 104) of them had been in existence for over 10 years, 20.1% (n = 55) had been in operation for 7-10 years, 19.8% (n = 54) had been in business for 3-6 years, while the remainder - 22% (n = 60) - were emerging enterprises that had operated for less than three years.
Table 1: Age and Legal Forms of the Surveyed SMEs
SME’s Legal Form (Business Type) Freq % SME’s Business Age (Years) Freq %
Sole trader (one-man business) 18 6.6 Less than 3 years 60 22.0
Partnership 69 25.3 Between 3-6 years 54 19.8
Close corporation 66 24.2 Between 7-10 years 55 20.1
Co-operative 5 1.8 Over 10 years 104 38.1
Private company (Pty) Ltd 106 38.8
Public Company (Ltd) 9 3.3
Total 273 100 Total 273 100
5.2 Descriptive Statistics
Table 2: Turnover and Employment Capacity
Annual Turnover Performance (Rands) Freq % Number Of Employees (Fulltime) Freq %
Less than R2 million 112 41.0 Less than 10 employees 100 36.6
Between R2 million and R4 million 51 18.7 Between 10 - 50 employees 101 37.0 Between R4 000 001 and R8 million 29 10.6 Between 51 - 100 employees 37 13.6 Between R8 000 001 and R16 million 22 8.1 Between 101 - 200 employees 29 10.6
R16 000 001 and R32 million 19 7.0 Above 200 employees 6 2.2
Over R32 million 40 14.7
Total 273 100 Total 273 100
5.3 Industry Sector Composition for Surveyed SMEs
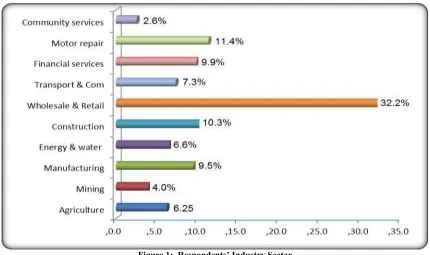
The study also sought to ensure that companies operating in diverse industry settings were included in the sample. Industries were selected to cover both high and low technology environments and companies identified using the GEP and the SEDA databases. The industries covered, and their representations in the sample, are illustrated in Figure 1. The graph shows wholesale and retail (32.2%), manufacturing (9.5%), mining (4.0%), agriculture (6.2%), construction (10.3%), financial services (9.9%), transport and communications (7.3%), energy and water (6.6%), motor repairs (11.4%), and community services (2.6%) as represented in the sample. Although the majority of the respondents were wholesale and retail enterprises, the sample generally contained significant proportions of diverse industries. A cursory glance of the results indicates that a large proportion of the SME industries in the Vaal Triangle region are, in fact, manufacturing, construction, wholesale and retail.
Figure 1: Respondents’ Industry Sector
5.4 Characteristics of the Respondents
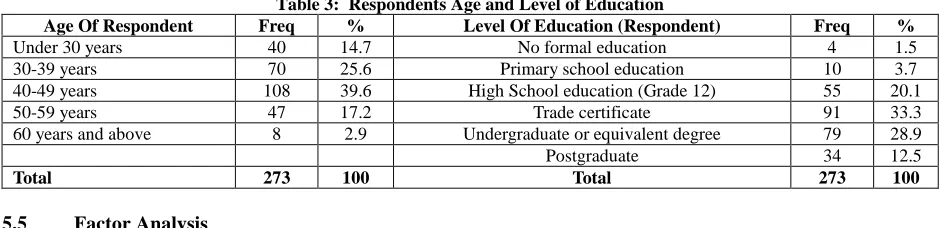
levels, Table 3 shows that three quarters (33.3% + 28.9% + 12.5% = 74.7%) of the respondents had at least a tertiary qualification. This implies that the majority of the individuals who own or manage SME businesses either had a trade certificate (33.3%), an equivalent of a degree (28.9), or a postgraduate qualification (12.5%). The remainder (25.3% of the sample) represented entrepreneurs either possessing basic education (3.7% + 20.1% = 23.8%) or no formal education at all (1.5%).
Table 3: Respondents Age and Level of Education
Age Of Respondent Freq % Level Of Education (Respondent) Freq %
Under 30 years 40 14.7 No formal education 4 1.5
30-39 years 70 25.6 Primary school education 10 3.7
40-49 years 108 39.6 High School education (Grade 12) 55 20.1
50-59 years 47 17.2 Trade certificate 91 33.3
60 years and above 8 2.9 Undergraduate or equivalent degree 79 28.9
Postgraduate 34 12.5
Total 273 100 Total 273 100
5.5 Factor Analysis
In addition to obtaining the sample descriptors and characteristics of the respondents a principal components factor analysis was conducted on the twelve-item scale to develop the set of factors that can be classified as barriers of the adoption of market orientation among SMEs in a South African setting. Prior to factor analysis, the appropriateness of factorability on the data set was established. Examination of the correlation matrix (strength of linear association among variables) revealed that a substantial number (74.9%) of the variables were > 0.30 which, according to Zikmund (2000), indicates factorability.
The Kaiser-Meyer-Olkin (KMO) and the Bartlett’s tests were also applied in order to further determine the appropriateness of the data set for factor analysis. The approximate chi-square was 4,975,705 with 276 degrees of freedom and significant at p < 0.000. The KMO value was 0.834 which is considered satisfactory (Malhotra, 2010). Both test statistics inferred that factor analysis was justifiable for the data set. The principal component analysis (initially unrotated) was applied, extracting factors with eigenvalues greater than one (Malhotra, 2010). This procedure extracted factors that were difficult to interpret. Factor analysis with Kaiser Normalisation (varimax rotation) was then applied in nine iterations revealing a clearer factor structure with loadings ranging from 0.605 to 0.874 (only loadings of 0.60 were retained in the study). This is consistent with the guidelines of Uzoka et al. (2007) and Zikmund (2000) who maintain that loadings of 0.30 are minimum levels; those around 0.40 are relatively important and those above 0.50 are considered more important.
The subsequent sections provide a discussion of the factor analysis procedures, methods of factor extraction, factor structure, naming and interpretation of the dimensions. The criterion for the factor extraction for the barriers to market orientation section was determined by utilising the eigenvalues, percentage of variance explained, and the scree plot.
5.5.1 Factor Structure of the Barriers to Market Orientation
Table 4: Rotated Component Matrix (Barriers to Market Orientation)
Variables Number of Factors
1 2 3 4
There are many promotion wars in our company 0.797 -0.045 0.133 -0.087
We are witnessing demand for our products and services from customers who
never bought 0.787 0.240 0.101 0.105
Our customers tend to look for new product all the time 0.732 0.262 0.076 0.159
Price competition is a hallmark of our company 0.708 0.006 0.231 -0.157
We respond rapidly to competitors’ actions 0.691 -0.071 0.220 -0.008
Technological changes provide big opportunities in our company 0.684 0.226 0.053 0.108
People in one department generally dislike interacting with those from other
departments 0.042 0.766 -0.015 -0.041
There is little or no interdepartmental conflict in this company 0.054 0.766 0.015 -0.110
In this company, regardless of their rank or position, it is easy to talk to anyone
needed 0.106 0.736 0.104 -0.200
Employees from different departments feel that the goals of their respective
departments are in harmony 0.106 0.603 0.152 0.079
Even small matters have to be referred to someone higher for a final decision 0.117 0.473 0.248 -0.125
People in this company are quite accessible to those in other departments 0.016 0.081 0.814 0.028
We regularly monitor our competitors’ marketing efforts 0.250 0.122 0.706 0.040
There is ample opportunity for informal hall talk among individuals from different
departments 0.121 0.323 0.632 -0.087
Employees from different departments feel comfortable calling each other when the
need arises 0.246 0.149 0.530 0.239
We frequently collect marketing data on our competitors to help direct our
marketing plans 0.168 -0.111 0.518 0.263
In our company, individuals’ attempts in promoting self-interest are accepted -0.049 -0.064 0.145 0.868
We don’t encourage political behaviour of employees in our company 0.086 -0.258 0.097 0.819
Cronbach's Alpha 0.849 0.746 0.719 0.763
Scale means 21.6044 18.6886 17.3040 4.6447
%Total variance exp 26.156 14.308 10.028 6.526
Standard deviation 5.5158 3.9846 3.9925 2.5048
Extraction Method: Principal Component Analysis. Rotation Method: Varimax with Kaiser Normalization. Rotation converged in 6 iterations.
5.5.2 Interpretation of the Barriers to Market Orientation
Factor one - technological turbulence - comprised six variables accounting for 26.156% of the variance with item mean of 3.601 and eigenvalue of 4.708. The factor entails valuing technology and allocating greater resources to technology in order to manage the uncertainty created by introducing technological changes. Technology is understood as “everything that is new and is driving change in the world today”, and the correct usage of technology can provide an organisation with considerable operational and competitive benefits (Vieira, 2010). The factor addresses competitive and other issues that result from technological turbulence and innovation.
Factor two - centralisation and formalisation - comprised five variables that accounted for 14.308% of the total variance, with eigenvalue of 2.576 and item mean of 3.738. Centralisation represents a situation in which all the power for decision-making rests at a single point within the organisation (Kotler & Armstrong, 2011:13). The bureaucracy that often results from the above dimensions contributes to heightened levels of uncertainty, inter-departmental conflicts and competition, a breakdown in communication flows and delays in decision-making. Verhees and Meulenberg (2004:134) refer to centralisation as being the inverse of the amount of delegation of decision-making authority throughout an organisation and the extent of participation by organisational members in decision-making. Jaworski and Kohli (2000:51) suggested that centralisation may hinder the generation and dissemination of information and the design of organisational response to adapt to an environment.
to which it monitors strategies and tactics of its rivals (Zebal, 2003). Lamb et al. (2010) are of the view that organisations should design offers that satisfy targeted customer needs better than competitors do in order to gain a competitive advantage. Therefore, the greater the competitive intensity among organisations, the greater the need for an organisation to be market oriented.
Factor four - inter-departmental conflict - with variance of 6.526%, eigenvalue value of 1.175, and item mean of 2.322, relates to how conflict can impact overall market orientation of the organisation. Bulent and Seigyoung (2006) are of the view that inter-departmental conflict is detrimental to the implementation of market orientation. Inter-departmental conflict has the potential to contribute to breakdowns in communication, secrecy and inbred negative competitive tendencies. Frustrations arise when individuals believe that the other party is not behaving in a fair manner (Ruekert & Walker 1987). Kim and Mauborgne (2009) argue that that conflict results in reduced inter-functional performance.
6. CONCLUSION
Generally, barriers to market orientation have received limited analyses (Osuagwu, 2006). As noted, the available literature identifies barriers to market orientation development, which are complex, interrelated and numerous. The findings of this preliminary study do provide basic support for a four-dimensional structure highlighting the barriers to market orientation adoption among SMEs in South Africa; namely, centralisation and formalisation; competitive intensity; inter-departmental conflict and technological turbulence. In this regard, it may be concluded that a systematic implementation of market-orientated strategies is negatively related to overall business performance (Jaworski & Kohli, 2000; Vieira, 2010; Zebal & Goodwin, 2012). It can also be confirmed in this study that, although market orientation is critical and topical for its influence on business and market performance, there exists several barriers that impede its implementation and usage. It is noteworthy to state that most studies on market orientation barriers share the common theme of behaviour.
The SMEs operating in the South African economy are threatened by a dynamic and highly unstable market condition. Adoption and implementation of market-oriented strategies is therefore needed in order to cushion SMEs from the challenging economic conditions, hostile competitive environment, and regressive operational environment. Recommendations for marketing practitioners, managers and business owners emerge from this study. It can be argued that the majority of marketing professionals and managers should be aware of some barriers to market orientation. The real implication which underlies the findings vital for managers is that, given that few organizations exhibit high market orientation levels, basic issues still need to be addressed. Therefore, marketing professionals and managers should identify not only which barriers restrict market orientation, but also why these barriers occur.
This study is not without some limitations and hence the findings must be viewed as tentative. Due to the adopted cross-sectional approach, our conclusions are restricted to those of associations rather than causation. Also, due to the multi-organizational nature of the sample used in this study, differences among the SMEs were not accounted for in this paper. In this context, a worthy area of investigation may be to test for differences between the market-oriented and non-market-oriented SMEs.
AUTHOR INFORMATION
Job Dubihlela is a former banker turned academic; a senior lecturer in the Faculty of Management Sciences at Vaal University of Technology. His research interest is focused on small business development, small business finance, financial services marketing, and the equity market dynamics. His research appears in various international journals and conference proceedings. E-mail: [email protected] (Corresponding author)
REFERENCES
1. Appiah-Adu, K. (1998). Market orientation and performance: Empirical tests in a transition economy. Journal of Strategic Marketing, 6: 25-45.
2. Audretsch, D. (2009). Entrepreneurship, growth, and public policy. Cambridge: University Press. 3. Barry H & Milner B. (2002). SMEs and E-Commerce; a departure from the traditional prioritisation of
training? Journal of European Industrial Training, 26(7): 316-326.
4. Bhuian, S. N. (1998). An empirical examination of market orientation in Saudi Arabian manufacturing companies. Journal of Business Research, 43: 13-25.
5. Bradley N. (2007). Marketing Research: tools & techniques. Oxford:Oxford University Press. 6. Bulent, M. & Seigyoung, A. (2006). Creating a firm level dynamic capability through capitalizing on
Market Orientation and Innovativeness. Journal of the Academy of Marketing Science, 34(1): 63-73. 7. Cronje GJ, Du Toit J & Motlatla M. (2004). Introduction to Business Management. 6th ed. Cape Town:
Oxford Business Press.
8. Deng, S. & Dart, J. (1994). Measuring market orientation: A multi-item approach. Journal of Marketing Management, 10(8): 725-742.
9. Department of Trade and Industry (DTI). (2005). Integrated strategy on the promotion of entrepreneurship and small business enterprises. http://www.dti.gov.za/smme/strategy.pdf Date of access: 23 Jun 2012. 10. Edigheji, O.E. (2010). Constructing a democratic developmental State in South Africa: Potentials and
Challenges. Cape Town: Human Science Research Council Press.
11. Ellis, P.D. (2006). Market orientation and performance: A meta-analysis and cross-national comparisons. Journal of Management Studies, 43(5): 1089-1107.
12. Gatignon, H. & Xuereb, J.B. (1997). Strategic orientation of the firm and new product performance. Journal of Marketing Research, 34(1): 77-90.
13. Gounaris, S.P. & Avlonitis, G.J. (1997). Marketing orientation and company performance. Industrial Marketing Management,26: 385-402.
14. Harris, L.C. & Ogbonna, E. (2001). Strategic human resource management, market orientation, and organisational performance. Journal of Business Research, 51(2): 157-66.
15. Homburg, C. & Pflesser, C. (2000). A multiple-layer model of market oriented organisational culture: measurement issues and performance outcomes. Journal of Marketing Research37(4): 449-462. 16. Ishengoma, E.K. & Kappel, R. (2008). Business constraints and growth potential of micro and small
manufacturing enterprises in Uganda. GIGA working papers 78.Hamburg: German Institute of Global and Area Studies.
17. Jackson, M.L.P. (2004). Entrepreneurial support in South Africa: a case study of a small enterprise support centre in Johannesburg.PhD. Thesis. Birmingham: University of Birmingham.
18. Jaworski, B.J. & Kohli, A.K. (2000). Market-driven versus driving markets. Journal of the Academy of Marketing Science, 28(1): 45-54.
19. Kanuk, L. & Berenson, C. (1975). Mail surveys and response rates: a literature review. Journal of Marketing Research, (4): 440-53.
20. Kim, W. C. H. & Mauborgne, R. (2009). How Strategy Shapes Structure. Harvard Business Review, 9: 73-80.
21. Kotler, P. & Armstrong, G. (2011). Principles of Marketing. 14th edition. Boston: Prentice-Hall.
22. Kumar, N. (2009). How emerging giants are rewriting the rules of M&A. Harvard Business Review, 87(5): 115-121.
23. Kumar, V., Jones, E., Venkatesan, R. & Leone, R.P. (2011). Is market orientation a source of sustainable competitive advantage or simply the cost of competing? Journal of Marketing, 75(1): 16-30.
24. Kurokawa, T. Tembo, F. & Velde, D.W. (2010). Challenges for the ‘one village one product’ (OVOP) movement in Sub-Saharan Africa: Insights from Malawi, Japan and Thailand Report. London: Overseas Development Institute.
25. Lamb, C. W., Hair, J. F., McDaniel, C., Boshoff, C. & Terblanche, N.S. (2010). Marketing - South African 4th edition. Cape Town: Oxford University Press Southern Africa.
27. Lloyd, H.R. 2002. Small and Medium Enterprises (SMEs): instruments of economic growth and
development in a South African regional dispensation.Paper read at the annual conference of the European Regional Science Association held in Port Elizabeth on 2-6 August 2002: Port Elizabeth,pp1-25.
28. Mahemba, C.M. & De Bruijn, E.J. (2003). Innovation activities by small and medium-sized manufacturing Enterprises in Tanzania. Creativity and Innovation Management, 12(3): 162-173.
29. Malhotra, N. K. (2010). Marketing research: An applied orientation. 6th edition. Eaglewood Cliffs: Prentice- Hall.
30. Mantle, C., Harrod, J. & Nel, B. (1992). Profile of small businesses in South Africa and ways of stimulating the sector. Rivonia: BMI.
31. Narver, J. C. & Slater, S. F. (1990). The effect of a market orientation on business profitability. Journal of Marketing, 54(4): 20-35.
32. Osuagwu, L. (2006). Market orientation in Nigerian companies. Journal of Marketing Intelligence & Planning, 24: 608-631.
33. Pelham, A.M. (2000). Market orientation and other potential influences on performance in small and medium-sized. Journal of Small Business Management, 38(1): 45-67.
34. Perreault, W., Cannon, J. & Mccarthy, E. (2011). Basic Marketing. 18th edition. Homewoods: McGraw-Hill.
35. Roomi, M. A., Harrison, P. & Beaumont-Kerridge, J. (2009). Women-owned small and medium
enterprises in England: Analysis of factors influencing the growth process. Journal of Small Business and Enterprise Development, 16(2): 270-288.
36. Ruekert, R. W. & Walker, O. C. (1987). Marketing's interaction with other functional units: A conceptual framework and empirical evidence. Journal of Marketing, 51(1): 1-19.
37. Saayman, A. (1997). Die rol van die entrepreneur in die ekonomie.Pretoria: University of Pretoria. (M-com dissertation).
38. Shapiro, B. (1988). What the hell is ‘market-oriented’? Harvard Business Review, 66(6): 119-125. 39. Storey, D. (1994). Understanding the Small Business Sector. London: Routledge.
40. Subrahmanya, M.H.B., Mathirajan, M. & Krishnaswamy, K.N. (2010). Importance of technological innovation for SME Growth: Evidence from India. World Economic and Financial Surveys, World Economic Outlook (WEO).
41. Subramanian, M. J. & Gopalakrishna, R. P. (2001). The Market Orientation- Performance Relationship in the Context of a Developing Economy. Journal of Business Research, 53(1): 13-18.
42. Singh, R. (2009). Does your library have a marketing culture? Implications for service providers. Library Management, 30(3): 117-137.
43. Sinkula, J., Baker, W. & Noordewier, T. (1997). A framework for market-based organisational learning: Linking values, knowledge, and behaviour. Journal of the Academy of Marketing Science. 25(1): 305-18. 44. Tambunan, T.T.H. (2011). The impact of the 2008-2009 global economic crises on a developing country’s
economy: Studies from Indonesia (March 18, 2011). Journal of Business and Economics, 2(3): 175-197. 45. Tsukahara, O. (2006). SMEs financing in Japan (presentation). Tokyo. Japan Finance Corporation for
SMEs (JASME).
46. Uzoka, F.M.E., Shemi A.P. & Seleka G.G. (2007). Behavioural influences of E-Commerce adoption in a developing country context. Electronic Journal of Information Systems in Developing Countries, 31(4): 1-15.
47. Verhees, F.J.H.M. & Meulenberg, M.T.G. (2004). Market orientation, innovativeness, product innovation, and performance in small firms. Journal of Small Business Management, 42(2): 134-54.
48. Vieira V.A. (2010). Antecedents and consequences of market orientation: a Brazilian meta-analysis and an international mega-analysis. Brazilian Administration Review, Curitiba, 7: 44-58.
49. Vosloo, W.B. (1994). Entrepreneurship and economic growth. Pretoria: HSRC publishers. 50. Walsh, F.M. & Lipinski, J. (2009). The role of the marketing function in small and medium sized
enterprises. Journal of Small Business and Enterprise Development. 16: 569-585.
51. Zebal, M.A. (2003). A Synthesis Model of Market Orientation for a Developing Country – The Case of Bangladesh. Melbourne: Victoria University (PhD-Thesis).
52. Zebal, M.A. & Goodwin, D.R. (2012). Market orientation and performance in private universities. Marketing Intelligence and Planning, 30(3): 339-357.