www.nat-hazards-earth-syst-sci.net/10/747/2010/ © Author(s) 2010. This work is distributed under the Creative Commons Attribution 3.0 License.
and Earth
System Sciences
The Variable Scale Evacuation Model (VSEM): a new tool for
simulating massive evacuation processes during volcanic crises
J. M. Marrero1, A. Garc´ıa1, A. Llinares2, J. A. Rodr´ıguez-Losada2, and R. Ortiz1
1Department of Volcanology, National Museum of Natural Sciences, CSIC. J. Gutierrez Abascal, 2, 28006 Madrid, Spain 2Department of Soils Science and Geology, University of La Laguna, 38206 La Laguna, Tenerife, Canary Islands, Spain Received: 10 November 2009 – Revised: 9 March 2010 – Accepted: 19 March 2010 – Published: 14 April 2010
Abstract. Volcanic eruptions are among the most awesome and powerful displays of nature’s force, constituting a major natural hazard for society (a single eruption can claim thou-sands of lives in an instant). Consequently, assessment and management of volcanic risk have become critically impor-tant goals of modern volcanology. Over recent years, nu-merous tools have been developed to evaluate volcanic risk and support volcanic crisis management: probabilistic anal-ysis of future eruptions, hazard and risk maps, event trees, etc. However, there has been little improvement in the tools that may help Civil Defense officials to prepare Emergency Plans. Here we present a new tool for simulating mas-sive evacuation processes during volcanic crisis: the Vari-able Scale Evacuation Model (VSEM). The main objective of the VSEM software is to optimize the evacuation process of Emergency Plans during volcanic crisis. For this, the VSEM allows the simulation of an evacuation considering different strategies depending on diverse impact scenarios. VSEM is able to calculate the required time for the complete evacua-tion taking into account diverse evacuaevacua-tion scenarios (num-ber and type of population, infrastructure, road network, etc.) and to detect high-risk or “blackspots” of the road network. The program is versatile and can work at different scales, thus being capable of simulating the evacuation of small vil-lages as well as huge cities.
Correspondence to: J. M. Marrero
1 Introduction
Volcanic eruptions are awesome and powerful displays of na-ture’s force, constituting a major natural hazard for society (Blong and McKee, 1995; Blong, 2000; Sigurdsson, 2000; Blong, 2003; Witham, 2005). Many volcanic areas are lo-cated in densely populated areas. According to Small and Naumann (2001), almost 9% (around half a billion people) of the world’s 1990 population lived within 100 km of an histor-ically active volcano and 12% within 100 km of a volcano be-lieved to have been active during the last 10 000 years. Thus, assessment and management of volcanic risk are now among the main goals of modern volcanology. Both topics involve important scientific, economic and political issues, especially for densely populated areas in volcanic regions, such as Mex-ico, Japan, Ecuador and other countries hosting active and potentially active volcanoes, among others.
Volcanic crisis management, as understood nowadays, is focused on determining, as objectively as possible, when, where and how a volcanic event will take place and on es-tablishing the lines of action to mitigate its impact on the population. This way of defining crisis management was es-tablished after the volcanic eruptions of St. Helens (USA, 1980) (Lipman and Mullineaux, 1981), El Chich´on (Mex-ico, 1982) (De la Cruz-Reyna and Mart´ın del Pozzo; 2009, Tilling, 2009), Nevado del Ruiz (Colombia, 1985) (Voight, 1990) took place. These and other natural disasters prompted the United Nations to declare an International Decade for Natural Disaster Reduction (UN General Assembly, 1987).
and other official groups is therefore crucial. However, the relation between all “team members” is not always as suc-cessful as expected or required. In many situations, the com-plexity of volcanic forecasting and the subjectivity on the decisions to be taken may lead to several conflicts of inter-ests. During the Nevado del Ruiz eruption (Colombia, 1985; Voight, 1990) disconnection between warning release emit-ted by Civil Defense and the way the local authorities and the population interpreted the information caused several thou-sands of fatalities. The day of the eruption, two successive warning releases were issued at 04:00 and 07:00 p.m., hours before Armero town was destroyed by a lahar and more than 20 000 people died. Another example is the El Chich´on vol-cano eruption in 1982 (De la Cruz-Reyna and Mart´ın del Pozzo, 2009). When the eruption first began, the population evacuated spontaneously fleeing from the volcano activity. However, due to the paucity of scientific knowledge about the volcano, lack of monitoring data and poor coordination between the on-site scientific teams and authorities allowed people to return home. Then a new and more powerful ex-plosion a week later killed more than 2000 persons (Tilling, 2009).
During the periods of volcanic unrest – expressed by de-partures from normal behavior (e.g., increased earthquakes, ground deformation, changes in fumarolic activity) (Newhall and Dzurisin, 1988) volcanologist are able to monitor the volcanic activity, to observe the possible changes occurring to the system and to attempt some kind of forecast (Voight, 1988; Marzocchi et al., 2007). However, even with a volcano reawakening one or more years before eruption, civil-defense and political decisions generally have to be taken only few days or weeks before eruption onset (Woo, 2008). In a short time, the authorities have to adapt the existing Emergency plans (if any), especially those related to the evacuation of the potentially affected population, to the eruptive scenarios proposed by the volcanologist. In these cases, Civil Defense and other decision-makers need answers about the ongoing situation, and qualitative statements of hazard and risk are of little use in making life-and-death decisions about mitiga-tion measures (Newhall and Hoblitt, 2002). Therefore, dur-ing the last decades, researchers have been developdur-ing tools to give some quantitative estimate of at least some of the as-pects concerning volcanic risk. Several software tools have been developed to support volcanic crisis management, es-pecially for the elaboration of hazard and risk maps, event tree, eruption scenarios, eruption forecast, cost-benefit analy-sis framework and evacuation models (e.g. Ortiz et al., 2003; Newhall and Hoblitt, 2002; Thierry et al., 2007; Zuccaro et al., 2008; Woo, 2008; Marrero, 2009). The results obtained are offered to Civil Defense officials in a simplified way com-monly as impact or generic maps, which are included in the Emergency Plan.
Once a volcanic crisis has begun, one of the main actions for risk mitigation is the evacuation of the exposed popula-tion (Marzocchi and Woo, 2007). Since the 1970s, various
evacuation models have been developed for different natu-ral and man-made hazards. These may be grouped into: i) models related to meteorological phenomena that may affect quite vast areas (Mei, 2002); ii) models associated with high risk installations as nuclear power stations, which are appli-cable only in a detailed scale involving only small villages surrounding the installations (CTA, 2008); and iii) models related to fire in infrastructures and installations that focused mainly on the spaces inside the building (Lu et al., 2003). The great majority of the latter models work on a single scale (small, medium or large) based on their design and initial ob-jective. Some of them are only focused on one specific aspect of the evacuation process as for example, crossroad manage-ment (Cova and Johnson, 2003). Others are site specific and only apply to the places they have been designed for and, from a methodological point of view, it is quite complicated to adapt them to other areas.
Evacuation of volcanic areas is not an easy task, espe-cially for heavily populated areas that require the evacuation of many thousands of people. For example, in case of an eruption of Vesuvius, the Vesuvius Emergency Plan consid-ers evacuating 600 000 people (Marzocchi and Woo, 2007). The main concern of the responsible authorities is then how and where to evacuate the threatened population, and equally important, how long the whole evacuation process will take. Of course, the longer it takes to mobilise the affected popula-tion the sooner the decision to evacuate has to be taken. Also, a critical fact to take into account is the decision of when to order the evacuation, or to even order an evacuation at all. Both decisions have high economical and political costs (Woo, 2008). There are unnecessary evacuations resulting from a “false alarm” or failed eruption forecast. However, the available software does not address these problems.
In this paper, we present a new tool for simulating mas-sive evacuation processes during volcanic crises: the Vari-able Scale Evacuation Model (VSEM). The main objective of the VSEM is to optimise the evacuation process of Emer-gency Plans during volcanic crises.
We give a brief description of the VSEM and an exam-ple of its applicability simulating the evacuation of the vil-lages located around El Chich´on volcano (Chiapas, Mexico) based on a scenario assuming some future moderate to large eruption (VEI 2–5). “VEI” or Volcanic Explosivity Index (Newhall and Self, 1982), was defined as a parameter related to the eruptive power after studying up to 8000 historic and prehistoric volcanic eruptions to measure their relative ex-plosiveness.
2 The VSEM
The Variable Scale Evacuation Model (VSEM) is a computer application developed in ANSI C (Kernighan and Ritch, 1978) that simulates the evacuation process for a threatened area. VSEM has been developed to work at any scale (i.e. it may be applied to a single town or city or to more exten-sive areas) and is completely independent of other software packages. In order to prepare the required input data to run VSEM, it is necessary to use Geographical Information Sys-tems (GIS) software. Since the required tools are related to basic editing tasks, they are available in all currently existing GIS packages, even the open source ones.
VSEM is based on cellular automata, a mathematical model that represents a dynamic system evolving in dis-crete time steps. In the VSEM code, a transient-update non-homogeneous function and stochastic elements are used to determine the number of persons that may incorporate into the evacuation at any moment. It is a model of class I, dis-crete in time and space, in which the evolution of the pro-cess leads to a stable and homogeneous configuration, i.e., all cells tend to reach the same value, zero (Clymer, 1990). In order to analyse the evolution of the evacuation process and select the most suitable evacuation strategy, VSEM ex-ports different types of output files at certain pre-established time intervals.
Different evacuation scenarios and new variables can be added to the VSEM, depending on the available knowledge and the characteristics of the area. The VSEM calculates the evacuation time and the connectivity reliability (Taylor, 2007) to determine the best strategies of evacuation when designing an emergency plan.
2.1 Road network vulnerability
When activating an existing Emergency Plan, it is very im-portant to take into account any ongoing or incoming vol-canic activity, the possible environmental conditions (e.g., hurricanes, rain season, etc.) and the forecast population be-haviour during the evacuation. The concept of vulnerability adopted in this paper is given in UNDRO, 1979: “degree of
loss to a given element at risk or set of such elements result-ing from the occurrence of a natural phenomenon of a given magnitude and expressed on a scale from 0 (no damage) to 1 (total loss)”.
It is possible that under some specific circumstances the link/route/road get completely or partially blocked. In or-der to incorporate such situations into the VSEM, we have added four further attributes to represent the vulnerability of the road network (i.e. earthquakes, ash fall, slope-collapse, lahars, mudflows or landslides). However, road network vul-nerability is not calculated by VSEM. All vulvul-nerability data for each of the latter phenomena is obtained individually by several methodologies and introduced in the GIS expressed in terms of reduction factor of the road capacity (i.e. for each
point). When the vulnerability is taken into account and there are roadblocks, results for the evacuate simulation in VSEM show two effects; 1) number of people than can not be evac-uated; 2) an increment in the evacuation time. The first sit-uation occurs when there is not available other evacsit-uation route and the main one is blocked. The second situation oc-curs when another slower evacuation route is selected. 2.2 Evacuation zone vulnerability and population
behaviour
It is very important to distinguish between the road network vulnerability and the impact zone vulnerability. The first one is not related only with the volcanic hazards (e.g. landslides produced by heavy rain) and is calculated for every point of the road network. The second one is directly related to the forecasted volcano activity; the impact zone or ground zero has a vulnerability value of 1, and everybody should be evac-uated. The impact zone represents the total area that has to be evacuated due to the threat of pyroclastic flows, mudflows (lahar), glacier bursts, tsunamis or debris avalanches, among other threats (UNDRO and UNESCO, 1985). This is the rea-son because of gradations are not used in the impact zone. However, this delimitation is not always easy to establish because of the economical and political costs repercussions (Woo, 2008).
During an evacuation process, knowledge of the behaviour of the population being moved is fundamental to estimate the total time required for evacuating. For a proper evaluation of this behaviour different surveys are made in order to esti-mate how many people would evacuate, how much time they need to be prepared for it, etc. There are numerous works and models focused on evacuation during hurricanes in USA (PBSJ Inc., 1999; Mei, 2002). However, in case of evacua-tion due to fast-moving hazards of uncertain spatial impact (i.e. meteorological phenomenon), no one is willing to evac-uate. One of the main problems that the researchers have to face is to forecast how many people will be evacuated and when this will happen (Cova and Church, 1997; Dash and Gladwin, 2007). Due to the characteristics of the process the results obtained for hurricanes cannot be easily extrapolated to other hazards or areas.
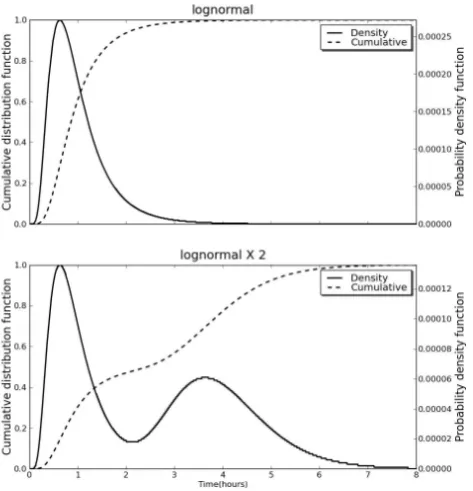
Fig. 1. VSEM uses lognormal distributions to simulate the process
of incorporation of the population into the evacuation process. Peo-ple joined in the evacuation flux are represented by the black line and people arrived to check or exit point is represented by a dashed line. A single distribution implies that the whole population reacts in the same way. A superposition of several different lognormal dis-tributions simulates the behaviour of the various subgroups existing inside the threatened population due to its age, economic level, etc.
distribution by reducing the dispersion value and the mean time. However, the experience during massive evacuations related to volcanic crises shows that the population not al-ways behaves as expected by the Emergency Plan provided by Civil Defense. It may also occur that part of the popula-tion that should not be evacuated decides to auto-evacuate, thereby saturating the road network and the available facili-ties. To simulate this situation, the panic variable has been added to the VSEM. This variable represents the outside of impact zone population percentage that spontaneously evac-uate. This value depends on different factors (e.g. distance to the volcano and/or the proximity to zones that have to be officially evacuated, a random value to represent the rumour propagation generated by alarmist mass media). As the panic is applied outside the impact zone, the methodology for de-termining how many people could evacuate may vary. In Chakraborty et al. (2005) spatial variability of geophysical risk and social vulnerabilities is analysed. This methodology could be used to get the panic value.
Another fact to consider is that VSEM does not try to forecast the exact behaviour of a real evacuation. A clear example of evacuation difficulties was shown at volcano Popocatepetl crisis in December 2000, Mexico State
(Vald´es-Gonz´alez et al., 2001; Marrero, 2009). In that case, the Scientific Committee recommended the evacuation of a spe-cific area, while authorities decided to evacuate a wider area. After the evacuation began, people had to be returned to their towns. Two days later, the same people had to be re-evacuated due to the general fear and worry. The evacuation process complexity depends on multiple elements and not all of them can be simulated.
2.3 Preparing input data for VSEM
To comprehend how to prepare the input data for VSEM, it is necessary to understand some basic concepts of the GIS. In a GIS, discrete elements of the real world are represented as: points, polylines and polygons. These elements are stored in linked vectorial layers, using an internal index code, to alphanumeric attribute tables. These attribute tables, list all the information concerning the different features included in the vectorial layer.
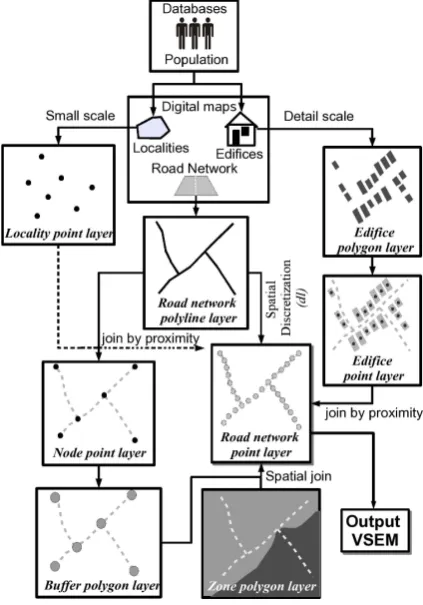
The data input in VSEM is based on the simplest entity used in GIS, the point. Thus, the main objective is to create a single vectorial point layer that is linked to an attribute table containing the main information required to run VSEM. To start preparing the input data, it is necessary to know the lo-cation of the threatened population and the road network to be used during the evacuation process (Fig. 2).
The road network is added to the GIS using a polyline layer (road network polyline layer). In many cases, gov-ernmental organisations are able to provide such informa-tion and then only few modificainforma-tions are necessary. In other cases, this layer has to be created with information from or-tophoto maps or by mapping the routes of different roads with a vehicle equipped with a GPS receiver. VSEM takes into account the whole road network regardless of the qual-ity (i.e. category) of the road (e.g., motorways, path, tracks, etc.). This is fundamental since it may come that main roads get blocked during a real evacuation process and then alternative routes are required, even using paths or tracks. The attribute table related to the road network polyline layer records the information that characterises each road link (e.g., name or ID, category, etc.).
Once the road network polyline layer is complete and cor-rectly digitized, we use it to elaborate three other layers. The first one, is obtained converting the polylines of the road
net-work polyline layer into points using a homogeneous
Fig. 2. GIS Processing data. The figure shows the methodology
used to prepare the input data needed by VSEM. Notice that the gray dashed line used in some of the boxes represents the road polyline
layer only for visual reference purposes.
etc. By contrast, if the dl value is too small and the working area large, the total number of features in the road network
point layer increases leading to longer computational times.
The same effect occurs when assigning different dl values to diverse parts of the same working area.
The next layer is obtained by calculating the nodes of the
road network polyline layer. On the one hand, nodes are
topological connection points between two or more poly-lines. On the other hand, they may also indicate the begin-ning/ending point of each polyline. All resulting nodes are integrated in the node point layer (Fig. 2).
The next step is the creation of the buffer polygon layer. For each feature of the node point layer we create a buffer, i.e., a zone that defines an area of influence in distance or time units. In our case, buffers define the area of influence of the road network crossroads. The buffer is centred on each of the nodes and its radius has to be slightly higher than dl. To determine which features of the road network point layer fall into the area of influence of a buffer we use a spatial join method. The autonumeric buffer value is transferred to the
road network point layer using spatial join criteria.
The third layer divides the working area in zones (zone
polygon layer, Fig. 2). The zonation criteria depend on the
working scale (e.g., villages or neighbourhoods limits), the geographical characteristics of the area (e.g., valleys, rivers, etc.) and operative aspects related to the evacuation design (e.g., priority in the evacuation order, road network hierar-chy, local level of hazard, etc.). How these zones are defined determines the order and the flux direction of the evacuation process. It is possible to generate multiple zonations apply-ing diverse criteria and each of them would correspond to different evacuation scenarios (Fig. 3). In VSEM, the evacu-ation process flux is controlled throughout the design of these zones. Two evacuation types are possible: simultaneously (all zones are evacuated at the same time) or sequential (pri-oritising the evacuation order of the different zones). Once the working area is divided into zones, we assign an auto-numeric value. The auto-auto-numeric value has to be transferred to the road network point layer using spatial join criteria.
Next, it is necessary to add the information concerning the population to be evacuated. Such data may come from two different sources. In many cases, official bodies are able to provide a database of the existing population in specific locations. This information is easily translated into a point layer (locality point layer, Fig. 2) that indicates the num-ber of inhabitants within certain geographical co-ordinates. When working in a more detailed scale, access to the register data of each municipality is required. The information con-cerning the home address of each inhabitant is transferred to an edifice polygon layer and later on to an edifice point
layer (Fig. 2). The latter is generated assigning the value
of inhabitants inside an edifice to the geographic point that corresponds to the centroid of the edifice polygon at the
ed-ifice polygon layer. Finally, all information concerning the
population to be evacuated is transferred by assigning the value of inhabitants at the (x,y) position given by the edifice
point layer and/or locality point layer to the closest feature
(individual point) of the road network point layer (Fig. 4). Figure 5 shows a detailed scale example of the above de-scribed process. Working at such detailed scales, the data-preparation process in the GIS becomes more complex and more time is needed.
Once all the information contained in the different layers (e.g., inhabitants, crossroads, zones, etc.) has been trans-ferred to the road network point layer and stored in the as-sociated alphanumeric attribute table (Table 1), it is exported as a comma delimited text file (Table 1). The file is named
place road.csv, where “place” refers to the name of the
work-ing area. If new information is added to the original GIS data, a new text file has to be exported. Additionally, working with different evacuation scenarios, implies the creation of one in-dependent place road.csv for each of them. Apart from the
place road.csv file, VSEM needs additional information
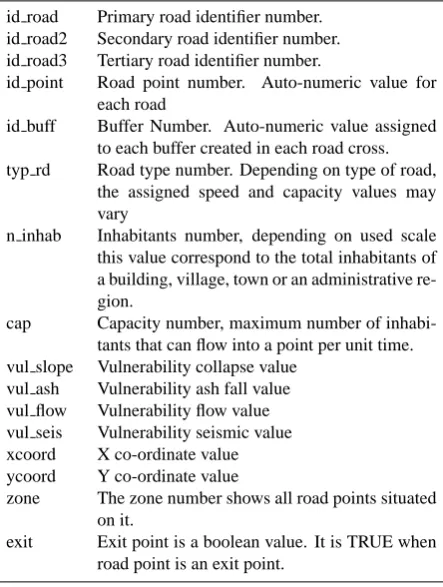
Table 1. Attribute table of road network point layer.
id road Primary road identifier number. id road2 Secondary road identifier number. id road3 Tertiary road identifier number.
id point Road point number. Auto-numeric value for each road
id buff Buffer Number. Auto-numeric value assigned to each buffer created in each road cross. typ rd Road type number. Depending on type of road,
the assigned speed and capacity values may vary
n inhab Inhabitants number, depending on used scale this value correspond to the total inhabitants of a building, village, town or an administrative re-gion.
cap Capacity number, maximum number of inhabi-tants that can flow into a point per unit time. vul slope Vulnerability collapse value
vul ash Vulnerability ash fall value vul flow Vulnerability flow value vul seis Vulnerability seismic value xcoord X co-ordinate value ycoord Y co-ordinate value
zone The zone number shows all road points situated on it.
exit Exit point is a boolean value. It is TRUE when road point is an exit point.
In the configuration file, the following information is indi-cated: type of output file desired; whether the zones evacu-ation sequential model is used or not; the parameters of the lognormal distribution function describing the population be-haviour; the values of the spatial (dl) and temporal discretiza-tion (dt); the parameters of the speed model; list of the max-imum speed limit for each road of the transport network; the priority of the different zones, for its use in the sequential evacuation model; and the panic. When the panic mode is “on”, a value is established as a trigger. If the panic level is reached, all points will evacuate then simultaneously.
The temporal discretization dt is defined as the minimum time required to move from a point of road network point
layer to the next one. The definition of the temporal
dis-cretization (dt) depends on dl and the maximum velocity that can be reached in the road network. In order to avoid spa-tial aliasing (displacement of population to distances greater than the gap between two next points), dt has to be less than the time required to cover the spatial discretization distance
dl at the maximum velocity of the road network.
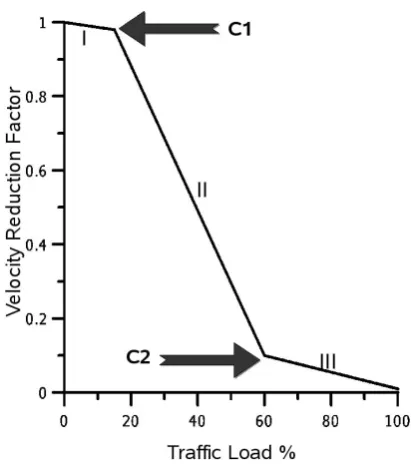
Regarding the speed model, it is common to use a linear approximation in three different intervals. The slopes and in-tersection points can be chosen independently (Fig. 6). The first section corresponds to the high velocity zone. In the case of low traffic densities, the velocity in the road is close to its
Fig. 3. Examples of different evacuation scenarios depending on the
zonation criteria. (A) Here only two exit points (big black arrows) are established. The evacuation flow is similar to the behaviour of daily traffic. Almost the entire population is evacuated through a north-east point. This scenario is more complex and requires a higher evacuation time. (B) This scenario uses different exit points, the nearest inhabited areas. It facilitates the process of evacuation and reduces the evacuation times.
Fig. 4. (A) Information transfer from the buffer polygon layer, zone
polygon layer, edifice point layer and locality point layer to the road network point layer. For this, two methodologies are applied: 1) spatial join, we detect which features of the road network point layer are included in the different features of the buffer and zone polygon layers, and transfer the contained information in the attribute tables of both polygon layers to the one of the point layer; 2) join by prox-imity, we calculate the shortest distance (usingx,ycoordinates) be-tween features of the locality and/or edifice point layers and those of the road network point layer; then, we transfer the inhabitants value to the features of the road network point layer. One point of the road network point layer, can store inhabitants from different edifices or localities.
maximum. The second stretch decreases quickly with the traffic and the third one corresponds to the saturated road in which velocity may drop to zero. It is possible to apply more complex functions but this would imply a considerably in-crease of the calculation time since the function is estimated in each iteration.
Table 2. Example of output file. For each zone, all data are updated every minute. An analysis can be done in one zone or throughout the
work area using the “glob” data file.
“Time” “Z048” “Z421” “Z002” “Z265” “Z509” “Z389” “Z535” “Z122” “Z256” “Glob”
0.00 0 0 0 0 0 0 0 0 0 0
0.02 31 131 0 0 79 0 0 0 0 241
0.03 17 107 0 0 40 0 0 0 0 121
0.05 3 82 0 0 29 0 0 0 0 114
0.07 0 60 0 0 5 0 0 0 0 65
0.08 0 43 0 0 0 0 0 0 0 43
0.10 0 22 0 0 0 0 0 0 0 22
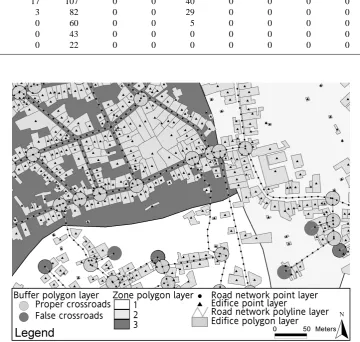
Fig. 5. Example of VSEM application using a detailed scale. The zone polygon layer is represented by three different gray tones; the
buffer polyline layer is represented with two different colours, gray is a proper crossroads and dark gray is a false crossroads (end-road, superimposed, etc.). The edifice polygon layer has been transformed into a point layer (black triangles) using the centroid of each polygon. The road network polyline layer is transformed into a point layer (black circles) using a spatial homogeneous discretization.
formation directly related to the road network and the pop-ulation (i.e. “id road”; “id road2”; “id road3”; “id point”; “id buff”, “typ rd”; “n inhab”, “xcoord” and “ycoord”) is fixed. The rest of the fields (i.e. “cap”, “vul slope”, “vul ash”, “vul flow” , “vul seis”, “zone”) may vary de-pending on the chosen scenario. In the place.cfg file all fields are variable except dl and dt.
2.4 Running VSEM
The code constructs a set of p road objects from the infor-mation provided by the file place road.csv. These p road objects contain all the information exported from the GIS
Fig. 6. During the evacuation process, the road capacity (traffic
load) and the maximum speed are the parameters that determine the final speed reached in one point at each iteration. To represent this behaviour, three sections are used; I represent the maximum speed values with a low traffic density (0–20% traffic load); II simulates an abrupt fall of the speed value due to high density traffic conditions (20–60% traffic load); III represent the minimum speed values due to high traffic load values. When the load traffic is 100%, the speed value is 0. The change between one section to other is represented by two load point, C1 and C2. When the traffic load reach these values, the speed function changes.
To defining the evacuation route table, we have developed a procedure that uses a First Input-First Output (FIFO) queue (Fig. 8). All data stored temporarily in the FIFO are used to create the evacuation route table, which allows to assign in which direction the population has to evacuate.
The evacuation process starts with the EVACUA() function that controls the main loop of VSEM. For each iteration it: i) increments the time, ii) calls CELL() function for all p road objects, iii) calls UPDATE() function to transfer people from a p road object to the next one and updates the output files iv) and ends the evacuation process when all population has been evacuated or there are no more arrivals at the check point after a time period twice the evacuation time.
Once the evacuation process has begun, the most impor-tant function is the CELL() (Fig. 9a). For each p road object, this function calculates: i) inhabitants at home, ii) inhabitants waiting to be evacuated, iii) inhabitants flowing, iv) velocity at this object, v) limbo (temporary variable that stores the fraction of persons that may be potentially evacuated to the next point), vi) step counter and vii) transfer flag status.
Fig. 7. Operating block diagram of VSEM. The program reads the
input data and calculates the evacuation routes. From the calculated routes, each object p-road knows where to evacuate. Then, VSEM starts the simulation of the evacuation controlled by the EVACU-ATE() function. All computing procedures are performed by the CELL() and UPDATE() functions. The simulation ends when ev-eryone is evacuated or when there are no more arrivals at the check point during a time period or when the double evacuation time elapses without the occurrence of new arrivals at the check point.
Fig. 8. FIFO queue diagram. First, VSEM sorts all p road objects
and looks for exit points. Second, the FIFO queue is built and the first value assigned is the id number of the road where the exit point is situated. Third, all p road objects belonging to the same road are processed from the exit point backwards to find the crossroads (buffers). In each crossroads, the function analyses how many roads merge into it and stores the road id numbers in the evacuation route table and the FIFO queue. When all p road objects of a single road have been processed and no other crossroads have been detected, the search starts again with the next road id number in the FIFO queue. The process go on until FIFO queue is empty.
Fig. 9. (A) VSEM evacuation process diagram. The CELL()
func-tion is the most important in the evacuafunc-tion model. In each itera-tion, for all p road objects, the CELL() function: 1) computes how many people moves from one status to other (from home to wait-ing, from waiting to flowing), 2) determines the flux velocity, 3) fixes the number of step (iterations) needed to cover the distance between two p road objects, 4) estimates the fraction of people that will be transferred from one p road object to the other and stores in a temporal variable (limbo). The people displacement is controlled by the UPDATE() function, which 1) analyses the flag status and transfers people if the level of occupancy of the p road object is less than the total limit of its capacity (see text for more details) and 2) stores, every few iterations, the obtained data in the output files.
(B) Sketch of the transfer process (see text for more details).
entrance of people when its occupation is less than its ca-pacity (TRUE). Once achieved 100% of caca-pacity, the p road object gets blocked and does not admit further incoming per-sons (FALSE).
In order to preserve the stability of the methodology, we have to avoid the first processed p road objects having prior-ity over the subsequent ones. Therefore, we have created the temporal buffer, limbo, which stores the number of persons to be transfer from a p road object to the next one. The in-formation contained in limbo is transferred according to the flags, once all p road objects have been individually calcu-lated (function UPDATE()).
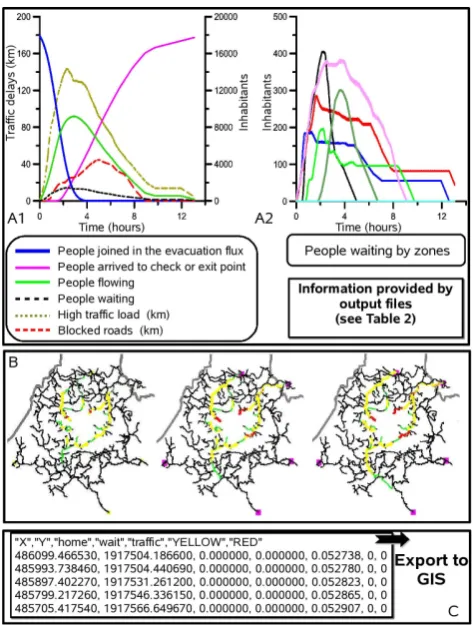
Fig. 10. Example of VSEM output files. (A) Output data that may
be represented as plots. A1 is a data compiled plot and represents all output parameters obtained for the evacuation area. A2 is waiting status by zones. All output parameters can be plotted by zones or by working area. (B) Graphical output of VSEM. In these three figures the traffic delay evolution is represented (see text for more details).
(C) GIS text output file. This file can be imported directly into the
GIS.
2.5 VSEM output data
The output data may be divided in three main groups: 1) data that show the evolution of a certain set of variables during the process and that are represented as plots (Fig. 10a); 2) images that show the situation of the road network at regular time intervals (Fig. 10b); and 3) data that show, in regular intervals, the evolution of the evacuation for all points of the road network (Fig. 10c).
Fig. 11. Municipalities located near the El Chich´on volcano.
The second type of results involves images of the evacu-ation zone that can be generated at a specific time interval fixed by the user (1, 5, 10 min) (Fig. 10b). These may show the information of any of the above mentioned variables in a visual way. In order to track the evolution of the evacuation process related to the traffic conditions, we have defined a variable equivalent to a traditional traffic light. The p road object colour palette is red (when it is at 100% or more of its capacity), yellow (at 40–100%) or green (less than 40%).
The last sets of files are text files that record the infor-mation concerning the evacuation process for each p road object (Fig. 10c). The information fields are: co-ordinatesx
andy, inhabitants at home, inhabitants waiting to be evac-uated, inhabitants being moved, and capacity percentage value. This file can be directly imported to the GIS through-out thex-yco-ordinates and are available every a certain time interval defined by the user. A recommend time frame is 15 min because this process is quite time consuming. 2.6 Case study: El Chich´on volcano
The El Chich´on volcano, located in Chiapas (Mexico) (Fig. 12) became notorious because of its deadly eruption in 1982 that claimed thousands of lives. Since 2007, Mexi-can Civil Defense, together with different research groups, is developing a new Emergency Plan for the area.
2.7 Volcano overview
The El Chich´on volcano (17◦2103800N, 93◦1302800W) is lo-cated in the northern Region of Chiapas state (Mexico) between the municipalities of Chapultenango, Ostuac´an, Pichucalco and Francisco Le´on (Fig. 11). According to CONAPO (2006), the total population of these areas amounts to 59 553 inhabitants.
The 1982 eruption at the El Chich´on volcano did not sur-prise the inhabitants of the area. During several months
Fig. 12. Location map of El Chich´on volcano. The evacuation area
is obtained from impact scenarios simulated by VORIS (Felpeto et al., 2007) plus a security zone of 3.5 km. The number of people liv-ing in the evacuated area is 17 918. The arrival points are different towns located 30 km far away from the volcano (Juarez, Teapa, Rin-con Chamula, Chicoasen and Raudales Malpaso). The working area has been divided in nine zones. Since this is not an example in a de-tailed scale, the information concerning the population is contained in a localities point layer.
before the first eruption, reports about the occurrence of tremors, strange noise and explosions were repeatedly com-municated to the local authorities (Mac´ıas, 2005) but were not transmitted to the scientific community (De la Cruz-Reyna and Mart´ın del Pozzo, 2009). The first phase of the eruption started on the night of 28 March, partially destroy-ing the central dome and generatdestroy-ing a plinian eruption with a 27 km high column. In the absence of a volcanic Emergency Plan, this first phase terrified the population and prompted them to auto-evacuate the affected areas and to run away to the most remote villages.
The intervention of the army and the activation of the Army Emergency Plan took place the day after (29 March), cordoning off the area and evacuating the remaining popula-tion. This delay was mainly due to the characteristics of the Emergency Plan which was primarily based on the airlift-ing of troops, action impossible to carry out due to the ashes generated during the eruption. Currently, the Army plan has been adapted to volcanic emergencies based on that experi-ence. (De la Cruz-Reyna and Mart´ın del Pozzo, 2009).
not shared by all involved scientific groups, but difficulties in communication and the strong influence of the senior scien-tist made impossible a proper information exchange (De la Cruz-Reyna and Mart´ın del Pozzo, 2009; Tilling, 2009). On the night of 3 April, a violent phreatomagmatic explosion took place destroying the remains of the central dome and generating pyroclastic flows that devastated nine villages lo-cated in a 9 km radius area. The authorities estimated over 2000 fatalities (Mac´ıas, 2005).
2.8 Defining the impact and evacuation scenarios
Regardless of the evacuation is ordered or spontaneous, the VSEM calculates the evacuation time depending on when it has started. Previously, the volcanologists team must provide expected impact maps where the area to evacuate is defined. Evacuation can also be simulated in stages according to the volcanic eruption forecast. The El Chich´on volcano Emer-gency Plan under development considers as starting point the well-documented eruption of 1982 (Mac´ıas et al., 1997, 2004; Armienta et al., 2002; De la Cruz-Reyna and Mart´ın del Pozzo, 2009; Tilling, 2009). In order to simulate the possible impact scenarios, we have applied VORIS, a code that simulates eruption scenarios from the information of past eruptions and the geology of the area (Felpeto et al., 2007, http://www.gvb-csic.es/GVB/VORIS/VORIS.htm). The val-ues for the parameters defining the eruptive scenario are listed in Table 3.
Once different impact scenarios have been determined, the area of highest hazard is defined. However, due to future eruption parameters are unknown, hazard simulation mod-els cannot accurately represent the impact zone. Beyond the limit of this area, we add an extra safety margin of 3.5 km. All villages and cities contained in the resultant area have to be evacuated. In this example, all the population located in the impact zone (17 918 inhabitants) is evacuated to neigh-bouring safe areas.
Once selected where to move the evacuated population, we defined the zones distribution of the working area accord-ing to the considerations mentioned in Sect. 2.3. At the end, the working area was divided in 9 zones being the destina-tions Juarez, Teapa, Rincon Chamula, Chicoasen and Rau-dales Malpaso located at 30 km from the volcano (Fig. 12).
Mexico Civil Protection offers all the necessary resources for evacuation, however it is necessary to define the evacua-tion scenario using collective transports (e.g., buses). Since collective transports move slower than cars, they tend to re-duce the saturation level of the roads. In order to simulate the use of collective transport, we impose in VSEM a reduc-tion of the velocity and varied the capacity of the different roads. In order to compare the results obtained we ran two simulations: one with high road capacity and another with normal one. The vulnerabilities were not used in the El Chi-chon example due to the lack of vulnerability data of road transport.
Fig. 13. VSEM results. In all simulations zones, population
be-haviour model and speed model are equal. Only two elements have been varied: 1) the road capacity (in the road network point layer) Plots (A) and (C) are simulations with high capacity values while
(B) and (D) have low capacity value. The high capacity value
rep-resents the use of collective transport (fewer vehicles, no traffic de-lays, etc.); 2) the inhabitants of some localities have been moved to others due to its difficult access the road (track or path). The evac-uation time has been assessed with the entire population within its geographic origin (A) and (B), and displacing the population living in areas of difficult access (C) and (D). (For a better visualization of the results, the reader is referred to the web version of this article).
In the case of volcanoes, evacuations have to take place be-fore the eruption starts (preventive evacuation). In our exam-ple, we consider an early warning, i.e., the time for the evac-uation beginning is fixed. As mentioned in previous section, early warnings allow the population to be prepared in ad-vance, reducing the incorporation time. We assume that the simulation begins once the collective transports have reached the villages or cities. The mean incorporation time has been established to be 1 h and 30 min considering all possible dif-ficulties that may occur during these situations.
2.9 Results
Table 3. Parameters used for the design of the hazard scenarios simulated with VORIS model (Felpeto et al., 2007; http://www.gvb-csic.es/
GVB/VORIS/VORIS.htm).
Pyroclastic flow. Energy Cone Model
Vent (x,y) Collapse Height 1 Collapse Height 2 Collapse Height 3 475567.0 1919435.0 300 m 400 m 500 m
Function used to calculate collapse angle:α=−log(hc/1300)/0.116 Ash fall
Velocity (m/s) Angle (◦)(Wind direction. From) Height (m) Low elevation wind 2.0 10.0 0.0 Medium elevation wind 4.0 30.0 2000.0 High elevation Wind 6.0 40.0 6000.0
x,xvent x= 475567.0y= 1919435.0 Diffusivity=6000 m2/s Size ash8 0.0 (equivalent to 1 mm) Density=1200 kg/m3 Deviation ash8 1.5 Column shape A=20 Column Height 6000 m Volume=0.5 km3 Gravitational flows
Maximum distance (cell) 100 000 Path/vent number 10 000 Vent number 20 Critic Height 10
along 70 km of the road network and 25 km of roads area completely blocked (max. values). In both scenarios, there is a certain group of people (3486) who delay the whole evacu-ation process. This group corresponds to people who live in small, remote villages with a single access route that tend to be a path with quite reduced velocity throughout no transport vehicles may circulate. To evaluate the effect of this group on the evacuation time, we ran two additional simulations. Both are equivalent to the previous ones, but in this case, the population has been located in localities of faster access. The results show an evacuation time reduction of 2 h in the first case (Fig. 13c) ant 1 h in the second one (Fig. 13d). In the literature related to the 1982 eruption of El Chichon volcano (Mac´ıas et al., 1997; Mac´ıas, 2005; De la Cruz-Reyna and Mart´ın del Pozzo, 2009; Tilling, 2009), the evacuation was carried out by the local population without receiving any of-ficial warning. The evacuation began on the night of 28th and continued throughout the 29th, although there is much confusion about it (Tilling, 2009). In this work we simulated an ordered evacuation. The main objective was to assess the minimal evacuation time needed to evacuate the impact zone and to test the VSEM. The results from the 1982 evacuation and the proposed scenario are not directly compared. Fur-thermore, the current population and socio-economic char-acteristics have changed over the past 27 years.
If we consider the actual time needed to cover the dis-tances between the evacuated villages and the destination points, it is evident that results are satisfactory. VSEM al-lows the definition of maximum and minimum evacuation times for the different proposed scenarios. These data per-mit the authorities to know how much time is required to
evacuate the threatened area. This is very important since the accuracy and reliability of volcano forecasting generally improves as the time of the eruption approaches.
3 Summary and conclusions
During recent years, numerous software packages have been developed to evaluate volcanic risk and support volcanic cri-sis management: probabilistic analycri-sis of future eruptions, hazard and risk maps, event trees, etc. However, there has been little or no improvement in tools that may help Civil De-fense officials to prepare the Emergency Plans. The Variable Scale Evacuation Model (VSEM) presented in this paper can be used to optimise the evacuation process of a certain area if the required information is available.
The VSEM only needs the road network map and the spa-tial population distribution to assess the evacuation time. To-day, this information can be obtained with simple tools using a GPS installed in a car or scanning a traditional map. The spatial population is generally provided by the official statis-tical agencies and local authorities.
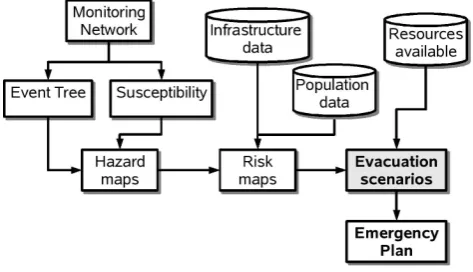
Fig. 14. Current management of volcanic risk. VSEM is a new tool
to improve the Emergency Plans. It is part of a software package that analyse the volcanic processes from an objective point of view.
To run VSEM, it is necessary to have the geographical and administrative information of the area and the expected im-pact scenarios. Crossing over all this information helps to: i) define the area and number of persons to be evacuated, ii) establish the different evacuation scenarios and iii) evaluate the diverse emergency strategies to be followed. The quality of the results obtained depends mainly on the quality of the input data, as well as on the possibility of doing additional fieldwork to check the characteristics of the road network and the related vulnerability.
In general, the available databases (population, road net-work, etc.) are not optimised to be used for emergency man-agement. However, with support from the administrative bodies, crises management (not only volcanic ones) could be notably improved. Additionally, VSEM enables the sim-ulation of the behaviour of the popsim-ulation through specific distribution functions. Nonetheless, an important problem is the lack of information concerning the behaviour of the population in case of an emergency. In general, during an emergency, the primary concern of Civil Defense and related officials (police, fire brigade, etc.) is to sort out and manage-ment the ongoing crisis situation, and not to collect informa-tion on the human of the people affected. Therefore, a refined understanding of the population behaviour is very difficult to achieve and requires sociological studies of the inhabitants involved during emergency situations.
The model presented here is designed to be easily adapted to any working group regardless of the software infrastruc-ture used. It does not require high computing capacity and is executable in any modern personal computer. In the future, VSEM should be included in a set of tools for the integrated management of volcanic risk, such that, together with sys-tematic volcano-monitoring data, it would be possible to: 1) get information about potential eruptive vents (susceptibility maps) and eruptive mechanisms (event trees); 2) generate the expected eruption and impact scenarios that define a poten-tially affected area; and 3) combined with the population and infrastructure data, define the evacuation scenarios (Fig. 14).
Acknowledgements. This research has been funded by the CSIC
(2004-30E438), MCI TENERISK (CGL2006-1383) and MIC (CGL 2008-03874/BTE) grants and the bilateral UNAM (Mexico) – CSIC (Spain) program . We warmly thank all the participants in the exercise to assess the El Chich´on Emergency Plan carried out by the Civil Protection of the Chiapas State, Mexico, and the UNI-CACH, University of Chiapas, Mexico. Special thanks are given to S. Ramos, from the Earth Science Laboratory of UNICACH, for inviting us to take part in the exercise. Authors want to thank A. Geyer for her contribution to prepare the manuscript. We greatly appreciate the careful reviews of R. Tilling, R. Blong, and S. De la Cruz-Reyna and theirs useful comments and suggestions.
Edited by: J. Marti
Reviewed by: R. Blong and R. I. Tilling
References
Armienta, A., De la Cruz-Reyna, S., Ramos, S., Mac´ıas, J. L., Aguayo A., Ceniceros, N., and Cruz, O.: Veinte a˜nos de mon-itoreo geoqu´ımico de la laguna crat´erica del Chich´on. Conmem-oraci´on de los 20 A˜nos de la erupci´on del Chich´on, 1982–2002, s/f. Chiapas, M´exico, 418–419, 2002.
Blong, R.: Volcanic hazard and risk management, in: Encyclopedia of Volcanoes, edited by: Sigurdsson, H., Houghton, B., Rymer, H., Stix, J., and McNutt, S., Academic Press, San Francisco, 1215–1227, 2000.
Blong, R.: Building damage in Rabaul, Papua New Guinea, 1994, Bull. of Volcanol., 65(1), 43–54, 2003.
Blong, R. J. and McKee, C.: The Rabaul eruption 1994: Destruc-tion of a Town, Research Centre Report, Macquarie University, Sydney, 52 pp., 1995.
Center for Transportation Analysis Research Brief (CTA): Oak Ridge Evacuation Modeling System (OREMS), online available at: http://www-cta.ornl.gov/cta/One Pagers/OREMS.pdf, 2008. Chakraborty, J., Tobin, G. A., and Montz, B. E.: Population
evacu-ation: assessing spatial variability in geophysical risk and social vulnerability to natural hazards, Natural Hazards Rev., 6(1), 23– 33, 2005.
Clymer, J. R.: Systems analysis using simulation and markov mod-els. Prentice-Hall International Editions, USA, 352 pp., 1990. CONAPO, Consejo Nacional de Poblaci´on: ´Indices de
marginaci´on, 2005. Consejo Nacional de Poblaci´on, M´exico D. F., M´exico, 336 pp., 2006.
Cova, T. J. and Church, R. L.: Modelling community evacuation vulnerability using GIS; Geogr. Inf. Sci., 11(8), 763–784, 1997. Cova, T. J. and Johnson, J. P.: A network flow model for lane-based
evacuation routing, Transport. Res. A, 37, 579–604, 2003. Dash, N. and Gladwin, H.: Evacuation decision making and
behav-ioral responses: individual and household, Nat. Hazards Rev., 8(3), 69–77, 2007.
De la Cruz-Reyna, S. and Mart´ın del Pozzo, L. M.: The 1982 erup-tion of El Chich´on volcano, Mexico: Eyewitness of the disaster, Geofisica Int., 48(1), 21–31, 2009.
Evans, H., Hastings, N., and Peacock, J. B.: Statistical Distributions (3rd. ed.), John Wiley and Sons Inc. (ed), Wiley Interscience Publication, New York, USA, 248 pp., 2000.
Geothermal Research, 166, 106–116, 2007.
Guanquan, Ch., Jinhua, S., Qingsong, W., and Sining, Ch.: Simula-tion study on the effect of pre-evacuaSimula-tion time and exit width on evacuation, Chinese Sci. Bull., 51(11), 1381—1388, 2006. Kernighan, B. W. and Ritchie, D. M.: The C Programming
Lan-guage (1st ed.). Prentice Hall, Inc. Englewood Cliffs, NJ, USA, 228 pp., 1978.
Lipman, P. W. and Mullineaux, D. R.: The 1980 eruptions of Mount St. Helens, US Geological Survey Professional Paper, Washing-ton, 844 pp., 1981.
Lu, Q., Huang, Y., and Shekhar, S.: Evacuation Planning: A Capac-ity Constrained Routing Approach, in: Lecture Notes in Com-puter Science, edited by: Chen, H., Miranda, R., Zeng, D. D., Demchak, C., and Madhusudan, T., Proceeding from the First NSF/NIJ Symposium, ISI, 2–3 June, Tucson, AZ, USA, 392, 111–125, 2003.
Mac´ıas, J. L.: Geolog´ıa e historia eruptiva de algunos de los grandes volcanes activos de M´exico, Bolet´ın de la Sociedad Geol´ogica Mexicana, Tomo LVII, n´um, 3, 379–424, 2005.
Mac´ıas, J. L., Capra, L., Scott, K. M., Esp´ındola, J. M., Garc´ıa-Palomo, A., and Costa, J. E.: The 26 May 1982 breakout flows derived from failure of volcanic dam at El Chich´on, Chiapas, Mexico, Geological Society of American Bulletin, 116, 233– 246, 2004.
Mac´ıas, J. L., Sheridan, M. F., and Esp´ındola, J. M.: Reappraisal of the 1982 eruptions of El Chich´on Volcano, Chiapas, Mexico: New data from proximal deposits, Bull. Volcanol., 58, 459–471, 1997.
Marrero, J. M.: Modelo de evacuaci´on a escala variable. Una her-ramienta para la gesti´on de crisis volc´anicas. Aplicaci´on a los volcanes Teide, Chich´on y Popocat´epetl. Tesis doctoral, Depar-tamento de Edafolog´ıa y Geolog´ıa, Factuldad de Biolog´ıa, Uni-versidad de La Laguna, S/C. de Tenerife, Espa˜na, 288 pp., 2009. Marzocchi, W. and Woo, G.: Probabilistic eruption forecasting and the call for an evacuation, Geophys. Res. Lett., 34, 1–4, doi:10.1029/2007GL031922, 2007.
Marzocchi, W., Sandri, L., Selva, J., and Woo, G.: Real time eruption forecasting during a volcanic crisis: BET EF and the MESIMEX experiment, Geophys. Res., 9, 04347, doi:1607-7962/gra/EGU2007-A-04347, 2007.
Mei, B.: Development of trip generation models of hurricane evac-uation. Tesis doctoral. The Department of Civil and Environmen-tal Engineering, Louisiana State University, Louisiana, USA, 114 pp., 2002.
Newhall, C. G. and Dzurisin, D.: Historical unrest at large calderas of the world, US Geological Survey Bulletin, 1855, 1108 pp., 1988.
Newhall, C. G. and Hoblitt, R. P.: Constructing event trees for vol-canic crises, Bull. Volcanol., 64, 3–20, 2002.
Newhall, C. G. and Self, S.: The Volcanic Explosivity Index (VEI): An estimate of explosive magnitude for historical volcanism, J. Geophys. Res., 87(C2), 1231–1238, 1982.
Newhall, C. G. and Self, S.: The Volcanic Explosivity Index (VEI): An estimate of explosive magnitude for historical volcanism, J. Geophys. Res., 87(C2), 1231–1238, 1982.
Ortiz, R., Moreno, H., Garc´ıa, A., Fuentealba, G., Pe˜na, P., and T´arraga, M.: Villarrica volcano (Chile): characteristics of the volcanic tremor and forecasting of small explosions by means of a material failure method, J. Volcanol. Geoth. Res., 128, 247–
259, 2003.
Post, Buckley, Schuh & Jerningan Inc.: Transportation Anal-ysis. East Central Florida Regional Planning Council 1999 Hurricane Evacuation Study. http://www.ecfrpc.org/ getattachment/17177c60-2e78-474d-a957-aa6fe598b44c/ Transportation-Analysis.aspx?disposition=attachment, 70 pp., 1999.
Sigurdsson, H.: Introduction, in: Encyclopedia of Volcanoes, edited by: Sigurdsson, H., Houghton, B., Rymer, H., Stix, J., and Mc-Nutt, S., Academic Press, San Francisco, 1–13, 2000.
Small, C. & Naumann, T. R. 2001. The Global Distribution of Hu-man Population and Recent Volcanism. Environmental Hazards, 3: p. 93-109.
Taylor, M. A. P.: The Assessment of the Regional Network Vulnera-bility: The Case Study of The Green Triangle Region, Proceding from the 29th Conference of Australian Institutes of Transport Research (CAITR), 5–7 December, Adelaide, Australia, 18 pp., 2007.
Thierry, P., Stieltjes, L., Kouokam, E., Ngueya, P., and Salley, P. M.: Multi-hazard risk mapping and assessment on an active volcano: the GRINP project at Mount Cameroon, Nat. Hazards, 45(3), 429–456, 2007.
Tilling, R. I.: El Chich´on’s “surprise” eruption in 1982: Lessons for reducing volcano risk, Geof´ısica Internacional, 48(1), 3–19, 2009.
UN General Assembly: International Decade for Natural Disaster Reduction, RES 44/236, in 44th Session of UN General Assem-bly, Resolutions adopted on the reports of the 2d Committe, 161– 162, 1987.
United Nations Disaster Relief Coordinator (UNDRO) and United Nations Educational Scientific and Cultural Organization (UN-ESCO): Volcanic Emergency Management, United Nations, 86 pp., 1985.
United Nations Disaster Relief Office: Natural disasters and vulner-ability analysis. Report of Experts Group Meeting, United Na-tion, 53 pp., 1979.
Vald´es-Gonz´alez, C., De la Cruz Reyna, S., Mart´ınez-Bringas, A., Quass, R., and Guevara-Ortiz, E.: Resumen de la activi-dad del volc´an Popocat´epetl, diciembre 1994 a Mayo 2001, in: Centro Nacional de Prevenci´on de Desastres, Secretar´ıa de la Gobernaci´on, Instituto de Geof´ısica. Las cenizas volc´anicas del Popocat´epetl y sus efectos para la aeronavegaci´on e infraestruc-turas aeroportuaria, CENAPRED, M´exico D. F., M´exico, 21–42, 2001.
Voight, B.: A method for prediction of volcanic eruptions, Nature, 332(10), 125–130, 1988.
Voight, B.: The 1985 Nevado del Ruiz volcano catastrophe: anatomy and retrospection, J. Volcanol. Geoth. Res., 44, 349– 386, 1990.
Witham, C. S.: Volcanic disasters and incidents: A new database, J. Volcanol. Geoth. Res., 148, 191–233, 2005.
Woo, G.: Probabilistic criteria for volcano evacuation decisions, Nat. Hazards, 45(1), 87–97, 2008.