Type of the Paper (Article, Review, Communication, etc.)
Research on the Visualization of Ocean Big Data
Based on the Cite-Space Software
Jiajing Wu 1, Dongning Jia 2,*, Zhiqiang Wei 2, DouXin 1
1 College of Information Science and Engineering, Ocean University of China; Qingdao 266100, China;[email protected](J.W); [email protected](D.X)
2 College of Information Science and Engineering, Ocean University of China; Qingdao 266100, Pilot National Laboratory for Marine Science and Technology; [email protected](D.J); [email protected](Z.W) * Correspondence: [email protected]
Abstract: Ocean big data is the scientific practice of using big data technology in the marine field. Data from satellites, manned spacecraft, space stations, airship, unmanned aerial vehicles, shore-based radar and observation stations, exploration platforms, buoys, underwater gliders, submersibles, and submarine observation networks are seamlessly combined into the ocean’s big data. Increasing numbers of scholars have tried to fully analyze the ocean’s big data. To explore the key research technology knowledge graphs related to ocean big data, articles between 1990 and 2020 were collected from the “Web of Science”. By comparing bibliometric software and using the visualization software Cite-Space, the pivotal literature related to ocean big data, as well as countries, institutions, categories, and keywords, were visualized and recognized. Journal co-citation analysis networks can help determine the national distribution of core journals. Co-citation analysis networks for documents show authors who are influential at key technical levels. Key co-occurrence analysis network keywords can determine research hot spots and research frontiers. The three supporting elements of marine big data research are shown in the co-citation network. These elements are author, institution, and country. By examining the co-occurrence of keywords, the key technology research directions for future marine big data were determined.
Keywords: ocean; big-data; cite-space; co-authorship analysis; co-citation analysis; keywords co-occurrence analysis; visualization
1. Introduction
The term “big data” is becoming increasingly mentioned in our society. As oceans occupy 70% of the earth’s surface area, oceans have entered the era of big data. Today, there are many available marine observation and survey methods, such as offshore mapping, island surveillance, underwater detection, marine fishery operations, marine buoy monitoring, marine scientific research, oil and gas platform environment monitoring, satellite remote sensing monitoring, etc., comprising a very large marine observation monitoring system. This system has accumulated a large amount of marine natural science data, including on-site observations and monitoring data, marine remote sensing data, numerical model data, etc. With the development of the field of big data, more and more researchers have become engaged in the research on big data in the marine field. Document analysis has been used to evaluate the number and content of the scientific literature and to research the topic of one subject or area [1]. A knowledge graph is a visualization analysis of important knowledge and shows this knowledge using key notes connected with other clusters and simple notes [2,3]. This process can mine valuable information in fields such as Computer Science [5–7], Medicine Science [8,9] and Library Science [10]. The main objectives of this study are to identify the current development status, trends, and frontiers of marine big data research, to discover core technologies
and their co-citations, and to find key literature in the field of marine big data research from 1990 to 2020.
2. Materials and Methods
2.1. Data Collection
To guarantee the accuracy and comprehensiveness of the data source, the analysis data for this study are taken from Thomson ISI’s SCI (Web of science in the Science Citation Index Expended Edition). For the advanced search by article, the author set the search mode to “advanced search”
with the following formula: TS = (ocean data technology) and LANGUAGE = (ENGLISH) and DOCUMENT TYPES = (Article OR Review). The Time interval was set to 1990–2019. A total of 1444 records included the authors, titles, keywords, abstracts, and cited references.
2.2. Research Tools
Besides general complex software (Gephi), some bibliometrics software (Cite-Space and SCI2) are also used for this analysis due to their powerful data processing and visualization functions [11,12]. Although both the SCI2 and Cite-Space software provide time analysis and burst detection, co-occurring networks can simultaneously represent time, frequency, and intermediary centrality. However, SCI2 and Gephi put more emphasis on layout algorithms. Therefore, due to its simple operation, powerful functions, and high objectivity, the Cite-Space software developed by Professor Chen Chaomei was selected as the scientific map drawing tool for this study.
A co-word analysis in the Cite-space software provides a choice of 11 types of analysis objects, and different objects will have different graph tables. A co-word analysis can use “Title”, “Abstract”,
“Descriptors”, and “Identifiers” as the sources of words to obtain a knowledge map of citations, co-citations, and co-words. Moreover, the Cite-space software provides clustering and time zone and timeline visualization functions [13,14]. Word co-occurrence involves keywords, authors, cooperative institutions, and countries. The circle size in the co-occurrence diagram represents the frequency of keyword citations. The greater the frequency, the larger the circle. Further, the thickness of the lines represents the relevance of the keywords. The different colors in the figure represent time slices. A purple-colored periphery of the circle represents the strong centrality of that keyword. Emergent words are keywords that appear in large numbers over a period of time. Such keywords can be used as predictions of research fronts.
Cite-space was used as the knowledge graph analysis software for this study. It provides strong support for searching and displaying research hot spots, development trends, and novel phenomena in the field of marine big data, and to clearly understand and determine the development trends of the discipline.
3. Results and Discussion
We imported the downloaded data into Cite-Space, selected the time range from 1990 to 2020, and set each slice as #year 2. We also selected the term sources and the 50 items most commonly referenced or present in each slice. Pruning was done with pathfinder, and visualization was selected as “cluster view”. Then, we selected the node types to analyze the countries, institutions, authors, and keywords of ocean big data technology and obtained a scientific knowledge map indicating the future research status and trends of ocean big data technology.
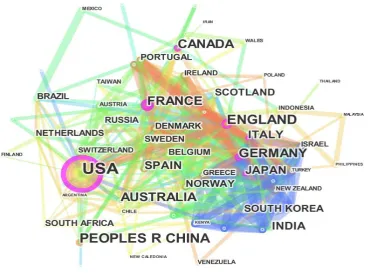
3.1. Country Co-Occurrence Network
themselves, and the thickness of the lines will be different. The thicker the lines, the closer the connections, and the thinner the lines, the fewer the connections. A purple circle is placed around the nodes in the graph, which represents the centrality of the document. The higher the centrality, more likely the explanation will produce an important link with other documents [14].
Figure 1. Country co-occurrence network map.
Based on the overall analysis of the pictures, 1444 English-language documents in the field of marine big data information research were taken from 50 countries. According to the number of times the documents had been attributed, the US literature was cited according to 653 words. China followed closely and was cited 211 times. England, Germany, France, Australia, Canada, Italy, and Japan were cited 179, 133, 130, 122, 101, 85, and 83 times, respectively. Based on the centrality of the article, the United States ranks first with 0.32, followed by France with 0.2. Britain, Germany, Japan, Canada, and Italy were 0.17, 0.17, 0.15, 0.11, and 0.11. China’s centrality was 0.01, ranking 25th.
From this, the countries with a high degree of centrality occupy an important position in the field of ocean big data research. Although our country has been cited frequently, we are not very central. Even though the frequency of article citations in France and the United Kingdom did not exceed those of China, they have obvious advantages in terms of their centrality. China’s low publication centrality also shows, to a certain extent, that differences in language, academic fields, and perspectives are reasons why China publishes related academic results in European and American core journals in the field of ocean big data. Therefore, accelerating the progress of the field, improving the language expression level of researchers, and strengthening international academic exchanges are important ways to improve China’s centrality in the field.
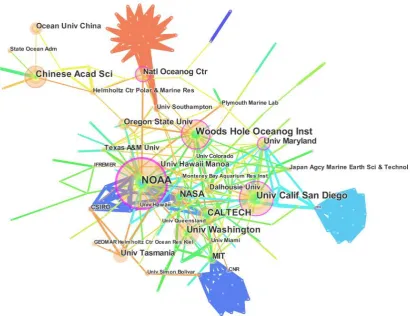
3.2. Institution Co-Occurrence Network
times); 55 times at the Woods Hole Oceanographic Institute; 50 times at the University of Washington; and 46 times at the California Institute of Technology. Among the various institutions, the Ocean University of China ranked 12th, with a total of 25 citations. The University of Chinese Academy of Sciences and Ocean University of China are important representatives of China’s development in this field and have made outstanding contributions in the field of ocean information.
Figure 2. Institutional co-occurrence network map.
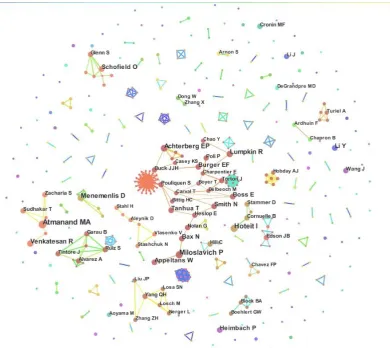
3.3. Institution Co-Occurrence Author Network
Figure 3. Author co-occurrence network map.
4. Research Hot Spots and Analysis
In an article, the keywords usually describe the core content of the article. Usually, keywords also involve the cutting-edge development of related fields. If a word appears frequently in a certain period, it can be concluded that these words reflect the most important content of the research field at that time.
In the Cite-Space software, the statistical principles of metrology can be used to extract the frequency of keywords or topic words involved in a paper based on an analysis of the frequency of vocabulary occurrences and display the keywords or clustering relationships in the form of graphs.
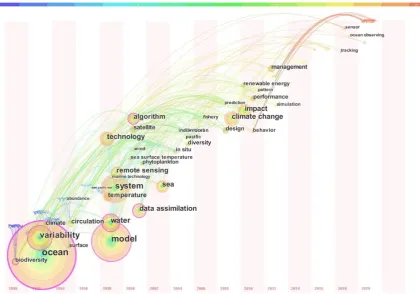
4.1. Key-Word Co-Occurrence Network and Keyword Time Zone Map
Figure 4 illustrates a network of co-keywords in the download documents. Based on the
software analysis results, there are 82 keywords in total, including “ocean” (180 times), “model” (108 times), “system” (78 times), “variability” (74 times), ”water” (57 times), “technology” (45 times),
“climate change” (45 times), “impact” (45 times), “data assimilation” (41 times), “Remote sensing”
Figure 4. Key-word co-occurrence network map.
4.2. Keywords with the Strongest Citation Bursts
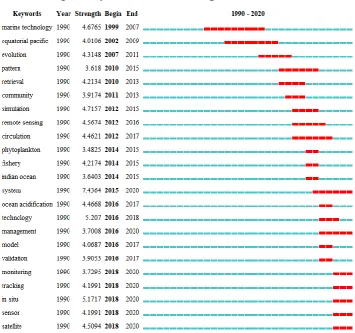
Figure 6 illustrates a network of burst keywords. We can see that the important topics that will continue to appear in the field of marine big data are systems, ocean information management, monitoring, tracking, in situ, sensors, and satellites. Based on the emergence of certain words, we can determine the key technologies in the field of marine big data information technology from 2018 to 2020. Specific technologies will be introduced later in the article.
Figure 6. Keywords with the strongest citation bursts.
4.2.1. Monitoring
backscattering, improve image quality, and provide each illumination distance Information object, as well as access real-time 3D measurement data. The authors in [21] engaged in technological innovations to improve marine monitoring and governance and conducted an experimental analysis of the potential of these new technologies. The passive acoustic monitoring technology proposed in [22] provides a useful alternative to visual monitoring and can be used to monitor marine mammals. The studies in [23,24] propose using mobile devices for monitoring harmful algae. This application uses the Sentinel-3 satellite ocean and land color instrument CyAN application to provide a user-friendly platform for water quality managers to reduce complexity, allowing initial lake assessments to be performed quickly and efficiently.
4.2.2. Tracking
Tuna and tuna-like species can be used as indicators to track mercury in the Southwest Atlantic. Mercury is potentially dangerous due to its high toxicity and tendency to bioaccumulate in the body [25]. The authors in [26] proposed a new autonomous three-dimensional (3-D) underwater trajectory tracking method using a model predictive control (MPC) underwater vehicle (AUV). The work in [27] showed that environmental DNA (eDNA) can be used to detect marine vertebrates. The study in [28] established the distribution of dissolved particulates or isotopes (230Th and 232Th) in samples taken during the process of mixing water along a neutral density surface produced by a BONUS GoodHope (BGH) IPY-GEOTRACES cruise ship in the South Atlantic Ocean Region (36° S-February–March 13° E to 57° S-0° 2008). The distribution of total (dissolved + particles) 232Th was mainly due to inputs from the continental margin. The study in [29] introduced the design of an adaptive trajectory tracking controller based on an improved line-of-sight (LOS). An EDO-based adaptive terminal sliding mode control method for dynamic control can improve tracking performance and convergence speed. In addition, the effect of actuator saturation is weakened by the anti-saturation compensator. A strict theoretical analysis and many simulation studies show that the method has good tracking accuracy, stability, and anti-interference abilities. In recent years, with the development of the marine industry, the marine navigation environment has become more complicated. Some artificial intelligence technologies, such as computer vision, can identify, track, and count sailboats to ensure maritime safety and promote the management of intelligent marine systems [30]. Aquatic animals are an integral part of marine and freshwater ecosystems, and their resilience depends globally on food sustainability and the support of coastal communities and indigenous peoples. However, the global aquatic environment has undergone profound changes due to human activities and environmental changes. These changes are altering the distribution, movement, and survival of aquatic animals in ways that people have little knowledge about. The Ocean Tracking Network (OTN) is a global partnership that can fill this knowledge gap [31]. The subsea flight node is a new type of autonomous underwater vehicle. Using adaptive law, we propose an adaptive trajectory tracking controller with prescribed performance. The simulation example of the undersea flight node system shows that the proposed control scheme can compensate for the effects of general uncertainty and, at the same time, obtain fast transient processes and expected trajectory tracking accuracy [32]. The study in [33] proposed a verification problem for estimating hull damping parameters using computational fluids. The process fluid dynamics simulation results and the Lyapunov direct method controller proved to be applicable to the non-linear dynamic system of the ship.
4.2.3. In Situ
the acquisition of in situ detection can thus be achieved [34]. The work in [35] noted that this type of in situ detection is different from other in situ detection methods. In the 1960s, the United States
scientific discovery ship “Discovery” found high-temperature brine and abyss hydrothermal poly metallic soft mud in the Red Sea, which opened the door to in situ detections of the sea floor [36]. In situ detection can not only obtain a large amount of deep-sea hydrothermal oil tank information but can also truly reflect the real-time data of the deep sea. These data can also be used for a real-time dynamic display. In situ exploration is a major breakthrough in traditional oceanographic research, as well as a breakthrough in the study of deep-sea organisms and the surrounding ecological environment. At the same time, in situ exploration has greatly advanced marine resource exploration, marine environmental financial control, marine scientific research, and sustainable economic development. Recently, Dr. Zhang Xin, of the Institute of Oceanology of the Chinese Academy of Sciences, was the first to cooperate with the United States MBARI (Monterey Bay Aquarium Research Institute) to successfully develop a deep-sea methane in situ detection system based on a remotely operated vehicle (ROV) cable robot. The research results of this exploration have recently been published in Geophysical Research Letters 1 and were reported and reviewed simultaneously by Nature 2 and Science 3. Using this technology, researchers across the world, for the first time, have access to the true in situ concentrations of methane in deep-sea sediments, with available results that are 10–20 times better than the results of traditional sampling tests. Moreover, methane exists in a large amount in deep sea sediments. At the same time, this technology can also obtain a variety of marine chemical parameters in situ, such as dissolved hydrogen sulfide gas, pH value, and sulfate quality [36].
4.2.4. Sensors
Sensors are increasingly used in the marine field. Fiber optic sensors can measure seawater salinity. High-sensitivity temperature sensors based on hollow microspheres can be used to measure ocean temperature. Experiments using different hollow parameters can be used to obtain sensor parameters versus temperature. As for the effect of sensitivity [37], the study in [38] explored the function of a geostationary satellite ocean color sensor to detect the chemical properties of the chlorophyll of marine life on earth. The work in [39] noted that coastal and ocean acidification can change marine biogeochemistry and cause economic and cultural losses. Existing integrated glider peace sensor systems are used for pH ocean sampling throughout coastal waters. Floating wireless sensor networks present unique communication barriers. Compared with other designs, hemispherical antennas have the advantages of higher efficiency and a greater propagation range. The results show that a floating hemispherical antenna can be successfully deployed and used in coastal wireless sensor network applications [40]. The study in [41] mentioned that the real-time inversion of the ocean wave spectrum and elevation vascular motion sensors have important practical significance but are still in the development stage. The Kalman filtering method has the advantages of real-time estimation, reduced costs, and easy implementation. To date, several algorithms for retrieving cyanophycocyanin (PC) from the ocean have proposed to use color sensors for inland waters, all of which are considered reliable models [42]. As an important means for multi-dimensional observations of the ocean, the Ocean Sensor Network (OSN) can meet the needs of large-scale multi-factor comprehensive information observations of the marine environment. However, due to the multipath effect, the signal is blocked by waves, and unintentional or malicious attack abnormalities occur frequently and inevitably, which directly reduces the accuracy of the performance positioning. Therefore, improving the positioning accuracy measurements in the presence of outliers is a key issue that needs to be urgently addressed in the OSN [43].
4.2.5. Satellites
our ability to monitor the chemistry of marine carbonates has become an urgent task [45]. We must fully explore the use of satellite earth observations as an option for the routine observations of surface ocean carbonate chemistry. The literature demonstrates the applicability of using empirical algorithms to calculate total alkalinity (AT) and total alkalinity. Dissolved inorganic carbon (CT), evaluation satellites, in situ interpolation, and climatology datasets can be used to reproduce the broad spatial patterns of these two variables. For performance [46], the study in [47] noted a comparison of many actual voyages collected from satellite automatic identification system data and attempted a statistical verification of voyage simulation models. The verification results show that the simulation results for navigation in the North Pacific and North Atlantic are similar to those of actual navigation. The use of new satellite ocean color data products and improved algorithms can fill areas that are physically and ecologically important in the ocean, which include world-famous coral reefs, seagrasses, and fisheries [48]. The study in [49] introduced the use of marine satellite passive microwave observations to enable inversion research of the TC surface pressure field and proposed a new inversion algorithm. The test results show that this method can estimate the surface pressure field of a building. The work in [50] studied the selection of interpolation parameters in global and Mediterranean SLA products. Studies have shown that the number of eddies detected in the SLA map exceeds that of the products in the Mediterranean region along the satellite track. The study in [51] proposed a hybrid sea surface temperature (SST) algorithm to analyze the regression process of the incremental value between the brightness and temperature observed by satellites. The work in [52] focuses on mesoscale and submesoscale processes, such as coastal currents and river plumes, and how they affect sedimentary dynamics and basin spatial scales. A new method of numerical simulation combining observational data was developed to combine the satellite measurements of suspended sediment with the velocity field obtained from a numerical ocean model to obtain estimates of the sediment flux. The numerical deviation of the flux is then calculated. Marine color satellite remote sensing reflectance data using bio-optical algorithms can also be used to retrieve the biogeochemical characteristics of the ocean [53].
5. Conclusions
In this article, we introduced and applied the scientific information visualization software Cite-Space. Based on 1444 research articles on ocean big data technology in the web of science, we used atlas research methods for scientific knowledge to analyze marine big data information. A pioneering information system in the field, as well as theoretical research methods, were used to perform a quantitative statistical analysis, fully showing the basic situation and development technology of the marine big data information field, including the distribution of countries, institutions, major authors, research hotspots, and emerging issues.
A. This study Revealed the Distribution Situation of Big Ocean Data Research between Countries, Institutions, and Authors
• American literature is the most frequently cited, followed by studies from China, the United Kingdom, Germany, and France. China ranks lower in citation centrality. In the future, we need to improve Chinese citation centrality in language, communication, culture, and technology.
• The University of the Chinese Academy of Sciences and the Ocean University of China are the major marine big data research institutions in China, ranking sixth and twelfth in the world, respectively.
• Of these 1444 documents, Atmanand, Malayath Aravindakshan, Hoteit I, Miloslavich Patricia, Achterberg, and Eric P have a higher volume of posts, and the frequency of their cooperation is also among the top four.
B. This study Defined Research Hot Spots
• Monitoring: Marine monitoring is widely used in the marine field, including “hybrid”
environment monitoring.
• Tracking: Ocean tracking can determine ocean information, tuna can be used as an indicator for tracking mercury in the Atlantic Ocean, existing underwater AUVs can track underwater trajectories, and ocean tracking networks can help people understand the distribution of aquatic animals.
• In situ: The principles and application advantages of in situ marine detection and the research progress of in situ detection in China are introduced.
• Sensor: Optical fiber sensors used in the ocean can measure the salinity of seawater, marine color sensors can be used to detect the chemical characteristics of chlorophyll in marine life, AUVs with integrated sensor systems can sample ocean pH, and the Ocean Sensor Network (OSN) can provide the necessary comprehensive information to observe the marine environment.
• Satellite: Ocean satellites can make up for the shortcomings of ocean observations. Satellite ocean observations can be used to observe the surface ocean’s carbonate chemistry. The passive microwave observations of ocean satellites can be used to perform inversion research on TC surface pressure fields and perform an inversion algorithm. In this study, the algorithm was improved by analyzing the incremental regression process between the satellite observations’ brightness and temperature.
Author Contributions:
Jiajing Wu is currently pursuing the Ph.D.degree with the Academy for Engineering and
Technology, Ocean University Of China,Qingdao,China.Her current research interests include
computer natural language processing, knowledge graph, machine learing, deep learing and ocean
big data analysis.
Dongning Jia born in 1969,is currently a Professor in Ocean University of China, Qingdao, China.
Zhiqiang Wei born in 1969, is currently a Professor in Ocean University of China, Qingdao,
China. He received a Ph.D. degree from Tsinghua University, Beijing, China, in 2001. His current
research interests are in the fields of intelligent information processing, intelligent computing of big
data.
Dou Xin is pursuing the master's degree with the Academy for Engineering and Technology, Ocean University Of China,Qingdao, China. Her current research fields include knowledge graph, computer natural language processing and machine learning.
Funding: This research was funded by [Major scientific research platform construction project in Shandong Province] grant number [2018SDPT01]
Conflicts of Interest: no conflict of interest
References:
1. Sue N. Big data: The harvard computers. Nature, 2008, 455: 36-37.dio:10.1038/455036a
2. Cukier; Kenneth. Data, data everywhere: A special report on managing information. Economist, 2010, 2: 10-11.
3. Jonathan O T; Meehl G A; Bony S, et al. Climate data challenges in the 21st century. Science, 2011, 331: 700-702.
4. Manyika J; Chui M; Brown B, et al. Big data: The next frontier for innovation, competition, and productivity. McKinsey Global Institute, 2011:1-137.
5. Agrawal D; Bernstein P; Bertino E, et al. Challenges and Agrawal D, Bernstein P, Bertino E, et al. Challenges and opportunities with big data.A Community White Paper Developed by Leading
Researchers Across the United States, 2012.
[2018-07-20].http://cra.org/ccc/docs/init/bigdatawhitepaper.pdf. 6. Tankard C. Big data security. Network Security, 2012, (7): 5-8.
7. Jianning Zhang. Visualization Analysis of Research Hotspots and Fronts of Crowd Behavior in Emergencies Based on Citespace Software. 2017 International Conference on Computer Network, Electronic and Automation,2017:169-174
8. K. Painter; E. R. McConnell; S. Sahasrabudhe; L. Burgoon and C. M. Powers. “What do the data show
Knowledge map development for comprehensive environmental assessment.”.Integrated environmental assessment and management, vol. 10, Jan. 2014, pp. 37–47, doi: 10.1002/ieam.1486.
9. M.H.Abel. “Knowledge map-based web platform to facilitate organizational learning return of experiences Computers.” Human Behavior, vol. 51, Oct. 2015, pp. 960–966, doi:10.1016/j.chb.2014.10.012. 10. L. Leydesdorff and I. Rafols. “Interactive overlays: A new method for generating global journal maps from
Web-of-Science data” . Journal of Informetrics, vol. 6, Apr. 2012, pp. 318–332, doi: 10.1016/j.joi.2011.11.003.
12. Chen, Chaomei. "CiteSpace II: Detecting and visualizing emerging trends and transient patterns in scientific literature." Journal of the American Society for information Science and Technology, 57.3 (2006): 359-377.
13. Chen Chaomei; Fidelia Ibekwe̺; SanJuan; and Jianhua Hou. "The structure and dynamics of cocitation clusters: A multiple̺ perspective cocitation analysis." Journal of the American Society for Information Science and Technology ,61.7 (2010): 1386-1409.
14. BaiduBaike.https://baike.baidu.com/item/GlobalOceanObservingSystem/9476640?fr=Aladdin(January 28, 2020)
15. Adrián. Full integration of photo micnanoimmunosensors in portable platforms for on-line monitoring of ocean pollutants .Sensors&ActuatorsB:chemical,297(2019)126758:1-8
16. Rick Cole; Jeff Kinder; Weidong Yu. Ocean Climate Monitoring.Frontiers in Marine Science.2019,503(6):1-5 17. Shenke Wang; Lu Liu; Liang Qu.Accurate Ulva prolifera regions extraction of UAV images with
superpixel and CNNs for ocean environment monitoring . Neurocomputing,2019,348:158-168
18. Brooks A. Kaiser; Maia Hoeberechts; Kimberley H. Maxwell. The Importance of Connected Ocean Monitoring Knowledge Systems and Communities . Frontiers in Marine Science,2019, 309(6):1-17
19. Yu Yan; Kaiyue Huang. Monitoring the Characteristics of the Bohai Sea Ice Using High-Resolution Geostationary Ocean Color Imager (GOCI) Data . Sustainability 2019, 11, 777; doi:10.3390/su11030777 20. Patrizio Mariani; Iñaki Quincoces ; Karl H. Haugholt ; Yves Chardard .Range-Gated Imaging System for
Underwater Monitoring in Ocean Environment . Sustainability,2019, 11, 162;doi:10.3390/su11010162 21. Elizabeth Nyman; William Soares-Filho; Isabela Maria Seabra de Limaa. Techno-optimism and ocean
governance: New trends in maritime monitoring . Marine Policy,2019,99:30-33
22. Lis Bittencourta; Sean W. Bailey; Robyn N. Conmy; Michael Galvin. Mapping cetacean sounds using a passive acoustic monitoring system towed by an autonomous Wave Glider in the Southwestern Atlantic Ocean . Deep-Sea Research Part I,2018,142:58-68
23. Blake A. Schaeffer; Stefano Vignudelli & Jim Gower. Mobile device application for monitoring cyanobacteria harmful algal blooms using Sentinel-3 satellite Ocean and Land Colour Instruments. Environmental Modelling & Software,2018,109:93-103
24. Gad Levy;Stefano Vignudelli & Jim Gower. Enabling earth observations in support of global, coastal, ocean, and climate change research and monitoring. International Journal of Remote Sensing,2018,39(13):4287-4292
25. Bárbara Moura Reis Manhães; Alice de Souza Picaluga; Tatiana Lemos Bisi; Alexandre de Freitas Azevedo. Tracking mercury in the southwestern Atlantic Ocean :the use oftuna and tuna-like species as indicators of bioavailability. Environmental Science and Pollution Research,2019, https://doi.org/10.1007/s11356-019-07275-4
26. Yongding Zhang ;Xiaofeng Liu ;Minzhou Luo . MPC-based3-D trajectory tracking for an autonomous underwater vehicle with constraints in complex ocean environments. OceanEngineering,189(2019)106309: https://doi.org/10.1016/j.oceaneng.2019.106309
27. Elizabeth A. Andruszkiewicz; Jeffrey R. Koseff1; Oliver B. Fringer; Nicholas T. Ouellette. Modeling Environmental DNA Transport in the Coastal Ocean Using Lagrangian Particle Tracking. Frontiers in Marine Science.2019,477(6):1-14
28. MatthieuRoy-Barman; FrançoisThil; LouiseBordier; ArnaudDapoigny. Thorium isotopes in the Southeast Atlantic Ocean:Tracking scavenging during water mass mixing along neutral density surfaces.Deep-SeaResearchPartI,149(2019)103042,https://doi.org/10.1016/j.dsr.2019.05.002
29. YingkaiXia; ,KanXu; YeLi.Improvedline-of-sighttrajectorytrackingcontrolofunder-actuatedAUV subjects to ocean currents and input saturation. OceanEngineering,2019,174:14-30 ;https://doi.org/10.1016/j.oceaneng.2019.01.025
30. Xu Kang; Bin Song; Jie Guo; Xiaojiang Du. A Self-Selective Correlation Ship Tracking Method for Smart Ocean Systems.sensors,2019,19,821; doi:10.3390/s19040821
31. Sara J. Iverson; Aaron T. Fisk;Scott G. Hinch; Joanna Mills Flemming;Steven J. Cooke; and Frederick G. Whoriskey. The Ocean Tracking Network: Advancing frontiers in aquatic science and management. Nrcresearchpress,2019:1041-1051; dx.doi.org/10.1139/cjfas-2018-0481
33. Zhenning Yu ; Seng Fat Wong. The application of computational fluid dynamics simulation technique to ocean boat anti-disturbance tracking controller.2019:1-10; doi:10.1177/1729881419842045
34. Chen ying;Tang Can; Gu Lin.Research on Deep Ocean Resources Exploration Operation Technology Based on Manned Deep Submersible.Journal of Mechanical Engineering,2003,39(11):38-42
35. Chinese Academy of Sciences.
http://www.qdio.cas.cn/xwzx/tpxw/201105/t20110526_3142444.html(January 29, 2020)
36. Dai baozhang;Zhao kuidong;Jiang shaoyong.Research progress on modern subsea hydrothermal activity and genesis of massive sulfide deposits.Bulletin of Mineralogy, Petrology and Geochemistry,2004,23(3):246-254
37. C.R. Uma Kumari; Dhanalakshmi Samiappana; R. Kumara; Tata Sudhakarb.Development of a highly accurate and fast responsive salinity sensor based on Nuttall apodized Fiber Bragg Grating coated with hygroscopic polymer for ocean observation. Optical Fiber Technology,53(2019)102036; https://doi.org/10.1016/j.yofte.2019.102036
38. Hao Li; Xianqiang He ;Palanisamy Shanmugam ;Yan Bai; Difeng Wang. Radiometric Sensitivity and Signal Detectability of Ocean Color Satellite Sensor Under High Solar Zenith Angles. IEEE TRANSACTIONS ON GEOSCIENCE AND REMOTE SENSING,2019,57(11):8492-8505
39. Grace K. Saba; Elizabeth Wright-Fairbanks; Baoshan Chen;Wei-Jun Cai; Andrew H. Barnard; Clayton P. Jones; Charles W. Branham; Kui Wang and Travis Miles1.The Development and Validation of a Profiling
Glider Deep ISFET-Based pH Sensor for High Resolution Observations of Coastal and Ocean
Acidification. Frontiers in Marine Science,2019; doi:10.3389/fmars.2019.00664
40. Zia M. Loni; Hugo G. Espinosa. Floating Hemispherical Helical Antenna for Ocean Sensor Networks. IEEE JOURNAL OF OCEANIC ENGINEERING,2019,44(4):1041-1048
41. HanSung Kim; HeonYong Kang and Moo-Hyun Kim .Real-Time Inverse Estimation of Ocean Wave Spectra from Vessel-Motion Sensors Using Adaptive Kalman Filter. Applied sciences,2019,2797(9);doi:10.3390/app9142797
42. Caitlin A.L. Riddick; Peter D. Hunter ; José Antonio Domínguez Gómez. Optimal Cyanobacterial Pigment Retrieval from Ocean Colour Sensors in a Highly Turbid, Optically Complex Lake. Remote Sens, 2019, 11, 1613; doi:10.3390/rs11131613
43. Xiaojun Mei; Huafeng Wu; Jiangfeng Xian; Bowen Chen; Hao Zhang and Xia Liu ARobust,Non-CooperativeLocalizationAlgorithmin the Presence of Outlier Measurements in Ocean Sensor Networks. Sensors 2019, 19, 2708; doi:10.3390/s19122708
44. Peter E. Land; Helen S. Findlay; Jamie D. Shutler; Ian G.C. Ashton ;Thomas Holding. Optimum satellite remote sensing of the marine carbonate system using empirical algorithms in the global ocean, the Greater Caribbean, the Amazon Plume and the Bay of Bengal. Remote Sensing of Environment,235(2019)111469; https://doi.org/10.1016/j.rse.2019.111469
45. WatsonWGregg;CecileSRousseaux.Global ocean primary production trends in the modern ocean color satellite record(1998–2015). LETTER, 14(2019)124011; https://doi.org/10.1088/1748-9326/ab4667
46. Michio Fujii; Hirotada Hashimoto; Yuuki Taniguchi; Eiichi Kobayashi. Statistical validation of a voyage simulation model for ocean-going ships using satellite AIS data. Journal of Marine Science and Technology (2019) 24:1297–1307; https://doi.org/10.1007/s00773-019-00626-3
47. Yingjun Zhang; Chuanmin Hu. Submesoscale and Mesoscale Eddies in the Florida Straits: Observations from Satellite Ocean Color Measurements. RESEARCH LETTER,(2019)46:13,262–13,270. https://doi.org/10.1029/ 2019GL083999
48. Zijin Zhang; Xiaolong Dong;K.K. Hon;and Liling Liu.Tropical Cyclone Surface Pressure Field Estimation Using Satellite Passive Microwave Observations over the Oceans. Journal of Geophysical Research: Oceans, 2019,124, 7854–7872;https://doi.org/10.1029/2019JC015136
49. Angel Amores; , Gabriel Jordà and Sebastià Monserrat.Ocean Eddies in the Mediterranean Sea From Satellite Altimetry: Sensitivity to Satellite Track Location. Frontiers in Marine Science,2019,703(6); doi: 10.3389/fmars.2019.00703
50. Kyung-Ae Park; Hye-Jin Woo ; Eun-Young Lee.The application of a hybrid sea surface temperature algorithm to COMS geostationary satellite data in the Northwest Pacific Ocean. International Journal of Remote Sensing,2019; https://doi.org/10.1080/01431161.2019.1688889
52. Stephanie Clay; Angelica Peña; Brendan DeTracey;Emmanuel Devred. Evaluation of Satellite-Based Algorithms to Retrieve Chlorophyll-a Concentration in the Canadian Atlantic and Pacific Oceans. Remote Sens. 2019, 11, 2609; doi:10.3390/rs11222609