Article
1
Index Cost Estimation Using Case Based Reasoning
2
Model Based on Macro BIM
3
Krzysztof Zima 1,*and Agnieszka Leśniak 2
4
1 Institute of Construction Management, Cracow University of Technology, Warszawska 24 st., 31-155
5
Kraków, Poland; [email protected]
6
2 Institute of Construction Management, Cracow University of Technology, Warszawska 24 st., 31-155
7
Kraków, Poland; [email protected]
8
* Correspondence: [email protected]; Tel.: +48-12-628-2354
9
Abstract: Information regarding the cost of a construction project is available to the investor and
10
project participants in order to determine the subsequent success of a project, given that the
11
information they collect has an impact on the decisions they make. Cost calculations, especially in
12
the initial phase of a project, often generate large errors. This paper presents the new approach
13
based on a combination of the Case Based Reasoning method (CBR) with the originally selected
14
criteria for the description of a construction project (as a result of Pearson correlation coefficient
15
and Spearman's rank correlation coefficient) and Building Information Modeling (BIM) technology.
16
The CBR method fulfils expectations for a simple and fast system supporting the cost estimation
17
process. It does not require any specialist knowledge, so it will be comprehensible to cost
18
estimation practitioners. The BIM-based model gives the opportunity for the calculation of
19
quantity take-offs and enables the use of the information contained in the BIM model in the cost
20
estimation process. In order to prepare the model an appropriate relational database had to be
21
developed. With extensive research, a database of 173 construction projects, including the
22
construction of a sports field, was obtained. There were 14 variables defined originally by authors;
23
however, only 10 (as a result of the correlation analysis) were used for the calculation. Data related
24
to the project were collected in the BIM model. Results estimating the project’s unit price, using the
25
CBR method, were presented and discussed. The Mean Absolute Estimate Error was used to
26
evaluate the model.
27
Keywords: Building Information Modeling; Case Based Reasoning; cost estimating; information
28
management
29
30
1. Introduction
31
The collection and storage of information is one of the most important tasks undertaken during
32
a construction project. The impartial information received as project utility evaluation is useful for
33
strategic planning, quality management, for solving the tasks of resource allocation, motivational
34
project evaluation [1]. The information the investor and other project participants have access to
35
determines the subsequent success of the project given that the information they collect has an
36
impact on their decisions. For owners, contractors, and other stakeholders, forecasting the
37
construction cost trend is very important to accurately estimate construction costs, prepare the
38
project budget, control costs, and assess the associated risks [2]. As wrote Kapliński and Tupenaite
39
one of the greatest challenges in the modern construction economics is efficient decision-making [3].
40
Cost is one of the major criteria in decision making at the early stages of a building design
41
process [4]. The decision about the continuation of investment is mainly based on the cost of the
42
building project. Performance and overall project success are often measured by how well the actual
43
cost compares to the early cost estimates [5].
44
Cost estimate accuracy research has been the basis for the creation of a model for supporting
45
cost estimation in the early phase of the project. The need for a correct and possibly accurate cost
46
estimate in this phase is very important to the investor and impacts the decision-making on the
47
continuation of the project and its subsequent success.
48
The literature contains many models supporting cost estimation of construction works. Despite
49
the fact that there are many different prediction models, the improvement of prediction accuracy is
50
still an acute problem that is facing decision makers in many areas [6]. These models can be divided
51
according to two criteria: the type of the cost estimate and the mathematical method used in the
52
construction project cost estimation model. Two kinds of estimates can be distinguished within the
53
cost estimate type criterion: the initial estimates performed at the concept stage and the detailed
54
estimates performed at the contractor selection stage. In turn, models supporting cost estimation can
55
be divided according to the mathematical methods used as follows:
56
Models using artificial neural networks,
57
Models based on fuzzy set theory,
58
Models based on analytic hierarchy process (AHP),
59
Models based on multiple regression,
60
Models based on case-based reasoning (CBR),
61
Hybrid models using at least two different mathematical methods.
62
There are many models supporting cost estimation at the initial cost estimation stage in the
63
literature. For example, Lowe, Emsley and Harding [7] used linear regression models to predict
64
construction costs. The authors based their research on data from 286 construction projects
65
implemented in the United Kingdom. Six models are developed for cost/m2, log of cost, and log of
66
cost/m2. Forty-one potential independent variables were identified by authors and five variables
67
appeared in each of the six models: gross internal floor area GIFA, function, duration, mechanical
68
installations, and piling, suggesting that they are the key linear cost drivers in the data.
69
Gunaydin and Dogan in [4] and Juszczyk in [8] used artificial neural networks for cost
70
estimation in the initial project phase. Gunaydin and Dogan estimated the costs of 4-8 floor
71
apartment buildings in the design phase, erected using reinforced concrete technology. In order to
72
forecast the costs, they used 8 criteria: total area of the building, ratio of the typical floor area to the
73
total area of the building, ratio of ground floor area to the total area of the building, number of floors,
74
console direction of the building, foundation system of the building, floor type of the building and
75
location of the core of the building. Juszczyk performed an analysis of a cost estimation
76
documentation for 102 multi-family dwelling houses built between 2003 and 2008. The author’s
77
analyses used 13 explanatory variables such as: footprint area, floor spaces of the flats, commercial
78
units and underground garages, cubic volume of the building, number of floors, type of foundation,
79
building structure and roof structure, number of structural segments of the building and lift shafts,
80
ground conditions and standard of finish. The author applied both index methods and single neural
81
networks and groups of artificial neural networks to model the costs of the buildings.
82
The case-based reasoning was used, for example, by Ji, Park and Lee in [9] and Marzouk and
83
Ahmed [10]. Ji, Park and Lee based their analysis on a database of actual costs of public projects in
84
Korea. The projects concerned 164 apartment buildings (104 cases from 2005, 28 from 2007, and 32
85
from 2009). The authors used 12 criteria in their research: Number of households, Gross floor area,
86
Number of unit floor households, Number of elevators, Number of floors, Number of piloti with
87
household scale, Number of households of unit floor per elevator, Height between stories, Depth of
88
pit, Roof type, Hallway type, Structure type.
89
Marzouk and Ahmed in their research [10] presents a parametric-cost model for pump station
90
projects. Fourteen factors have been identified as important to the influence of the cost of pump
91
station projects. A data set that consists of forty-four pump station projects (fifteen water and
92
twenty-nine waste water) are collected to build a Case-Based Reasoning (CBR) library and to test its
93
performance.
94
The cost estimation model using the fuzzy set theory was proposed and described by El
95
Sawalhi [11]. The author conducted surveys and used the relative index ranking technique to
identify 5 factors that have the greatest impact on the cost of a construction project. The most
97
important factors were: typical floor surface area, number of floors, number of lifts, cubic volume
98
occupied by the HVAC (Heating, Ventilation, Air Conditioning) systems and the type of exterior
99
finish. Each analysed design (106 construction projects in Gaza Strip) provided a source of
100
information and included a cost estimate and an actual budget and final reports. It is also possible to
101
find cost estimation models that use hybrid methods in the literature.
102
For example, Cheng M-Y., Tsai H-C., Hsieh W-S [12] used an evolutionary fuzzy neural
103
interference model for cost estimation and Cheng M-Y., Tsai H-C., Sudjono E. [13] used neural
104
networks with fuzzy criteria evaluation. An, Kim and Kang [14] used the CBR reasoning with the
105
determination of the validity of criteria via the AHP process and Kim and Shim [15] supported the
106
CBR reasoning process with genetic algorithms.
107
BIM-based models supporting cost estimation are currently described in the literature mainly
108
because of the opportunities provided by the BIM model for quantity take-offs, and conceivably due
109
to the possibility of using the information contained in the BIM model in the cost estimation process.
110
Actually designing is a team game, that, in order to cope with, you need a competent team at hand
111
and new organizational methods should be used (e.g., integrated design), new tools (e.g., Building
112
Information Modeling) [16]. Consequently, the opportunities and benefits of using the BIM model in
113
the quantity take-off process were discussed, among others, by [17-18]. The cost estimation using
114
traditional cost estimation formulas and based on the BIM model saved in the IFC format was
115
discussed, among others, by [19-21].
116
The aim of the article is to present the method of cost calculation at the initial stage of a
117
construction project intended for the investor, which meets two conditions: it is easy to apply and
118
generates a relatively low calculation error in relation to the costs of bids. For this purpose, the
119
authors have chosen the method of case based reasoning, which is based on the actual case database
120
and, thanks to case similarity measurement, shows not only the cost adopted on the basis of the
121
selected case, but also gives the case similarity value allowing to assess the solution's adjustment.
122
The BIM model was used due to quick and easy of calculating the amount of work, and the ability to
123
store data in an IFC file.
124
2. CBR and BIM in supporting the estimation of project costs
125
Materials and Like the rest of the EU, Poland is currently facing the prospect of implementing
126
and applying the EU Directive on the application of the BIM concept in public procurement
127
contracts. It should be assumed that public and private investors will soon see the benefits of using
128
the BIM technology in construction projects.
129
The advantage of using the BIM model is the considerable acceleration and automation of the
130
quantity take-off process for construction works and their valuation. A take-off based on a building
131
model saved in the IFC format makes it possible to read the amount of works in any form instead of
132
laboriously calculating the amount of works to be performed. Taking advantage of the possibilities
133
provided by the BIM model for the geometry of construction elements allows for quick and accurate
134
calculations.
135
The accessibility of the information stored in one place in the model and the virtual
136
representation of the planned civil structure in 3D make it possible to thoroughly analyse the
137
individual building elements.
138
Recognising BIM as a dynamically developing technology and appreciating its numerous
139
advantages for the take-off and costing processes, the author adopted the macro BIM model as a
140
basis for the model supporting cost estimation. The macro BIM model is a building information
141
model with a low level of detail, used in the phase of preparing the construction and investment
142
process and applied for a macro-level analysis, including visualisation, spatial modelling, cost
143
calculation, etc. The macro model allows for index calculations based on information about the size
144
of the civil structure, such as its cubic volume, footprint area, floor space, number of floors, etc.
145
The choice of the CBR reasoning method was dictated by its continuous learning mechanism
146
independent of the expert and the low requirements for acquired knowledge or the lack of precision
in the possessed information and comparatively simple and fast calculation. An additional
148
advantage of using the CBR method is that it relies on a database containing historic price data from
149
previously completed projects instead of prices from price bulletins.
150
For the CBR method, a rule-based specialist knowledge is not required as is the case with most
151
expert systems. A disadvantage of these methods is the difficulty in formulating an appropriate set
152
of rules and often a complex method of its verification and supplementation. The cost estimation
153
process is characterised by certain dynamics of changes in the environment, understood as all the
154
changes affecting the prices of the construction works. However, the construction market cannot be
155
considered as a fully stable environment. When analysing methods for the construction of intelligent
156
systems, it is clear that the CBR method is best-suited to meet the adopted assumptions, if the
157
assumptions about the environment and the required knowledge are taken into consideration.
158
The CBR method, therefore, fulfils expectations for a simple and fast system supporting the cost
159
estimation process. It does not require a specialist knowledge, so it will be understandable to cost
160
estimation practitioners, which is an additional reason for using this method.
161
3. Relational database for cost estimation purposes
162
The collection and management of knowledge is the basis of any information-based system. For
163
cost estimates to be realistic and precise, they should be based on information from previously
164
completed projects. The actually incurred costs of the construction works and the costs resulting
165
from the cost estimates provided in the bids are a priceless source of knowledge for cost calculations
166
performed in the early project phase.
167
A database is a set of interrelated information that can be stored, for example, in a BIM model.
168
On the other hand, a relational database can create a set of unordered tables that can be used in
169
analysis or report generation by using an operation that returns entire tables in its result [22]. The
170
purpose of creating a relational IFC-DB database based on the BIM model is to organise and
171
systematise the data on the costs of construction works and building elements obtained from
172
previous construction projects. The information must be prepared in a way that enables their use in
173
initial estimations, so it should allow for index calculations. The IFC-DB database in question is
174
based on the completed cost estimates provided in bids for civil structures. The IFC-DB database
175
was created on the basis of bidding cost estimates, descriptions of procurements for construction
176
works and design documentation. Each construction project was described in the database with the
177
available information, such as the cost of the construction project, the size of the works, the date of
178
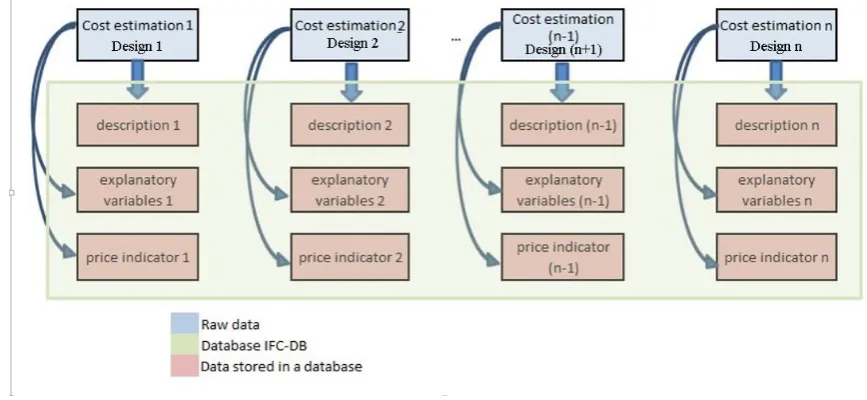
completion, the location of the civil structure, etc. Figure 1 shows the concept of the database created
179
on the basis of construction designs and cost estimate calculations.
180
181
The information included in the IFC-DB database can be obtained from BIM models of civil
183
structures saved in the IFC format, especially in the area of the civil structure geometry, and from the
184
cost estimates recorded together with the BIM model of the civil structure. This will allow for the use
185
of the information collected in models, as proposed by the BIM concept. Such a database using BIM
186
models has the added advantage of being able to easily store and retrieve geometric data and
187
automatically retrieve data directly from the model saved in the IFC format. The IFC-DB database
188
developed to support cost estimation with the CBR method includes old cases containing essentially
189
four groups of information: information on the geometry of the civil structure - G, solution - S,
190
description of the situation - D and explanation - E. In order to formalise the description of the old
191
cases, the IFC-DB database was defined by the following formula:
192
⋃ * +
(1)
where:
193
Casei {Gi, Si, Di, Ei} - i-th case extracted from the BIM model,
194
Gi - graphical representation of the model elements for the i-th case,
195
Si - solution, i.e. the costs of construction of the elements included in the BIM model,
196
Di - cost estimate situation for the i-th case (time of completion, place),
197
Ei - description of the construction project for the i-th costed case,
198
n - number of old cases in the database.
199
Solution Si contains price value indices in any monetary unit referenced to surface area or cubic
200
volume measurement units as well as a description of the situation Di, which contains the necessary
201
information describing the market factors affecting the cost of the project and the description of the
202
construction project Ei in the form of qualitative data describing the civil structure.
203
In the case of the simplified cost estimation in the initial phase of the project, the graphical
204
representation of the model elements is limited to surface and cubic volume indices. The solution is
205
the total cost of construction of the civil structure or a unit cost. The cost estimate situation includes
206
the parameters used to adapt the solution, including data on the location of the project and the date
207
of completion. The case description includes the information on the civil structure that affects the
208
cost of its construction to a specified degree. The explanatory variables describing the case may vary
209
depending on the type of civil structure. The limit of the impact on the cost of the project, which
210
constitutes the criterion for the selection of the final set of explanatory variables, is determined by
211
the decision maker based on, for example, correlation analysis between the variables describing the
212
project and the total or unit cost of construction of the civil structure.
213
4. Supporting the cost calculations based on the Macro BIM model
214
The paper presents the ICE-MACRO (Index Cost Estimate-MACRO) method supporting the
215
calculation of costs, which was created by the author to determine the index cost estimates based on
216
the Macro BIM model. The method is dedicated to the 2nd or 3rd level of maturity of the BIM model.
217
The level of development of the BIM model in accordance with the AIA (American Institute of
218
Architects) classification is LOD 100 or LOD 200, i.e. it is the level of development of the model at the
219
concept or conceptual design stage. A decision maker or cost estimator performing the cost
220
estimation of the construction project at the early phase of the project has only the general
221
parameters of the planned civil structure. The ICE-MACRO method is based on the relational
222
IFC-DB database discussed earlier and the model of the civil structure saved in the IFC format that
223
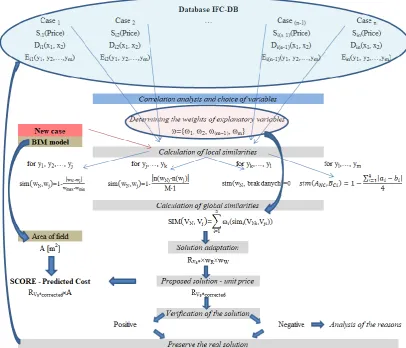
represents the new case. Figure 2 shows the procedural algorithm used in the ICE-MACRO method.
225
Figure 2. Procedural algorithm used in the ICE-MACRO method
226
The problem to be solved is the forecasted cost of constructing the civil structure represented by
227
the BIM model. Currently, BIM models are most commonly saved in the IFC format, enabling the
228
exchange of information with many project participants who use different software. The IFC format
229
is currently the most popular common data scheme for maintaining and exchanging data between
230
different BIM applications used in the construction industry. It is a neutral and open specification,
231
which is the basic data file format based on the data model developed by the buildingSMART
232
alliance® in order to facilitate interoperability in the construction industry. This format improves
233
communication, reduces the time of delivery of the civil structure data and increases productivity
234
and quality throughout the building’s lifecycle.
235
The information that can be contained in a model saved in accordance with the IFC specification
236
includes:
237
Hierarchical information about the building (phase, stage of construction of the civil structure),
238
Information about the type of an element (walls, ceilings, columns, beams, stairs, etc.),
239
Information about the geometry of the civil structure and its elements (dimensions, coordinates
240
of the element, surfaces and volume),
241
Information about relationships between individual elements (e.g. connections between
242
elements),
243
Information about standard and non-standard properties assigned to elements (material,
244
colour, cross-sections, fire protection, weight, etc.),
245
Information on the cost of construction of elements, time and required quality.
The first step in the presented method is to specify the explanatory variables Ei affecting the cost
248
of the civil structure. There can be any number of variables, which varies depending on the type of
249
the civil structure. The explanatory variables should be preferably strongly correlated with the
250
response variable, i.e. the cost of the construction of the civil structure, and poorly correlated with
251
each other. The next step is to specify the validity of individual explanatory variables. The validity of
252
the variables will depend on the degree of impact on the cost of the civil structure, i.e. the strength of
253
correlation with the variable Cost. The correlation describes the strength and type of relationship
254
between two variables, with the strength of the relationship being described by a number and the
255
type being described by a ‘+’ or ‘-’ sign. The correlation calculations used the Pearson correlation
256
coefficient and Spearman’s rank correlation coefficient. The Pearson coefficient measures the
257
strength of the linear relationship between variables, where the variables are of a quantitative
258
nature, and Spearman’s rank correlation coefficient measures monotonic relationships. Therefore,
259
Pearson correlation coefficient was used only to examine the strength and direction of the
260
relationship between the measurable variables, and Spearman’s rank correlation coefficient was
261
used to describe the strength of correlation of two variables where the examined variables were of a
262
qualitative nature.
263
The next step is the introduction of an appropriately chosen computational mechanism used in
264
the application of the CBR method that is aimed at determining the degree of similarity between the
265
description and the currently analysed new case, using the case-specific explanatory variables found
266
in the IFC-DB database. Thanks to the used algorithms, the system user can obtain both information
267
and solutions at the level of the structure of the member function and the solutions for the
268
completion of the overall problem [23]
269
Therefore, all the old cases contained in the IFC-DB database should be compared with the new
270
case according to the CBR method that measures the similarity of new and old cases. Similarity
271
measurements are performed according to the nature of the explanatory variable.
272
The similarity for quantitative variables or ordinal variables determining the amount of construction
273
works to be performed, or the quantities that characterise the civil structure, was measured
274
according to the formula (as per [24]):
275
( ) - | - |
- (2)
where:
276
wN - value of the explanatory variable for the new case,
277
wj - value of the explanatory variable for the j-th old case,
278
wmax, wmin - minimum and maximum values for all the old cases included in the database.
279
The similarity for qualitative variables determining the amount of construction works to be
280
performed or the quantities that characterise the civil structure was measured according to the
281
formula:
282
( ) -| - - | (3)
where:
283
n(wN), n(wj) - place in an ordered array of values n(w)=1,2,<, n,
284
M - number of values.
285
If one or both of the variable values are unknown, the similarity value equals zero:
286
( ) (4)
There may also be a situation where there is unclear or inaccurate data. In such a case, it is
287
possible to use mathematical operations based on fuzzy logic. It is then necessary to record the
288
inaccurate information about the civil structure or its elements included in the BIM model in the
289
form of a fuzzy number and determine the shape of the membership function. The use of fuzzy logic
290
will make it possible to use intermediate values from the set [0, 1] when evaluating the explanatory
291
variables. The calculation formula depends, however, on the assumed shape of the membership
292
function for the given explanatory variable. For example, taking into account two trapezoidal fuzzy
numbers ANC = (a1, a2, a3, a4) and BCi = (b1, b2, b3, b4), the similarity SIM(ANC, BCi) can be defined by the
294
following formula:
295
( ) ∑ | | (5)
where:
296
sim(ANC, BCi) - similarity between fuzzy numbers,
297
ANC - fuzzy number for the new case,
298
BCi - fuzzy number for the old case taken from the database,
299
ai, bi - characteristic points for fuzzy numbers ANC and BCi.
300
In the presented algorithm, it was decided to separately calculate local similarities using the
301
formulas (2), (3), (4) and (5) above. After analysing the local similarities, i.e. the similarities generated
302
for individual variables, the global similarity should be calculated using the weights assigned to
303
individual variables:
304
( ) ∑
) (6)
where:
305
i - weight of the i-th explanatory variable,
306
SIM(VN,Vj) - global similarity between the old Vj and the new case VN,
307
simi(VNi,VSji) - local similarity for the i-th explanatory variable between the old Vj and the new case
308
VN.
309
The case found should meet the following conditions after the calculation of the similarities
310
between the cases:
311
1. The cases that have the highest value of the global similarity SIM(VN, Vj) are selected;
312
2. The minimum preferred similarity was determined arbitrarily by the author at 70%;
313
3. The similarity is calculated in natural numbers;
314
4. The minimum number of selected old cases is three (the value adopted by analogy with the
315
rules used in property valuation, as the minimum number of the most similar properties
316
selected for calculation in property valuation in the pair comparison method). One case with
317
the similarity of up to 100% may be specific and have an overestimated or underestimated unit
318
price value. Three or more cases guarantee greater reliability;
319
5. Cases significantly deviating from the rest of the selected cases (difference greater than 50%
320
from the value of the other cases) in the situation of a greater number of selected cases (more
321
than 2) are rejected;
322
6. The resulting unit price for the new case is a weighted average of the selected old cases, where
323
the weight depends on the calculated similarity of the cases.
324
The solutions that meet these conditions are selected for the next stage, which consists in the
325
adaptation of solutions.
326
The ICE-MACRO method always performs adaptation due to the time difference between the
327
calculation of the selected most similar old case VS* and the new case, as well as due to the location of
328
the civil structures. The adjustment will be performed using the regional factor wR and the
329
indexation factor ww. The regional factor reflects the price differences occurring in different project
330
locations between the new case VN and the old case VS*. The indexation factor reflects the differences
331
in the calculations caused by the passage of time between the old case VS* and the new present case
332
VN.
333
After the adaptation has been performed, the newly created knowledge constitutes the
334
forecasted initial cost estimation of the construction of the civil structure. After having been used,
335
this value is transferred to a quarantine where it awaits the practical verification of the analysis
336
results. After the adjustment resulting from the practical verification, the new case is saved and
337
added to the existing IFC-DB database.
340
5. Computational example
341
The computational example showing the application of the ICE-MACRO model is concerned
342
with the construction of single- and multi-purpose sports fields. Information on the completed
343
projects of this kind come from public announcements on the intention to conclude a contract for
344
construction works in the period from 2014 to 2016. The database contains 173 construction projects.
345
The sports field database DBSF contains 4 groups of information: a graphical representation of
346
the model elements - G, the solution, i.e. the costs of the construction of 1 m2 of the sports field
347
surface area - S, the cost estimate situation (date of announcement, location of the project) - D, and
348
the explanatory variables - E.
349
The solution S is the unit price of m2 of the sports field surface expressed in PLN/m2. The
350
explanatory variables include the information describing the civil structure, both the quantitative
351
geometric information - G and the information that qualitatively describes the construction project -
352
E. The initial set of explanatory variables resulting from the literature study, as well as the analysis of
353
the availability of information in announcements on public procurements for the construction of
354
sports fields (on such an early stage of project), include 14 variables:
355
1. Quantitative variables
356
intended use of the field,
357
surface area of the field,
358
surface area of the access paths and routes,
359
green surface area,
360
surface area of the ball containment netting,
361
fence length.
362
2. Qualitative variables
363
type of the sports surface,
364
type of the material for access routes,
365
type of the fence,
366
type of sports equipment - handball,
367
type of sports equipment - volleyball,
368
type of sports equipment - basketball,
369
type of sports equipment - football,
370
type of sports equipment - tennis.
371
The database DBSF containing 173 construction projects consisting in the construction of sports
372
fields was saved in the form of the following records conveying the relevant previously mentioned
373
information:
374
Casen {Gi = (surface area of the field, surface area of the access paths and routes, green surface
375
area, surface area of the ball containment netting, fence length); Si = (unit price of the field surface
376
area); Di = (location, date of the bid); Ei = (intended use of the field, sports surface type, material for
377
the access paths and routes, type of the fence, type of the equipment in the 1/0 = YES/NO notation -
378
handball-volleyball-basketball-football-tennis)},
379
The data in the example contained in the database DBSF does not come from the BIM models
380
due to the low availability of such models in practice. The new case analysed in the example was
381
implemented as a BIM model and will be analysed as such, which will simplify the calculation of the
382
needed quantitative data.
383
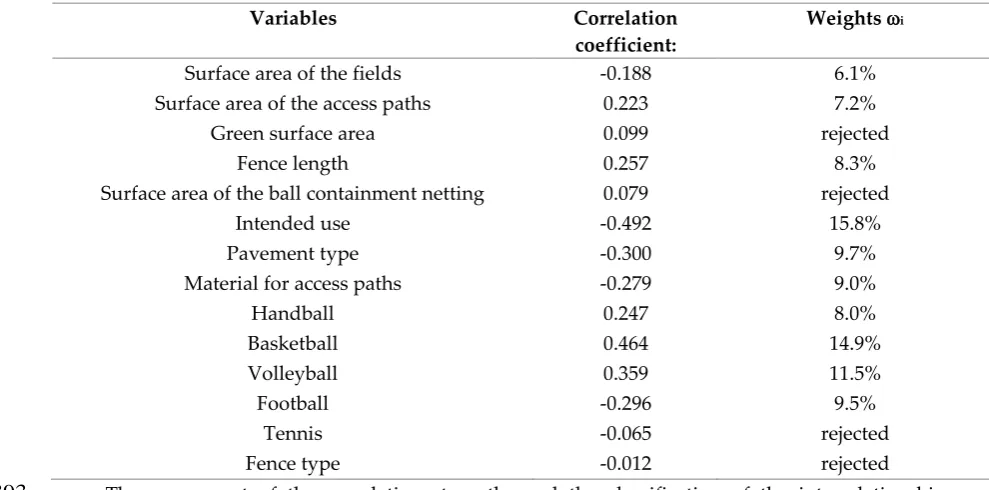
Table 1 presents the correlation coefficients of individual variables with the unit price of m2 of
384
the surface area of the sports field and weights of explanatory variables calculated on the basis of
385
correlation coefficients. The correlation coefficient for variables 1-5 was calculated using the Pearson
386
correlation coefficient, and the correlation coefficient for the other variables was calculated using
387
Spearman's rank correlation coefficient.
391
Table 1. The correlation coefficients and the weight of individual explanatory variables
392
Variables Correlation
coefficient:
Weights i
Surface area of the fields -0.188 6.1%
Surface area of the access paths 0.223 7.2%
Green surface area 0.099 rejected
Fence length 0.257 8.3%
Surface area of the ball containment netting 0.079 rejected
Intended use -0.492 15.8%
Pavement type -0.300 9.7%
Material for access paths -0.279 9.0%
Handball 0.247 8.0%
Basketball 0.464 14.9%
Volleyball 0.359 11.5%
Football -0.296 9.5%
Tennis -0.065 rejected
Fence type -0.012 rejected
The assessment of the correlation strength used the classification of the interrelationship
393
strength according to J. Guilford:
394
r = 0 no correlation,
395
0 < r < 0.1 barely perceptible correlation,
396
0.1 < r < 0.3 poor correlation,
397
0.3 < r < 0.5 average correlation,
398
0.5 < r < 0.7 high correlation,
399
0.7 < r < 0.9 very high correlation,
400
0.9 < r < 1 almost full correlation,
401
r = 1 full correlation.
402
Based on the assumption that the cost estimation should be as accurate as possible, and also
403
taking into consideration the fact that there are few variables in the case in question, a decision was
404
made to reject the variables that had no correlation or had barely perceivable correlation (variables 3,
405
5, 13, 14) and to keep only those that are characterised by at least poor correlation. The weights of the
406
rrelation
407
coefficient and the sum of the absolute values of all correlation coefficients after the previous
408
rejection of variables 3, 5, 13 and 14.
409
12 test cases (10%) were randomly selected from a set of 120 cases for subsequent testing as
410
follows: Case 11, Case 24, Case 34, Case 35, Case 41, Case 48, Case 52, Case 68, Case 70, Case 75, Case
411
111 and Case 116.
412
Local similarities and the global similarity were calculated subsequently for all new cases. The
413
examples of the detailed calculations of the project price for test case 11 are shown below.
414
Local similarities were calculated for subsequent old cases from the database by using formulas
415
(2) for the quantitative variables and (3) and (4) for the qualitative variables (Tab. 2). Then, the
416
calculations of the global similarity were performed (Tab. 3) according to the formula (6), using the
417
weights of the variables in Table 1. The highest similarity value of 98% to test case 1 was achieved by:
418
Case 7 - SIM(VTest case 1, VCase 7); Case 13 - SIM(VTest case 1, VCase 13) and Case 93 - SIM(VTest case 1, VCase 93).
419
424
Table 2. The values of the local similarities and the global similarities for the cases with the highest
425
similarity to New Case 1
426
Variables Local similarities
Case 7 Case 13 Case 93
Surface area of the fields 0,94 0,94 0,99
Surface area of the access paths 0,97 0,97 0,99
Fence length 0,86 0,79 0,80
Intended use 1,00 1,00 1,00
Pavement type 1,00 1,00 1,00
Material for access paths 1,00 1,00 1,00
Handball 1,00 1,00 1,00
Basketball 1,00 1,00 1,00
Volleyball 1,00 1,00 1,00
Football 1,00 1,00 1,00
Global similarities 0,98 0,98 0,98
Table 3 shows a brief characteristic of the old cases selected during the calculation of the global
427
similarities and test case 1.
428
Table 3. Selected cases with the highest degree of similarity to New Case 1
429
Case Test case 1 Case 7 Case 13 Case 93
No. of bid according to the public procurement office
55769 - 2014 40988-2014 59010-2014 35376-2015
Total price 380 118,38 PLN 186 435,09 PLN 567 800,35 PLN 467 710,00 PLN
Unit price 287,97 PLN 304,08 PLN 985,76 PLN 316,02 PLN
Date of estimation 13.05.2014 06.03.2014 15.04.2014 25.03.2015
Territory Silesian region Masovian
district
Łódź province Wielkopolska
province Case 13 was rejected due to a considerable difference in unit price compared to the other two
430
selected cases. After the analysis of the public procurement, it is clear that the content of the
431
procurement was the construction of a multi-purpose sports field with accompanying elements,
432
such as lighting and septic tanks, which do not fall within the scope of works in other procurements.
433
The other two selected cases were adapted for the location of the project and the date of the cost
434
estimate. Regional coefficients calculated by the author on the basis of the Sekocenbud regional price
435
bulletin [25] were used in order to adjust the location. The Sekocenbud forecasting and indexation
436
bulletin [26] was used to update the prices of construction projects estimated in the past. The
437
adjusted unit prices are shown in Table 4.
438
Table 4. Adjusted unit prices of two selected cases - case 7 and case 93
439
Case Case 7 Case 93
Unit price 304,08 PLN 316,02 PLN
Regional factor 1,028 0,960
Indexation factor 100,1% 101,3%
Adjusted price 312,91 PLN 307,31 PLN
The adjusted price of Case 7 was calculated from the product PLN 304.08 1.028 1.001; where
440
the regional factor is - 1.028 and the indexation factor is equal to (1 + 0.01%) = 100.1%. In Case 93, the
441
adjusted price was calculated from the product PLN 316.02 0.960 1.013; where the regional factor
442
is - 0.960 and the indexation factor is equal to (1 - 0.3%) (1 - 0.0%) (1 + 1.6%) = 101.3%. The final
443
price for test case 1 is an arithmetic mean of the unit prices of case 7 and case 93 and equals:
( ) ( )
(7)
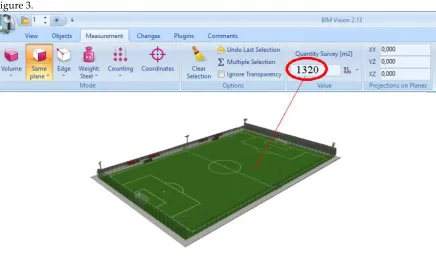
After calculating the price of test case 1, the surface area of the field was calculated from the
445
BIM model of the civil structure. The surface calculations can be done very quickly and simply by
446
selecting the surface in the sports field model view. An example of such a procedure is shown in
447
Figure 3.
448
449
Figure 3. Take-off procedure in the ICE-MACRO method based on the MACRO BIM model - view in the
450
BIM Vision browser
451
The final forecasted cost of the construction of the sports field for test case 1 is: 310.11
452
[PLN/m2] ×1320 [m2] = 409,340.67 PLN.
453
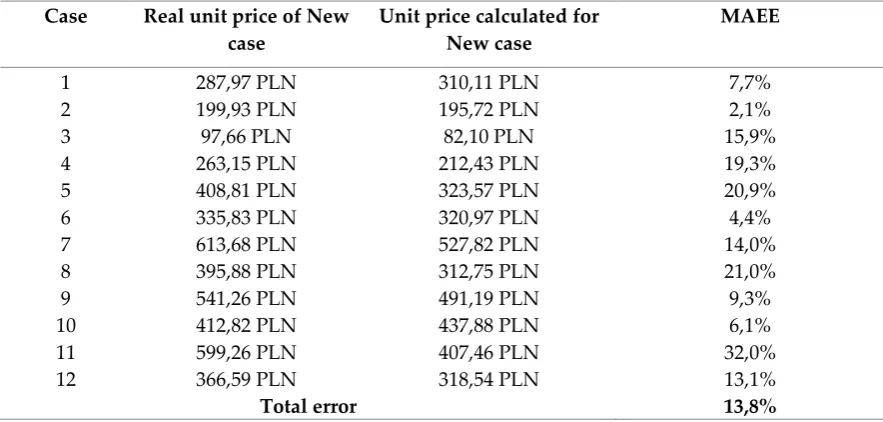
4. Discussion
454
Table 5 shows the results of the forecast of the unit price using the CBR method. Actual unit
455
prices for m2 of sports field surface taken from the winning bids, selected during the public
456
procurement procedure for the test set (test cases 1-12) and the forecasted prices calculated using the
457
ICE-MACRO method, were provided. The assessment was based on the calculated Mean Absolute
458
Estimate Error (MAEE):
459
∑ | |
(8)
where:
460
At - current actual price,
461
Ft - forecasted price,
462
n - size of the test set.
463
464
The error is smaller than 10% for test cases 1, 2, 6, 9 and 10 and the error exceeds the value of
465
20% only in cases 5, 8 and 11. Probably the reason for such large differences may be a relatively small
466
database as well as the differences in the planned scope of the construction works and the difficulty
467
in taking into account the scope of some works, such as demolition works at the initial stage of the
468
project.
470
Table 5. The results of unit price estimation using the ICE-MACRO method together with the MAEE
471
error
472
Case Real unit price of New case
Unit price calculated for New case
MAEE
1 287,97 PLN 310,11 PLN 7,7%
2 199,93 PLN 195,72 PLN 2,1%
3 97,66 PLN 82,10 PLN 15,9%
4 263,15 PLN 212,43 PLN 19,3%
5 408,81 PLN 323,57 PLN 20,9%
6 335,83 PLN 320,97 PLN 4,4%
7 613,68 PLN 527,82 PLN 14,0%
8 395,88 PLN 312,75 PLN 21,0%
9 541,26 PLN 491,19 PLN 9,3%
10 412,82 PLN 437,88 PLN 6,1%
11 599,26 PLN 407,46 PLN 32,0%
12 366,59 PLN 318,54 PLN 13,1%
Total error 13,8%
The total MAEE error of 13.8% is acceptable, assuming that the accuracy range of the initial
473
estimates is from -30% to +50% according to PMI 2008 [27]. The requirements of the American
474
Association of Cost Engineers (AACE) - the error range of -10% to +15% - are also met. In addition,
475
the estimated error range of -30% to +50% meets the requirements of the Construction Industry
476
Institute (for: Kim and Shim 2014). It is worth noting that the error is significantly smaller than the
477
error resulting from the actual differences between the investor’s calculation and the winning bid. In
478
Poland, the differences between the price of the selected bid and the value of the procurement
479
resulting from the investor’s cost estimate are very large. The maximum difference for the
480
construction of sports facilities in the period between 2014 and 2015 was as much as 83.3%. The most
481
frequent difference between the price of the selected bid and the estimated value of the procurement
482
contract was 20% - 50%.
483
By comparing the results of the ICE-MACRO model with the results of the authors cited at the
484
beginning of the paper, it should be noted that the results are promising. The ICE-MACRO method
485
produces better results than the best model using multiple regression techniques described by Lowe
486
et al. [7] and the index methods, which generate an even higher error rate.
487
The neural networks described by Gunaydin and Dogan in [4] and Juszczyk in [8] show a
488
similar error rate for individual networks. Only neural network groups exhibit a large potential,
489
generating a mean error of 6.04%. The problem with neural networks is the maximum percentage
490
error PEmax, which is over 50% for both methods, as compared to the 32% error of the ICE-MACRO
491
method, as well as the need for testing, learning and validating the networks, which generates the
492
need to build a very large database. The advantage of the ICE-MACRO model is that it is also based
493
on the BIM model, which enables the collection of information about the civil structure as well as fast
494
and easy access to data, such as take-off information.
495
5. Conclusions
496
Based on the analysis above, it can be stated that the ICE-MACRO method accomplishes its
497
task. The errors occurring during the analysis are acceptable in the light of the requirements of
498
various associations or publications. The ICE-MACRO model performs well in comparison to other
499
models when it comes to the mean absolute estimate error and, in particular, the maximum
500
percentage error. It should be noted that two mathematical methods - neural networks and
501
case-based reasoning - prove useful in supporting cost estimation in the early phases of a
construction project. The BIM model, in turn, allows for the storage of information about the
503
construction project and makes it possible to quickly generate basic surface or cubic volume indices.
504
505
Author Contributions: The individual contribution and responsibilities of the authors were as follows:
506
Krzysztof Zima designed the research main idea and collected the data. Authors togeather analyzed the data
507
and the obtained results. Agnieszka Leśniak provided extensive advice throughout the study results and
508
methodology. All the authors have read and approved the final manuscript.
509
Conflicts of Interest: The authors declare no conflict of interest.
510
References
511
512
1. Zavadskas, E.K.; Vilutiene, T.; Turskis, Z.; Saparauskas, J. Multi-criteria analysis of Projects' performance
513
in construction. Archives of Civil and Mechanical Engineering 2014, 14, 114–121.
514
2. Xu, J-W.; Moon, S. Stochastic Forecast of Construction Cost Index Using a Cointegrated Vector
515
Autoregression Model. Journal of Management in Engineering 2013, 29 (1), 10-18.
516
3. Kaplinski, O.; Tupenaite, L. Review of the multiple criteria decision making methods, intelligent and
517
biometric systems applied in modern construction economics. Transformations in Business & Economics
518
2011, 10, 166-181.
519
4. Gunaydin, H.; Dogan, S. A neural network approach for early cost estimation of structural systems of
520
buildings. International Journal of Project Management 2004, 22 (7), 595–602.
521
5. Oberlender, G.D.; Trost, S.M. Predicting accuracy of early cost estimates based on estimate quality. Journal
522
of Construction Engineering and Management 2001, 127(3), 173-182.
523
6. Yazdani-Chamzini, A.; Zavadskas, E.K.; Antucheviciene, J.; Bausys, R. A Model for Shovel Capital Cost
524
Estimation, Using a Hybrid Model of Multivariate Regression and Neural Networks. Symmetry 2017, 9(12),
525
1-14. doi:10.3390/sym9120298
526
7. Lowe, D.; Emsley, M.; Harding, A. Predicting Construction Cost Using Multiple Regression Techniques.
527
Journal of Construction Engineering and Management 2006, 132 (7), 750–758.
528
8. Juszczyk, M. Application of committees of neural networks for conceptual cost estimation of residential
529
buildings. AIP Conf. Proc. 2015, 1648, 600008.
530
9. Ji, S-H.; Park, M.; Lee, H-S. Cost estimation model for building projects using case-based reasoning.
531
Canadian Journal of Civil Engineering 2011, 38(5), 570–581.
532
10. Marzouk, M.; Ahmed, R. A case-based reasoning approach for estimating the costs of pump station
533
projects. Journal of Advanced Research 2011, 2 (4), 289–295.
534
11. Sawalhi El, N.I. Modeling the Parametric Construction Project Cost Estimate using Fuzzy Logic.
535
International Journal of Emerging Technology and Advanced Engineering 2012, 2(4), 631-636.
536
12. Cheng, M-Y.; Tsai, H-C.; Hsieh, W-S. Web-based conceptual cost estimates for construction projects using
537
Evolutionary Fuzzy Neural Inference Model. Automation in Construction 2009, 18 (2), 164–172.
538
13. Cheng, M-Y.; Tsai, H-C.; Sudjono, E. Conceptual cost estimates using evolutionary fuzzy hybrid neural
539
network for projects in construction industry. Expert Systems with Applications 2010, 37 (6), 4224–4231.
540
14. An, S-H.; Kim, G-H.; Kang, K-I. A case-based reasoning cost estimating model using experience by
541
analytic hierarchy process. Building and Environment 2007, 42 (7), 2573–2579.
542
15. Kim, S.; Shim, J.H. Combining case-based reasoning with genetic algorithm optimization for preliminary
543
cost estimation in construction industry. Canadian Journal of Civil Engineering 2014, 41(1), 65-73.
544
16. Bonenberg, W.; Kapliński, O. The Architect and the Paradigms of Sustainable Development: A Review of
545
Dilemmas. Sustainability 2018, 10, 100.
546
17. Kim, S-A.; Chin, S.; Yoon, S-W.; Shin, T-H.; Kim, Y-S.; Choi, C. Automated Building Information Modeling
547
System for Building Interior to Improve Productivity of BIM-based Quantity Take-Off. Proceedings of
548
International Symposium on Automation and Robotics in Construction (ISARC 2009), 2009, 492-496.
549
18. Monteiro, A.; Martins, J.P. A survey on modeling guidelines for quantity takeoff-oriented BIM-based
550
design. Automation in Construction 2013, 35 (11), 238–253.
551
19. Cheung, F.; Rihan, J.; Tah J.; Duce, D.; Kurul, E. Early stage multi-level cost estimation for schematic BIM
552
20. Liu, H.; Lua, M.; Al-Hussein, M. BIM-based Integrated Framework for Detailed Cost Estimation and
554
Schedule Planning of Construction Projects. Proceedings of The 31st International Symposium on
555
Automation and Robotics in Construction and Mining (ISARC 2014), 286-294.
556
21. Ma, Z.; Wei, Z.; Zhang, X. Semi-automatic and specification-compliant cost estimation for tendering of
557
building projects based on IFC data of design model. Automation in Construction 2013, 30 (3), 126–135.
558
22. Zima, K. Relacyjna baza danych wspomagająca kosztorysowanie na podstawie wnioskowania z
559
przypadków / Relational database supporting cost estimation based on case based reasoning. Materiały
560
Budowlane 2016, 6, 109-111.
561
23. Ociepka, P. Zastosowanie metody CBR do wspomagania procesu projektowo-konstrukcyjnego /
562
Application of CBR method to support design and construction process. Wybrane problemy inżynierskie
563
2011, 2, 287-291.
564
24. Traczyk, W. Inżynieria wiedzy / Knowledge engineering. Akademicka Oficyna Wydawnicza EXIT,
565
Warszawa, Poland, 2010.
566
25. Sekocenbud. Regional price bulletin – BCR, 2014-2017.
567
26. Sekocenbud. Forecasting and indexation bulletin – ZWW, 2014-2017.
568
27. PMI. A guide to the project management body of knowledge. Project Management Institute. Project
569