A Model Interpolating Between Regular And
Scale Free Network With Tunable Exponent
Md. Kamruzzaman, Afrina Sharmin
Abstract: - The purpose of this paper is to investigate a simple network model whereby a new node is either attached to the youngest of t he existing node with probability p or it is attached with probability (1 - p) to any of the existing node following the preferential attachment rule. For the model exhibits power law degree distribution with The model thus nicely interpolates between the regular graph at p = 1 with and the Barabási-Albert model at p = 0 with .
Index Terms: - nodes, links, hubs, preferential attachment rule, power-law degree distribution, fat tail, cumulative distribution.
————————————————————
1
I
NTRODUCTIONNodes and links are the basic constituents of a network and the rules that specify how exactly the nodes and links are to be added determine the topology of the network. Networks are ubiquitous in the world we live in and thanks to the flexibility in the definition of nodes and links. The brains of all living systems can be considered as a large network of nervous systems whose nodes are the nerves linked by axons [1]. At a different organizational level, cells of living systems are networks of molecules linked by chemical interactions between them [2]. There are social networks where nodes are individuals and links are various kinds of interactions depending on the nature of network. For instance, scientists, movie actors, societies etc. are networks of people linked by co-authorships, scientific collaboration, co-starring the same movie, friendships, and professional ties [3]. Networks in technology are also plentiful. Examples include the World-Wide Web, the Internet, power grids, express highway in transportations systems etc. to name just a few [4–6]. The history of networks began with the seminal work of Paul Erdős and Albert Renyi in 1959 with the name graph theory that has developed into one of the mainstays of modern discrete mathematics [3]. The definition of the Erdős-Renyi (ER) model is trivially simple. It assumes that each pair of nodes in the network is connected randomly with pre-assigned probability,
p. The influence of each node in the network is best characterized by its degree k defined as the number of nodes to whom it is connected. In an ER network if there are N nodes and each node is connected to an average of k0 nodes then it
is trivial to show that p = k0 / (N-1), which for large N is usually
approximated by, . The probability that a randomly selected node has k links is given by,
(1)
Where, second equality becomes exact in the large N limit. The degree distribution P(k) of the ER model is therefore Poissonian in character which implies that it is almost impossible to find nodes that have significantly higher or fewer links than the average. Hence it is statistically homogeneous network. Thirty nine years after the ER model, Watts and Strogatz proposed a new generalized model, now known as the Watts and Strogatz (WS) model, which is in fact intermediate between the regular and random graph [3]. It starts with a regular graph where each site is connected to its
k nearest neighbors and then with probability p each edge that links a pair of nodes is reconnected to nodes chosen at random. Interestingly, even for a very small p the graph behaves very differently than the regular as well as the ER model. For instance, the degree distribution P(k) still decays exponentially in the large k limit like it does in the ER model but unlike the ER model it exhibits small average node-to-node or the mean shortest path distance and a large clustering coefficients. These are the basic properties of the phenomena popularly known as the ‘small world’. The idea of small-world was first conceived by the Hungarian writer Frigyes Karinthy in 1929 [8]. Later in 1967 it was tested experimentally by Stanley Milgram [9]. He found that two arbitrary people are connected by only six degrees of separation - a result which is highly counter intuitive. It has been found that the WS model can capture a certain class of small-world phenomena. The WS model was followed by a large number of studies which includes exact results of Barrat and Weigt and at the same time Dorogovtsev and Mendes played a significant role in its further development [10]. In the late 1990s, A. - L. Barabási and his co-workers, R. Albert and H. Jeong, first realized that the network described by random graphs has severe shortcomings as it fails to reproduce the results drawn from many real world phenomena [11]. They in fact revolutionized the notion of the graph theory by recognizing the two mechanisms through which real network, natural or manmade, come into being. The main result of the BA model is that this new class of networks self-organizes into a power-law degree distribution with an extra-ordinarily long tail revealing that a few nodes has astonishingly large number of links while most of the nodes has the least possible number of links - an extra-ordinary revelation. The networks that have power law degree distribution is classified as scale-free network since a power-law distribution neither possess an intrinsic scale nor its average degree k0 convey much information about the network
[11]. Since then the scale-free networks have become one of the leading paradigms in science thanks to their ability to represent real-world networks occurring in a wide range of ________________________
Md. Kamruzzaman, Lecturer at Ahsanullah University of Science and Technology, Dhaka - 1208, Bangladesh. E-mail: [email protected]
Afrina Sharmin, Scientific Officer, IFRD, Bangladesh Council of Scientific and Industrial Research, Dhaka - 1205, Bangladesh.
165
disparate systems.
2 Literature review of Barabási-Albert Model
(BA MODEL)
Barabási and Albert firstly realized that real networks are not static rather they constantly grow with time by addition of new nodes. Secondly, they realized the fact that not every nodes of the existing network competes on equal footing when the question of establishing links with the new nodes are concerned. Instead, they argued that nodes are chosen with probability proportional to the number of links each node already has with other nodes to establish links with the incoming nodes. This is termed as the preferential attachment rule. Barabási and Albert then presented a simple theoretical model incorporating both the ingredients and proved that the two mechanisms were indeed the real shortcomings of the then models [11]. The new idea of Barabási and Albert and the new terminology, scale-free growing network, has attracted physicists, mathematicians and computer scientists all alike resulting in a surge of research in the network theory. The primary focus of most of these studies was on the power-law degree distribution near the tail and its exponent. The tail may have relatively few data points but it contains considerably more weight than the complete functional form of the degree distribution as they represent the hub which ultimately dominates the overall behavior of the network. For instance, most natural or manmade scale-free networks show a great degree of resilience to random attacks thanks to those scarce data points at the tail [12]. Perhaps, it is the property that being exploited by the natural selection processes in many networks ranging from ecology and epidemiology to neuroscience. Indeed, the nodes with astonishingly large number of links are the most precious ones in the network that need to be protected from random attack in order to remain minimally functional at least. This is done by mixing them to hide among more than 90% of the nodes which hardly have one or two links. The phenomenal success of the BA model lie not only in its simplicity but also in the fact that most experimental data do exhibit power-law degree distribution near the tail and the exponent of the power-law can be easily obtained from the log-log plots of experimental data. Networks can therefore be divided into two major classes depending on the nature of their degree distribution, P(k). One class of network has P(k) that peaks at a mean degree k0and decays
exponentially on either side of k0value such as random graph
of ER model and the small-world phenomenon of WS model. Our focus in this article, however, is on the other class of network that has power-law degree distribution, of the BA model. It has been found that many of the real networks have exponent that cover a wide spectrum of values
which in some occasions may also go outside this range [5, 6]. It is therefore extremely important to have variants of the BA model suitable for different physical conditions which will eventually enable us to understand the mechanisms responsible for tuning the value. Although the BA model can capture the essential features of scale-free network but it is still a minimal model. However, a significant progress has already been made in pursuit of finding variants of the BA model. For instance, non-linear growth and preferential attachment, linear growth with combination of both preferential and random attachments, growth of network based on popularity and fitness and growth of network by addition, rewiring and removal of links etc. are just to name a few [6, 13,
14]. Importance of developing models to mimic these networks can hardly be exaggerated. In this paper, we considered a generalized version of the BA model that interpolates between regular graph and scale-free (SF) network as far as the degree distribution was concerned through a tunable parameter.
3
G
ENERALIZEDB
ARABÁSIA
LBERTM
ODELThe generalized BA model has been defined as follows. The model starts with an initiator which is a fully connected network containing a few nodes m0 labeled as 1,2,…………,m0
and assign a probability p with which links will be established with the incoming nodes. The network then grow ad infinitum by addition of one node with m links, we assumed m=1, at each time step. For convenience we label each nodes of the network in the following. In the (i-1)th step the node to be added is labeled as m0+j while the already existing networks
have nodes labeled as 1,2,………,m0……….,m0+(j-1) each
containing number of links respectively and assume
(2)
We now take an interval [0, 1] of unit length and subdivide it
into and refer
them to node 1,2,………,m0+(j-1) respectively. The algorithm
for one time unit of the model at the jth step can be described as follows,
(i) Add a new node and label it as m0+j.
(ii) Generate a random number R1.
(iii) If go to step (iv); Otherwise go to step (vi).
(iv) Establish a link between the new node m0+j with the
youngest of the existing node m0+(j-1).
(v) Increase the time by one unit and go to step (i).
(vi) Generate another random number R2.
(vii) Find the subinterval that contains R2 and pick the
corresponding node that it represents.
(viii) Establish link between the new node and the node being picked in step (vii).
(ix) Increase time by one unit and go to step (i).
(x) Repeat the steps (i)-(ix) ad infinitum.
Steps (iii)-(iv) of the algorithm ensures that an incoming node establish link with the youngest of the existing network with probability p and steps (vi) to (viii) ensures that with probability
(1-p) the incoming node establish link with one of the existing node picked following preferential attachment rule. A numerical simulation has been performed based on the algorithm (i)-(x).
3.1DEGREE DISTRIBUTION
(3)
where, is known as the degree exponent [11]. The degree distribution curves for all the values of the probability exhibit power-law nature. The distribution is so extreme that if the full range is shown on the axis, the curve would be a perfect L
shape. It is interesting to observe all of these degree distribution curves that the tail end of the distribution is ‘messy’ which means that there are only a few sites with a large number of visitors [11]. This tail portion of the curves is popularly known as the ‘Fat Tail’.
3.2FAT TAIL
A fat tail is a property of some probability distributions which exhibits extremely large swelling particularly relative to the ubiquitous normal which itself is an example of an exceptionally thin tail distribution. The term ‘fat tail’ is a reference to the tendency of many financial instrument price and return distributions to have more observations in the tails and to be thinner in the midrange than a normal distribution. Fat tail distribution shows power-law decay. The fat tail may exhibits relatively few data points but it contains considerably more physical significance than the complete functional form of the degree distribution. The tail region represents the hubs which ultimately dominates the over-all behavior of the network [15].
3.3CUMULATIVE DISTRIBUTION
In probability theory and statistics, the cumulative distribution function (CDF) describes the probability distribution of a real-valued random variable X. Cumulative distribution functions are also used to specify the distribution of multivariate random variables. For any real number x, the CDF of a real-valued random variable X is given by,
(4)
The right-hand side of this equation represents the probability that the random variable X takes on a value less than or equal to x. In terms of the probability density function f, the CDF of X
can be defined as follows,
(5)
Differentiating the above equation we get the cumulative distribution function
(6)
Now considering and , the
above equation becomes
(7)
Eq. (7) shows that the cumulative distribution follows the power law degree distribution and we get the degree exponent from Eq. (7) [11].
4
R
ESULTS ANDD
ISCUSSIONAn extensive Monte Carlo simulation [16] for network size of was performed for various different assigned probabilities p. For instance, a probability p of 0 to 1 was
assigned and then the program was run to collect the data for degree distribution and its behavior. The main goal was to investigate how the value of the degree exponent varies with the increase of the assigned probability p.
4.1 DEGREE DISTRIBUTION
167
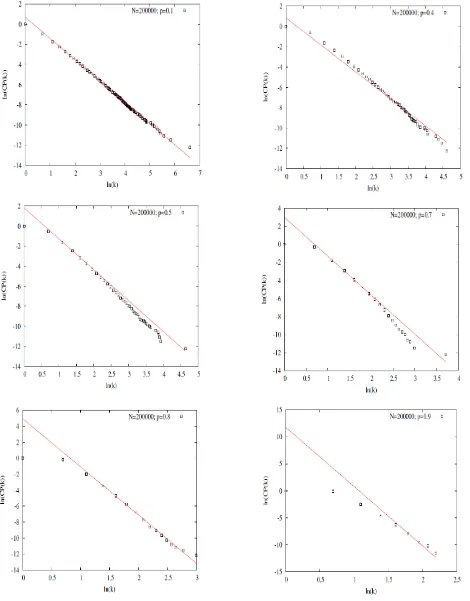
169 4.2CUMULATIVE DISTRIBUTION
From the cumulative distribution curves as in Fig. (2), it was observed that there was no fat tail region comparing to the degree distribution curves. The cumulative distribution curves are linear to best fit for finding the value of the exponent with different values of p [4, 20]. Fitting the cumulative distribution, we got the value of which are given in Table (1).
TABLE 1
VALUE OF FOR DIFFERENT PROBABILITY p
Assigned probability p
Simulated value of the degree exponent
0.1 3.11076
0.2 3.26796
0.3 3.4169
0.4 3.65521
0.5 4.08268
0.55 4.23335
0.6 4.51746
0.65 4.83209
0.7 5.31727
0.75 6.08441
0.8 7.03356
0.9 11.9742
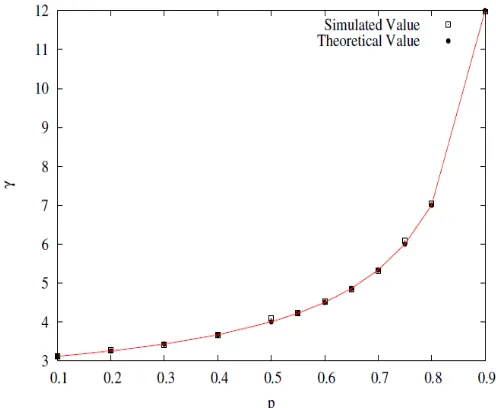
In this work it has been found that the degree distribution exhibits power law for all values of p. However, from Fig. (3), it was found that the exponent increases as increases. The effort then was to quantify the extent of growth of with p. To this end we propose an adhoc formula for a function of p and then verify it using our numerical data. The proposed formula for is,
(8)
In Fig. (3), the dots represent the theoretical value of derived from Eq. (8) and the square boxes represent the simulated value of and it is found that the numerical simulated values and the theoretical values from our proposed formula of Eq. (8) were nearly close to each other. At p = 0, the value of is 3 which is same to the Barabási model [6]. At p = 0.1 and p = 0.4, the maximum nodes of the existing network have a large number of links with other nodes in the existing network as we saw from the degree distribution curves of Fig. (1). A few of the nodes in this case follow the regular graph while most of the nodes attach with the hubs of the existing network [21]. When
p increases, the value of successively increases from the value of the BA model and tried to go towards infinity as we saw from Fig. (3) i.e., the probability of the new node to attach to the youngest node also increases. At p = 0.8 and p = 0.9, the number of hubs in the existing network is very small as showed in Fig. (1). Majority of the new nodes which attach to the existing nodes have been linked with the youngest nodes.
From the adhoc formula of Eq. (8), we see that at , means that there is a Dirac-Delta function at k = 2, where k is the average degree of a node in a network [6].
Fig. 3: Degree exponent vs probability p curve.
When all the nodes in the network have only two links they completely form as a linear lattice and no preferential rule is followed here. Fig. (3) shows a good agreement of the analytical results with the numerical values obtained from Eq. (8). Consequently, a phase transition occurs between scale free network and regular network if the value of is tuned [22]. Incoming nodes establish link to the youngest of the existing nodes with probability p and with probability (1-p) they link to any of the existing nodes following the preferential attachment rule [6].
5
C
ONCLUSIONIn this paper, a model has been analyzed that interpolates between regular graph and scale free network. A network system was considered that has power-law degree distribution of the BA model. The values of in most of the real networks cover a wide spectrum of values 2 to 4 which in some occasions may also go outside of this range [5, 6]. It is quite natural that in some cases network may grow not following the preferential attachment rule alone; rather, it may prefer to enjoy some degree of flexibility. We considered a generalized version of the BA model in which the new node is either attached to the youngest of the existing node with probability p or it is attached to any of all the existing nodes following the preferential attachment rule with probability (1-p).
A
CKNOWLEDGMENTSThe authors would like to convey their sincere gratefulness to Professor Dr. M. Kamrul Hassan, Department of Physics, University of Dhaka, for supervision of this work. Authors would like to express heartfelt thanks to Dr. Abu Zafur Ziauddin Ahmed, Department of Theoretical Physics, University of Dhaka, Mr. Muhammad Sajjad Hossain, Assistant Professor and Mr. Iftekhar Arafath, Assistant Professor, Department of Arts and Sciences, Ahsanullah University of Science and Technology for their encouragements and important suggestions throughout this work.
References
[1] Bullmore E, Sporns O, Complex brain networks: Graph theoretical analysis of structural and functional systems, Nat Rev Neurosci, vol. 10, pp. 186-198, 2009.
[2] Craciun, G., and M. Feinberg, Multiple equilibria in complex chemical reaction networks: I. The injectivity property, SIAM J. Appl. Math., vol. 65, pp. 1526-1546, 2005.
[3] D.J. Watts and S.H. Strogatz, Collective dynamics of ‘small-world’ networks, Nature, vol. 393, pp. 440, 1998.
[4] R. Albert, H. Jeong, and A.-L. Barabasi, Diameter of the world wide web, Nature, vol. 401, pp. 130, 1999.
[5] A.-L. Barabasi and R. Albert, Emergence of Scaling in Random Networks, Science, vol. 286, pp. 509, 1999.
[6] R. Albert, A.-L. Barabasi, Topology of evolving networks: local events and universality, Physical Review Letters, vol. 85, pp .5234-5237, 2000.
[7] P. Erdos and A. Renyi, On the evolution of random graphs, Publ. Math. Inst. Hung. Acad. Sci., vol. 5, pp. 17, 1960.
[8] F. Karinthy. Chains, In Everything is Different, Budapest, 1929.
[9] S. Milgram. The small world problem, Psychology Today, vol. 1, pp. 63, 1967.
[10]A Barrat and M. Weigt, On the properties of small-world network models, European Physical Journal B- Condensed Matter, vol. 13, pp. 547, 2000.
[11]R. Albert, A.-L. Barabasi, Statistical mechanics of complex networks, Reviews of Modern Physics, vol. 74, pp. 47-97, 2002.
[12]A.-L. Barabasi, R. Albert and H. Jeong, Mean-field theory for scale-free random networks, Physica A, vol. 272, pp. 173, 1999.
[13]Z. Liu, Y-C Lai, N. Ye and P. Dasgupta, Connectivity distribution and attack tolerance of general networks with both preferential and random attachments, Physics Letters A, vol. 303, pp. 337-345, 2002.
[14]S.N. Dorogovtsev, J.F.F. Mendes, Exactly solvable small-world network, Europhys. Lett., vol. 50, pp. 1-7, 2000.
[15]Oliver Hein, Michael Schwind, Wolfgang Konig, Scale-Free Networks The Impact of Fat Tailed Degree Distribution on Diffusion and Communication Processes, WIState-of-the-Art, vol. 48, pp. 267275, 2006.
[16]David P. Landau, Kurt Blinder, A Guide To Monte Carlo Simulations In Statistical Physics, Cambridge 356 University Press, 2005.
[17]Jun Ohkubo, Kazuyuki Tanaka, Fat-tailed degree distributions generated by quenched disorder, Inter. Journal Complex Systems, pp. 1650, chap. 1, 2006.
[18]Bollobas, B., Random Graphs, (London) Academic Press, 1985.
[19]Goldstein, Michel L., Steven A. Morris, and Gary G. Yen, Problems with fitting to the Power-law distribution, The Euro. Phys. Jour. B-Cond. Mat., vol. 41(2), pp. 255258, 2004.
[20]S. Redner, How Popular is Your Paper? An Empirical Study of the Citation Distribution, Eur. Phys. Jour. B, vol. 4, pp. 131-134, 1998.
[21]A.-L. Barabasi, The origin of bursts and heavy tails in humans dynamics, Nature, vol. 435, pp. 207, 2005.