Open Access
Proceedings
Colour model analysis for microscopic image processing
Gloria Bueno*
1, Roberto González
1, Oscar Déniz
1, Jesús González
2and
Marcial García-Rojo
2Address: 1Escuela Técnica Superior de Ingenieros Industriales, Universidad de Castilla-La Mancha, Avda. Camilo José Cela, s/n, 13071 Ciudad Real, Spain and 2Hospital General de Ciudad Real. Calle Tomelloso s/n. 13004 Ciudad Real, Spain
Email: Gloria Bueno* - [email protected] * Corresponding author
Abstract
This article presents a comparative study between different colour models (RGB, HSI and CIEL*a*b*) applied to a very large microscopic image analysis. Such analysis of different colour models is needed in order to carry out a successful detection and therefore a classification of different regions of interest (ROIs) within the image. This, in turn, allows both distinguishing possible ROIs and retrieving their proper colour for further ROI analysis. This analysis is not commonly done in many biomedical applications that deal with colour images. Other important aspects is the computational cost of the different processing algorithms according to the colour model. This work takes these aspects into consideration to choose the best colour model tailored to the microscopic stain and tissue type under consideration and to obtain a successful processing of the histological image.
Background
A challenge still facing scientists is the efficient analysis and management of biomedical data, including images. Advances in biomedical imaging diagnosis have been pos-sible thanks to the development of new imaging technol-ogies. Anatomical Pathology has also benefited from these new technologies, which have provided solutions for whole slide scanning by means of motorized micro-scopes and scanners [1], that is, whole slide imaging (WSI). However, the image processing performed with these slides is still limited both in data processed and processing methods.
Much research has been carried out on the development of algorithms for histological image analysis. Most of them are based on the segmentation of just one region of interest (ROI), which is usually the nucleus, and its classi-fication for diagnosis purposes. To this end, statistical information techniques, region growing algorithms, active contour models and morphological methods have been used for ROI detection and processing [2-5].
The main problem with these methods is that they are not designed to process large amounts of data, which is the case when working with WSI in pathology. Besides that, many of these methods show limited results because they are mainly focused on a single structure or a type of tissue. from 9th European Congress on Telepathology and 3rd International Congress on Virtual Microscopy
Toledo, Spain. 15–17 May 2008
Published: 15 July 2008
Diagnostic Pathology 2008, 3(Suppl 1):S18 doi:10.1186/1746-1596-3-S1-S18
<supplement> <title> <p>New trends in digital pathology: Proceedings of the 9th European Congress on Telepathology and 3rd International Congress on Virtual Microscopy</p> </title> <editor>Marcial García Rojo, Gloria Bueno García and José Sacristán París</editor> <note>Proceedings</note> </supplement>
This article is available from: http://www.diagnosticpathology.org/content/3/S1/S18
© 2008 Bueno et al; licensee BioMed Central Ltd.
There is a need to develop more general and efficient image processing methods. To this end the colour model should be analysed, as well as the distance colour model applied to the processing algorithm in order to reduce the computational cost and obtain, in an efficient way, a set of heterogeneous, complex and specific image analysis. In this work different colour models and distances have been studied and applied under a general parallel image-processing model designed and implemented with MPP (Massively Parallel Processing).
Methods
There are three main colour models:
RGB: channel Red, channel Green and channel Blue,
HSI: channel Hue, channel Saturation and channel Inten-sity,
L*a*b*: channel Luminance, channel a*, that is, range of channel between Red to Green and channel b* that is range of colours between Yellow to Blue.
All colour models have their advantages and drawbacks. It is necessary to identify which colour model is suitable to represent and reproduce the ROI under consideration for each tissue type and WSI modality. Analysing the distance colour formulae applied between two colours may do this,
,
,
.
The distances considered within this study are: the Eucli-dean distance for the RGB model (Equation 1), the NBS colour distance formulae for HSI model (Equation 2) and the CIEDE2000 for the CIEL*a*b*, colour model (Equa-tion 3).
Where KL, Kc, KH are weight factors and the rest of compo-nents, SL, SC, SH, C', H', may be calculated by means of the, {L*, a*, b*} coordinates [6].
Moreover, another aspect to be considered is how to deal with the colour coordinates, that is as a vector or in a mar-ginal way. These aspects have been analysed within this work. To this end the 3*2 distances to the most represent-ative colour ROIs and statistically identified on the image were calculated on different WSI, which is to prostate biopsies and lung cytology stained with hematoxiline-eosine (HEO), inmunohistochemistry and papanicolau. The images were obtained by the ALIAS II automatic microscope and the processing was done using our own libraries, implemented by the research group, running under MPI on a grid composed by 17 nodes Intel XEON (3,2 GHz) INFINIBAND net (10 GB full-duplex) architec-ture. The results are shown as follows.
Results
The results applied to microscopic images show that the Euclidean and NBS vector distance for the RGB and HSI model respectively distinguish between different ROIs but the vector CIEDE2000 distance for the CIEL*a*b* model reproduces in a better way, the original colour. However, the computational cost of the last one is higher than the other two colour models.
Figure 1 shows the result for a biopsy stained with Hema-toxiline-Eosine and Figure 2 for a cytology stained with Papanicolau.
The computational cost for the three colour distance vec-tor models against different number of ROIs is shown in Figure 3.
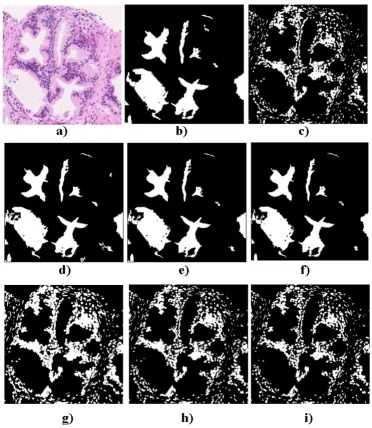
To quantify the goodness of the distance formulae a ROC analysis has been carried on. Figure 4 shows this analysis for two ROIs in a prostate biopsy at 10× stained with HEO. The true pixels belonging to the ROIS were indi-cated by experts at Hospital General Ciudad Real. Figure 4b) and 4c) show the true values for the two regions of interest, the glandular light and the nucleus, extracted from the original image (Figure 4a). Figure 4d) to i) show the different colour distance results for these two regions. Finally, Table 1 shows the ROC analysis for the Eucludian, NBS and CIEDE2000 colour distance for the RGB, HSI and CIEDEL*a*b* models. It is shown that the % of spe-cificity is higher for the CIEDE2000 distance with lower value of FP.
d x y
(
G G,)
G
x=(x x1, 2,x3)
G
y=( ,y y1 2,y3)
d x y
(
G G,)
=(
x1−y1)
2+(
x2−y2)
2+(
x3−y3)
2( )
d x y
(
G G,)
= . ∗ x y −cos⎛ H S I⎝⎜ ⎞ ⎠⎟ ⎛ ⎝ ⎜ ⎞ ⎠ ⎟ + +
(
)
1 2 2 1 2
100 4
2 2 2
2
πΔ Δ Δ
ΔE ΔL Δ Δ Δ
K LSL
C K CSC
H
K HSH R
C K CS
T 00
2 2 2
Conclusion
This article has presented a comparative study between RGB, HSI and CIEL*a*b* colour models applied histolog-ical images. This analysis, in turn, allows both distinguish-ing possible regions of interest and retrievdistinguish-ing their proper colour for further region analysis.
The results applied to prostate biopsies stained with HEO and lung cytologies stained with papanicolau show that the vector CIEDE2000 distance for the CIEL*a*b* model reproduces in a better way the original colour.
Therefore, this comparison does allow us to choose the best colour model tailored to the microscopic stain and tissue type under consideration to obtain a successful processing. Moreover, a compromise between the compu-tational cost and the results focus always to distinguish between different colour detection and colour retrieval for further ROI analysis should be kept. The colour model should be taken into consideration when defining
stand-ards for histological images. Computational cost of the colour distances vs. number of ROIsFigure 3 Computational cost of the colour distances vs. number of ROIs. Computational cost for the different col-our models against the number of ROIs analysed.
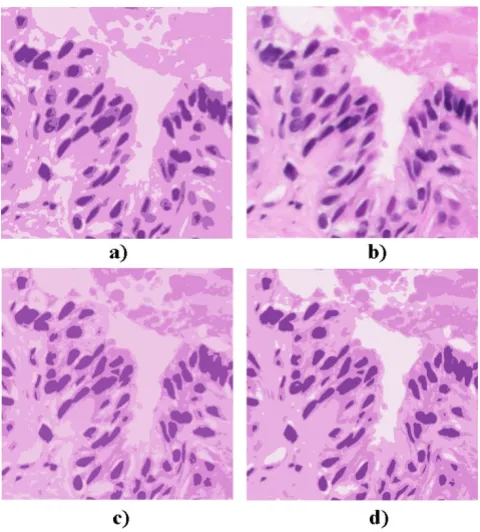
Colour distances for ROI detection applied to biopsies Figure 1
Colour distances for ROI detection applied to biop-sies. a) Original Image, b) RGB (Euclidean), c) HSI (NBS), d) CIEL*a*b (CIEDE2000). Colour distances for ROI detection applied to biopsies.
Colour distances for ROI detection applied to cytology Figure 2
Colour distance validation Figure 4
Colour distance validation. a) Original Image, b) True section of glandular light, c) True section of nucleus, d) RGB (Eucli-dean), e) HSI (NBS), f) CIEL*a*b (CIEDE2000), g) RGB (Eucli(Eucli-dean), h) HSI (NBS), i) CIEL*a*b (CIEDE2000). Colour distances validation on different ROIs.
Table 1: ROC analysis of the colour distance formulae for two ROIs
GLANDULAR LIGHT FP FN TP Specificity
RGB (Euclidean) 0.016563 0.066931 0.933069 0.983437
HSI (NBS) 0.006758 0.090020 0.909980 0.993242
CIEL*a*b* (CIEDE2000) 0.004757 0.100714 0.899286 0.995243
NUCLEUS FP FN TP Specificity
RGB (Euclidean) 0.154218 0.040697 0.959302 0.845782
HSI (NBS) 0.099283 0.109053 0.890947 0.900717
Publish with BioMed Central and every scientist can read your work free of charge
"BioMed Central will be the most significant development for disseminating the results of biomedical researc h in our lifetime."
Sir Paul Nurse, Cancer Research UK
Your research papers will be:
available free of charge to the entire biomedical community
peer reviewed and published immediately upon acceptance
cited in PubMed and archived on PubMed Central
yours — you keep the copyright
Submit your manuscript here:
http://www.biomedcentral.com/info/publishing_adv.asp
BioMedcentral
Acknowledgements
This work has been possible thanks to project MEC DPI2004-01346 carried out at Engineering School in collaboration with Hospital General at Ciudad Real.
This article has been published as part of Diagnostic Pathology Volume 3 Sup-plement 1, 2008: New trends in digital pathology: Proceedings of the 9th European Congress on Telepathology and 3rd International Congress on Virtual Microscopy. The full contents of the supplement are available online at http://www.diagnosticpathology.org/supplements/3/S1
References
1. Rojo M G, García GB, Mateos CP, García JG, Vicente MC: Critical comparison of 31 commercially available digital slide sys-tems in pathology. Int J Surg Pathol 2006, 14:285-305.
2. Gao M, Bridgman P, Kumar S: Computer aided prostate cancer diagnosis using image enhancement and JPEG2000. Proc SPIE International Conf on Applications of Digital Image Processing 2003,
5203:323-334.
3. Li Y, Lu D, Lu X, Liu J: Interactive colour image segmentation by region growing combines with image enhancement based on bezier model. Proceedings of the Third International Conference on Image and Graphics (ICIG'04) 2004, 100:96-99.
4. Begelrnan G, Gur E, Rivlin E, Rudzsky M, Zalevsky Z: Cell nuclei segmentation using fuzzy logic engine. IEEE Intern Conference on Image Processing 2004:2937-2940.
5. Hu MP, Ding XY: Automated cell nucleus segmentation using improved snake. Proc Intern Conference on Image Processing 2004,
4:2737-2740.