117
Mobile Subscriber Mobility Analytics And
Prediction In Wireless Networks Using Machine
Learning Techniques
Oscar L. Mwale, Peter K. Kihato, Agnes Mindila
Abstract: In radio network planning user mobility is an important factor that can reveal the user’s needs and hence allows the proactive adaptation of services. By predicting mobility of subscribers, the network can do proactive resource management and take prior precautionary measures when need arises. This paper presents a machine learning prediction algorithm that be used in capturing some of the mobility patterns exhibited by the users moving in a wireless environment and can then predict the future locations of these users. To identify the important locations of the target user from his/her trajectory the data is analyzed to find out insights in terms of movement of the subscribers and mobile data used. An unsupervised clustering technique using Density-based spatial clustering of applications with noise (DBSCAN) is performed to extract various clusters for different locations. Finally, to predict the location of the subscribers into the clusters/locations above several supervised machine learning classifier models are proposed with Random forest showing the best results. When tested on real data, the model achieved 94% of the future locations’ prediction accurately. In a future work, future locations predicted will be used to proactively and dynamically allocate mobile resources to the subscribers.
Index Terms: Density Based Clustering, Data Mining, Location prediction, Logistic Regression, Machine Learning, Naïve Bayes, Random Forest, Support Vector Machines, Trajectory,
—————————— ——————————
1
INTRODUCTION
understanding network traffic behavior is important in today’s wireless networks evolution. This results in highly efficient planning and management of a network’s bandwidth resources. Early reservations of radio resources in future locations of users’ mobile trajectory helps to optimize network resource allocation as it is limited and to sustain the required Quality-of-Service (QoS)[1]. An ubiquitous system will have the devices blend into the background and be aware of the user’s current context. The systems are therefore required to be proactive and so progress from the context-awareness to contextual intelligence [2]. To be smart and proactive, the systems should in a position to infer the user’s intent [3] and hence be able to predict the future and take precautionary measures. Mobility prediction algorithm in wireless environments should be effective in controlling overhead, ensure that there is not much change in present networks structure, have clear knowledge of geographical areas, be user intensive and be adaptable to regular/random user moves. User mobility can be predicted based on velocity and positional co-ordinates of the cell structure, through location techniques like GPS [4]. In addition, users’ previous movement patterns stored in Mobility History Bases (MHB) can be exploited or take recourse to stochastic models. This paper has been arranged as follows; Section two discusses related works on prediction and highlights the novelty of our work. Sections three highlights the proposed approach of data
preparation, analytics and modelling. Section four explains our approach in location prediction based on several machine learning algorithms. Section five then provide the prediction results while the last section has the discussion, conclusions and recommendations for future works.
2 RELATED
WORK
Several research and studies have been conducted under the prediction topic as shown in [5-8]. The purpose of these works is to present new prediction techniques to increase the proactivity and the dynamic nature of various systems with an emphasis on pervasive systems.
2.1 Overview of Prediction Techniques
Many research works have published research concerning the general context prediction technique. Quoting some of related surveys in [9] and [10]; The most known techniques of context and location prediction [11] are the classification algorithms in machine learning area which include Naïve Bayes, KNN, Random Forests, Neural network amongst others. From other fields and techniques used include Alignment in computational biology, Active LeZi in data compression, and branch prediction of microprocessor that uses a state predictor. Amongst other some are cited below;
a. Markov chains (context prediction)
With a finite number of states, the Markov Chains are modelled. The non-overlapping states allow us to infer user’s habits for historical sequences hence are normally used for short-term location scenarios. [12].
b. Expert systems and decision trees
This technique produces prediction rules. Non-linear interaction between variables can be handled. Since outliers do not affect them they perfectly handle both numerical and categorical [13]. This system has promising results and can be easily adaption.
c. Ensemble classifiers
These can improve performance of location and context prediction since they take advantage of the individual algorithm in the data parts [14]. The most common ways of ————————————————
Oscar L. Mwale is currently pursuing master’s degree program in
electrical engineering(Telecommunication Option) at Pan African University Institute for Basic Sciences, Technology and Innovation (PAUSTI), Kenya, E-mail: [email protected]
Peter K. Kihato is currently a senior Lecturer at Jomo Kenyatta
University of Agriculture and Technology, Department of Electrical Engineering, Kenya, E-mail: [email protected]
Agnes Mindila is currently a senior Lecturer at Jomo Kenyatta
combining classifiers include Boosting, Voting and Bagging [15].
2.2 Related Work for Location-Prediction
Studies on contextual models have shown in that identity , time activity and Locations of the user are important parameters used to determine services a user needs [16] which is the focus point in this paper. Context and location prediction are important factors that allows network providers to provision appropriate service for better QoS and hence improving the performance metrics of the context aware applications. As per LZ87 algorithm in [17], Bhattacharya and Das developed many context prediction algorithms. Next users’ location was predicted by using the modified LeZi-Update algorithm. Das used the latter in smart home environment[18]. Gellert and Vintan used Markov chains, [19] to build a model a Hidden Markov Chain (HMM) for next room prediction by user. In [20], they used the HMM for the itinerary prediction [20]. The Markov Decision Process (MDP) an extension of Markov chain was used in next location prediction. Zeibart proposed PROCAB (Probabilistically Reasoning Observed Context-Aware Behavior) for navigation to predict the destination and route based on user habits[21]. This paper uses Machine Learning algorithm to predict next locations as far as base stations are concerned both in long term and short term. In [22] they used the next location framework that considers only one previous location to predict the next unlike this paper that clustered and approached as a classification problem which may not be as accurate as having data collected over time and user profiles analyzed and continuously updated and models allowed to run the new data as shown in this paper. This paper focused more on future locations as far base stations are concerned for dynamic resource allocation and resource management by telecom company unlike the cited paper that is focused on the advertisement model. Mozer and Vintan used neural networks in context prediction [23] and location predicting [24] respectively. In [25], the author assumes users are in certain
locations at given times hence boxing all of them in that place at that time which is not the case in reality e.g assuming all users are at home from 6pm to 7am. It uses a neural network supervised learning while we use a classification models and draw comparisons to choose the best model. This paper explores location prediction as a classification problem based on several historical movements amongst other features by the subscriber and outperforms most of the cited works. While some papers are using only one previous location to predict the single future location this algorithm can be used for prediction into the long term. The future location is the next cluster of base stations a subscriber is likely to latch to hence the use case is for telecommunication companies to employ prudent resource management for continuity of communication for the subscribers to improve QoS.
3
DATA
PREPARATION
AND
ANALYSIS
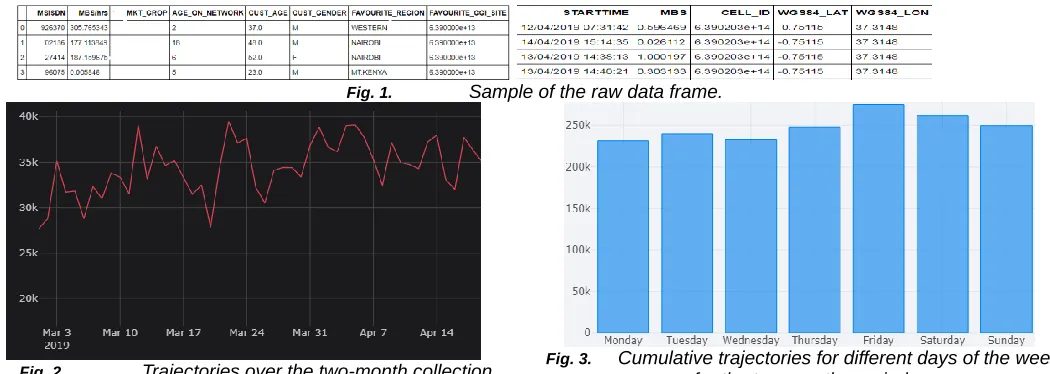
Data for this project was collected from a local telecommunication company with 1000 distinct subscribers and over 2 million observations. The data with several attributes including the GPS co-ordinates, gender, age, timestamp for each location, mobile data used per hour and on the go as user change locations was collected over a two months period for the months of March and April 2019. Sample data frame of the raw data before wrangling and feature extraction is shown in figure 1. A trajectory in this work is any movement from one base station to another. All these features were later used in the machine learning predictive models proposed. Data wrangling and mining [26] was done in python programming language to derive valuable insights. Python analytics tools used included but were not limited to; Numpy,Pandas,Scipy,statsmodels and visualization tools like matplotlib,basemaps and plotly. Data analytics into the various user mobility trajectories as for different hours of the day and days of the week was analyzed trended was as shown in the figures below.
Fig. 1. Sample of the raw data frame.
Fig. 2. Trajectories over the two-month collection
period.
Fig. 3. Cumulative trajectories for different days of the week for the two months period.
119
as from 1800hrs to 2200hrs during which the users are leaving their different work stations to their respective homes. This is shown in figure 4, below;
Fig. 4. Trajectories for different hours of the day
across the observation period.
Coincidentally the amount of bundle consumption correlates to the number trajectories as shown in figure 5 below. This enables the respective firm to draw insights on resource management during peak time most subscribes are on transit.
Fig. 5. Mobile data usage per hour for the
subscribers. Fig. 6. 3.1 Density Based Clustering
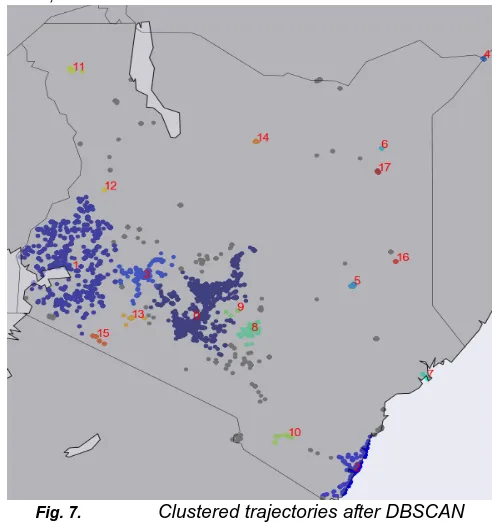
As per [27] a “neighborhood” has to be defined and the density must be calculated according to number of substances in the neighborhood to perform density-based clustering. After data mining and preparation and this being a classification problem, the output needs to take the form of discrete classes. This meant performing preprocessing of the data to group the continuous latitude and longitude coordinates to form a set discrete clusters(locations). This was performed using an unsupervised machine learning algorithm called Density-based spatial clustering of applications with noise (DBSCAN). This algorithm groups together points that are close to each other based on a distance measurement (Euclidean distance was used in this project) and a given number of minimum points. It marks outliers as the points in low-density regions hence not forcing all points into clusters unlike most other clustering techniques like K-Means. There being numerous unique locations to perform any a proper classification only subscribers that had more than 500 trajectories were considered. For example, with the over 2 million observation some subscribers had as few as 5 unique locations. The filtering was done to fix this problem. With a minPoints (min no. of points to form a dense region) of 100 and eps =0.15, 17 distinct clustered were generated. The cluster marked -1 are outliers hence could not
satisfy the parameters above to form a cluster and represented in grey color in the clusters on the map in figure 6, below;
Fig. 7. Clustered trajectories after DBSCAN
3.2 Model Creation and Mobility Prediction
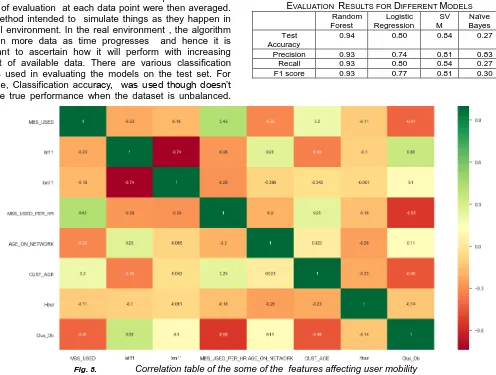
With a set of discrete clusters obtained, features to be used in location prediction were extracted with the target variable being the cluster/location. Several factors affect user mobility and a correlation matrix with a heatmap of all the features is as shown in figure 7, for the numerical variables. This shows the features that are most related to the target variable. This was generated using the Pearson’s correlation coefficient This shows the features that are most related to the target variable and has values between -1 and +1 with the negative and positive sign showing the direction of correlation. Feature selection a core concept in machine learning hugely impacts the performance of the model since irrelevant/partially relevant features negatively impact model performance. A filter method that applies a statistical measure i.e chi-squared statistical tests was used in this study. This is to improve on accuracy reduce overfitting[29].
Some of the features are briefly outlined below;
1. A binary version of the week day. Obtained dummy variables using one hot encoding. encoding since models selected cannot take in labeled data e.g. Monday appears as [1 0 0 0 0 0 0], Tuesday as [0 1 0 0 0 0 0] and so on.
2. A binary version of the favorite region. 3. A binary version of gender
4. Mobile data used per hour 5. Subscribers’ age
6. Subscribers’ age on the chosen network
3.3 Model Selection
4 RESULTS
The first in evaluating the models after they have been developed is to select training and testing data. I split the data into training set and the testing set using the 70:30 rule so that majority of it becomes the training dataset. In testing the models to simulate online learning, we chronologically moved through the dataset to train the data up to the most current data point i.e m-1 and test on the next datapoint i.e m. The results of evaluation at each data point were then averaged. This method intended to simulate things as they happen in the real environment. In the real environment , the algorithm takes in more data as time progresses and hence it is important to ascertain how it will perform with increasing amount of available data. There are various classification metrics used in evaluating the models on the test set. For example, Classification accuracy, was used though doesn’t give the true performance when the dataset is unbalanced.
This being a multi-class classification problem, metrics such as precision and recall are used. Precision shows the number of false positives for each class while recall represents the false negatives. The F1 score is a combination of both the precision and recall for all classes. The results after evaluation of the models are shown in TABLE 1 below;
TABLE 1
EVALUATION RESULTS FOR DIFFERENT MODELS
Random Forest
Logistic Regression
SV M
Naïve Bayes Test
Accuracy
0.94 0.80 0.84 0.27
Precision 0.93 0.74 0.81 0.83
Recall 0.93 0.80 0.84 0.27
F1 score 0.93 0.77 0.81 0.30
Fig. 8. Correlation table of the some of the features affecting user mobility
5
DISCUSSION
Random Forest being and ensemble-learning model i.e aggregates multiple decision trees learning to improve performance has the best performs due its robustness. SVM and Logistic Regression performed well though not as good as Random Forest. SVM does not perform well on few data points hence the poor performance. The dataset was collected over a two months period with rare locations that were less than 500 trajectories being filtered out. Furthermore, we have an imbalance in the number of times each location is captures in the dataset. In any given location history dataset, we have some locations frequently visited than others. The rare locations were filtered out, but places like home and work will always appear more than entertainment clubs or the gym since it is rare to visit these places frequently in a week. Some classifiers can handle this data imbalance well, but others, like SVM, struggles with such data [28]. This could be another reason why SVM performed unsatisfactorily. Naïve Bayes being fast and easy to implement require all the predicators to be independent which
unlikely in most real-life situation. This explains why it performed the poorest among the models tested.
6
CONCLUSIONS
AND
FUTURE
WORK
121
adequately and in advance proactively plan for radio resource allocation amongst other use cases to the subscribers. For instance, scoping to further include more features can be used to predict customer churn as demonstrated in [30].
ACKNOWLEDGMENT
The authors wish to thank the Pan African University Institute for Basic Sciences, Technology and Innovation (PAUISTI) for their support towards enabling me to come up with this paper.
REFERENCES
[1] Jingyuanzhang. Location Management in Wireless Cellular Networks. The Computer Journal, Page 20 of 22, January 2005.
[2] O. Brdiczka, B. Begole, M. Chu, and K. Partridge, "Contextual Intelligence: Scalability Issues in Personal Semantic Networks," 2010.
[3] I. Burbey and T. L. Martin, "A survey on predicting personal mobility," International Journal of Pervasive Computing and Communications, vol. 8, no. 1, pp. 5-22, 2012.
[4] ZainabR.Zaidi and Brian L.Mark, “Real-time Mobility Tracking Algorithm for Cellular Networks Based on Kalman Filtering”, IEEE Transaction on Mobile computing, Vol. 4, No. 2, March/April 2005
[5] A. Boytsov, Context reasoning, context prediction and proactive adaptation in pervasive computing systems. Luleå tekniska universitet, 2011.
[6] A. Boytsov and A. Zaslavsky, "Extending context spaces theory by proactive adaptation," in Smart Spaces and Next Generation Wired/Wireless Networking: Springer, 2010, pp. 1-12.
[7] A. Boytsov, A. Zaslavsky, and K. Synnes, "Extending context spaces theory by predicting run-time context," in Smart spaces and next generation wired/wireless networking: Springer, 2009, pp. 8-21.
[8] J. H. da Rosa, J. L. Barbosa, and G. D. Ribeiro, "ORACON: An adaptive model for context prediction," Expert Systems with Applications, vol. 45, pp. 56-70, 2016.
[9] D. Ameyed, M. Miraoui, and C. Tadj, "A survey of prediction approach in pervasive computing," International Journal of Scientific & Engineering Research, vol. 6, no. 5, pp. 306-316, 2015.
[10] K. David, R. Kusber, S. L. Lau, S. Sigg, and B. Ziebart, "3 rd workshop on recent advances in behavior prediction and pro-active pervasive computing," in Proceedings of the 2014 ACM International Joint Conference on Pervasive and Ubiquitous Computing: Adjunct Publication, 2014, pp. 415-420: ACM. [11] R. Trasarti, R. Guidotti, A. Monreale, and F. Giannotti, "MyWay:
Location prediction via mobility profiling," Information Systems, vol. 64, no. Supplement C, pp. 350-367, 2017/03/01/ 2017. [12] S. Chang, D.-z. WU, X.-z. XIE, and W. Qi, "Temporal Markov
Chain Location Prediction," DEStech Transactions on Materials Science and Engineering, no. ammme, 2016.
[13] A. Boytsov and A. Zaslavsky, "Context prediction in pervasive computing systems: Achievements and challenges," in Supporting Real Time Decision-Making: Springer, 2011, pp. 35-63.
[14] K. C. Lee and H. Cho, "Performance of ensemble classifier for location prediction task: emphasis on Markov Blanket perspective," International Journal of u-and e-Service, Science and Technology, vol. 3, no. 3, p. 2010, 2010.
[15] T. Anagnostopoulos, C. Anagnostopoulos, S. Hadjiefthymiades, M. Kyriakakos, and A. Kalousis, "Predicting the location of
mobile users: a machine learning approach," presented at the Proceedings of the 2009 international conference on Pervasive services, London, United Kingdom, 2009.
[16] G. Abowd, A. Dey, P. Brown, N. Davies, M. Smith, and P. Steggles, "Towards a better understanding of context and context-awareness," in Handheld and ubiquitous computing, 1999, pp. 304-307: Springer.
[17] J. Ziv and A. Lempel, "Compression of individual sequences via variable-rate coding," Information Theory, IEEE Transactions on, vol. 24, no. 5, pp. 530-536, 1978.
[18] S. K. Das, D. J. Cook, A. Battacharya, E. O. Heierman III, and T.-Y. Lin, "The role of prediction algorithms in the MavHome smart home architecture," Wireless Communications, IEEE, vol. 9, no. 6, pp. 77-84, 2002.
[19] A. Gellert and L. Vintan, "Person movement prediction using hidden Markov models," Studies in Informatics and control, vol. 15, no. 1, p. 17, 2006.
[20] R. Simmons, B. Browning, Y. Zhang, and V. Sadekar, "Learning to predict driver route and destination intent," in Intelligent Transportation Systems Conference, 2006. ITSC'06. IEEE, 2006, pp. 127-132: IEEE.
[21] B. D. Ziebart, A. L. Maas, A. K. Dey, and J. A. Bagnell, "Navigate like a cabbie: Probabilistic reasoning from observed context-aware behavior," in Proceedings of the 10th international conference on Ubiquitous computing, 2008, pp. 322-331: ACM.
[22] Where will you go? Mobile Data Mining for Next Place Prediction Jo˜ao B´artolo Gomes1 , Clifton Phua2 , Shonali Krishnaswamy1
[23] L. Vintan, A. Gellert, J. Petzold, and T. Ungerer, "Person movement prediction using neural networks," in First Workshop on Modeling and Retrieval of Context, 2004.
[24] R. Shaptala and A. Kyselova, "Location prediction approach for context-aware energy management system," in Electronics and Nanotechnology (ELNANO), 2016 IEEE 36th International Conference on, 2016, pp. 333-336: IEEE.
[25] Significant Location Detection & Prediction in Cellular Networks Using Artificial Neural Networks Cristian-Liviu Leca* , Ioan Nicolaescu, Cristian-Iulian Rîncu.
[26] Gonzalo E. Paredes,Luis S. Vargas “Circle-Clustering: A New Heuristic Partitioning Method for the Clustering Problem” of WCCI 2012 IEEE World Congress on Computational Intelligence
[27] Wu, G. and Chang E. “Class-boundary alignment for imbalanced dataset learning”
[28] F. Rosita Kamala, P. Ranjit Jeba Thangaiah, “A Novel Two-Stage Selection of Feature Subsets in Machine Learning”, Engineering, Technology & Applied Science Research, Vol. 9, No. 3, 2019, 4169-4175.