*Corresponding author: E-mail: [email protected]
DISCRIMINATION OF TRANSGENIC COTTON SEED USING VISIBLE AND
NEAR-INFRARED DIFFUSE REFLECTANCE SPECTROSCOPY (NIRS)
KAVERI S. BIRADAR, NADAF H.L. AND MALLIKARJUN KENGANAL
National Seed Project, Seed Unit, University of Agricultural Sciences, Dharwad-580 005, Karnataka Received on 30th March, 2010, Revised on 18th Aug., 2010
SUMMARY
Visible/near-infrared (Vis/NIR) diffuse reflectance spectroscopy combined with chemometrics techniques, was used to distinguish transgenic cotton seed from non-transgenics. Two hundred fifty cotton seeds of RCH-2 genotype containing Cry 1Ac gene conferring resistance to lepidopteron pests and the same number of their parent non-transgenic seeds were scanned in the Vis/NIR wavelength spectrum of 400-2500 nm. Modified partial least square (mPLS), partial least square (PLS) and principal component regression (PCR) models were applied for calibration and classification of samples into two groups. The results showed that differences exist between transgenic and non-transgenic cotton seeds and excellent classification can be obtained after optimizing spectral pretreatment. The spectral difference between the two groups are observed at a wavelength range of 1100-1900 nm, which is related to first and second overtone of C-H stretching vibrations and sixth overtone of C=C stretching vibrations. Standard normal variate (SNV) and detrend scatter correction with second derivative data pretreatment using mPLS model could achieve 100% accurate classification for both transgenic and non-transgenic samples. Reliable equations were developed with r = 0.96 and r = 0.92 for calibration and validation set respectively with low standard error of performance (SEP) (0.13) using mPLS model.
Key Words: Chemometrics, Cotton seeds, Regression models, Spectral pre-treatments, Transgenic, Vis/NIR spectroscopy
genetic engineering for commercial purposes and now Bt is playing a central role in protecting crop from major insects pests. To monitor GMOs crops and their products there is need for analytical methods capable of detecting, identifying and quantifying either the DNA introduced or the protein(s) expressed in transgenic plants (Anklam et al. 2002, Bonfini et al. 2001). Ideally the technique for detection of such transgenic should be rapid, easy to use and low cost (Belton et al. 1995).
Near-infrared reflectance (NIR) spectroscopy, a multi-constituent analysis technique, has gained wide acceptance in different fields by virtue of its advantages INTRODUCTION
over other analytical techniques (Blanco and Villar 2003). Near-infrared reflectance is a procedure that can detect and measure the chemical composition of biological materials based on the absorption of NIR radiation by bonds between atoms. Though NIR spectrometers are not precise enough to detect compounds at the DNA concentration level (parts per trillion), but spectral differences caused by larger structural changes (if any) accompanying the modification in their chemical structure might be measurable. Recently, this technique has been used to distinguish transgenic products from conventional ones. Roundup ReadyTM soybeans were detected and segregated from conventional soybeans using partial least squares (PLS), locally weighted regression (LWR) and artificial neural network (ANN) models by NIR spectroscopy (Roussel et al. 2001). Vis/NIR diffuse reflectance spectroscopy combined with multivariate analysis were used to differentiate 70 transgenic tomatoes and 94 of their parents. Partial least-squares discriminant analysis (PLSDA) model with the leave-one-out cross-validation technique after the second derivative pretreatment was proved to have the best satisfactory calibration and prediction ability (Xie et al. 2007). The objective of this study was to apply visible/near infrared (Vis/NIR) spectroscopic technique to investigate the potential of Vis/NIR spectroscopy for distinguishing between transgenic and non-transgenic cotton seeds and to find out a suitable regression model for classification of them.
MATERIAL AND METHODS
Samples
Cottonseeds of RCH-2 genotype, containing Cry1Ac gene conferring resistance to lepidopteron pests and its parent non-transgenic were included in the present study. Two sets of samples of both the groups (transgenic and non-transgenic) (n=500) viz., calibration set consisting of 300 seeds (150 transgenic and 150 of their parents, non-transgenic) and the validation set of 200 seeds (100 transgenic and 100 non-transgenic) were used. The samples for calibration and validation sets were chosen randomly. The well-developed and good quality seeds were chosen for the study.
SPECTRAL MEASUREMENTS
NIR diffuse reflectance spectra were collected by a monochromator NIR spectrometer model 6500 (Foss NIR systems, Denmark) with the range from 400 to 2500 nm, which consisted of a light source of tungsten halogen lamps of 50 W 12 volts. The spectrometer was equipped with silicon detector. For NIRS analysis, the seeds were placed in a special adapter about 3 mm thick, with a diameter of 37 mm and a central hole of 6 mm. For NIRS scanning, the adapter was inserted in a NIRS standard ring cup (IH-0325, Infrasoft International, LLC, Denmark). Before spectra acquisition, a reference spectrum was collected from a standard check cell ( IH-0324A, Infrasoft International, LLC, Denmark). The instrument diagnostics was carried out to test the response of instrument, wavelength and NIR repeatability to avoid the effect of surrounding environment on the instrument performance. The absorbance spectra (log 1/ R) from 400 to 2500 nm were recorded at 2 nm intervals. The method permitted the analysis of about 40 single seeds per hour. Mathematical procedures on the spectral information were carried out with WinISI II Project Manager software, version 1.50 (Infrasoft International, LLC). The calibration equation were developed using partial least square (PLS), modified partial least squares (mPLS) and principal component regression (PCR) models and different math treatments, were tested on the calibration set, to find out the best model.
Spectral data pretreatment
Mathematical treatments used to compensate for scatter-induced offsets employed in this study are: multiplicative scatter correction (MSC), standard normal variate (SNV), detrend and first and second derivative combined with Savitzky–Golay smoothing algorithms (Geladi et al. 1985).
Chemometric methods
information and reduce “irrelevant” information, i.e. interfering parameters. The multivariate regression methods most frequently used in NIR analysis are principal component analysis (PCA), principal component regression (PCR), modified partial least-squares (mPLS) regression (Naes et al. 2002) were proven to be effective in many applications (Andre 2003, Chen et al. 2005, Cozzolino et al. 2003). PCR, PLS and mPLS with Vis/NIR spectra were used to establish models for classification of transgenic and non-transgenic cotton seeds. For calibration, each sample was assigned a dummy variable as a reference value, which is an arbitrary number or letter indicating whether the sample belongs to a particular group or not (Cozzolino et al. 2003). In this case, transgenic samples were assigned a numeric value of 1, and those of non-transgenic assigned 2. The regression equations were then developed by assigning the reference value (dummy variable) for each sample. A sample was considered to be correctly categorized if the predicted value lay on the two sides of the assigned values, 0.5 is the cut off criteria which is similar to those reported by others (Cozzolino et al. 2003, Andre 2003, Xie et al. 2007). Statistics calculated for the calibration models included standard error of calibration (SEC), standard error of performance (SEP) and correlation coefficient (r). It is expected to have ideal models with the lower SEC and SECV as well as the higher r. The equations were validated through cross-validation and further by external validation with 100 seeds not included in the calibration process.
RESULTS AND DISCUSSION
NIR spectroscopy, either in reflectance (NIRS) or transmittance mode (NITS), is a multitrait technique of large-scale application in the analysis of quality traits in food and agricultural commodities (Shenk and Westerhans 1993). At present, there are NIRS/NITS instruments designed for the analysis of single seeds. The detection and measurement of the chemical structural composition of biological materials by NIR is based on the vibrational responses of chemical bonds to Vis/NIR radiations. Specific absorption bands are produced when the frequencies (wavelengths) of NIRS/NITS radiation match the resonating frequencies of a molecular bond in the sample. The most prominent absorption bands
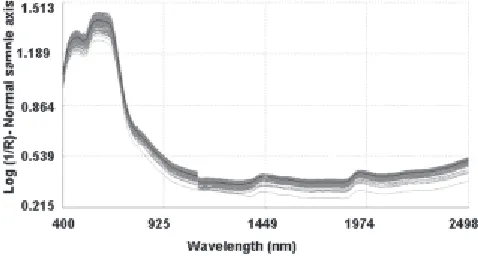
stretching vibration, which were remarkably higher in non-transgenic samples compared to transgenic ones. The average NIR diffused reflectance spectra of transgenic and non-transgenic seeds without any pre processing is shown in Fig. 1. There are many crossovers and overlapping spectra among the samples, which reveals the similarity of spectra between them. Therefore, it is difficult to discriminate the genotypes directly based on diffused reflectance raw spectra.
The spectral variation between two groups were observed after pre-processing of raw spectra with scatter correction (SNV and detrend) and derivative (second) mathematical pretreatments. Since NIR spectra are complex, unintelligible, and have weak absorption bands (Miller 2001) containing chemical and physical information of all sample components, therefore, hardly selective. In order to eliminate systematic variations unrelated to analyte concentrations, like those from multiplicative scatter effects or from base-line drifts, NIR spectra should be conveniently pre-processed.
Fig. 1. Vis/NIR average raw spectra recorded on transgenic and non-transgenic samples of cotton seeds.
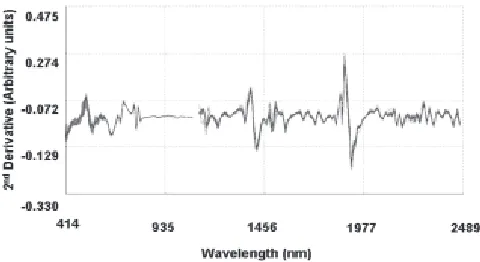
Commonly used light scattering correction techniques are MSC (Helland et al. 1995) and SNV with detrending (Barnes et al. 1989). The variations in the average spectra of non-transgenic and transgenic samples at 1100 to 1900 nm after second derivative pre treatment are shown in Fig. 2a and Fig. 2b respectively.
quantitative studies (calibration methods) of the properties of unknown samples. In the present study mathematical pretreatments SNV and detrend coupled with second derivative (2nd derivative, 6 nm gap, 4 points of smoothing and 1 point second smoothing) gave good results. Weighted MSC performed on par with the SNV and detrend scatter correction and superior to raw spectral data. On the contrary MSC treatment was found to deteriorate the classification for non-transgenic but do yield a better classification of transgenic ones compared with raw spectra (Xie et al. 2007). SNV and MSC are used to correct the light scattering effect to decrease multivariate complexity. The first and second derivatives of spectra are used to remove constant or sloping baselines with added effect in resolution enhancement (Holler et al. 1989, Giese and French 1955). Research has shown the importance of spectral pretreatment to classification and regression, however the choice of best preprocessing techniques relies on statistical testing and the chemometricians experience (Delwiche and Reeves 2004). The importance of spectral data pretreatment in qualitative and quantitative analysis using NIR spectroscopy is highlighted by many of the researchers (Velasco et al. 1999, Pazdernik et al. 1997, Shenk and Westerhans 1993).
Regression models
Performance of different regression models is presented in Table 1. It can be summarized that the models could discriminate samples with a degree of accuracy ranging from 67% to 100%, indicating difference in the performance of the three regression models used in differentiating the two genotypes. Currently, the principal methods applied in multivariate calibration are principal components regression (PCR) and partial least–squares (PLS) regression (Heise and Winzen 2002). PCR uses the principal components provided by PCA to perform regression on the sample property to be predicted. PLS finds the directions of greatest variation by comparing both spectral and target property information with the new axes, called PLS components or PLS factors. PCR could discriminate the samples with a degree of accuracy of 80% compared to 100% accurate using mPLS model. Back propagation (BP) algorithm was used to discriminate transgenic corns Fig. 2a. Vis/NIR second derivative average spectra recorded
on non-transgenic samples of cotton seeds.
Fig. 2b. Vis/NIR second derivative average spectra recorded on transgenic samples of cotton seeds.
and their parents with a wavelength range from 830-2500 nm (Rui et al. 2005). PLS is nowadays more frequently used multivariate calibration method in NIR analysis of forages and oilseed crops (Martens and Naes 1989, Armenta et al. 2007).
The performance of mPLS was found to be superior followed by PLS and PCR model. The PCR model could discriminate with the highest accuracy of 80% only. The most successful results were derived form SNV and detrend scatter correction with second derivative data pretreatment using mPLS model. It could achieve 100% accurate classification for both non-transgenic and transgenic samples. The accuracy of the calibration results obtained on raw spectra without any pretreatment
in all three models was found to be low and ranged from 63% to 82%.
Modified partial least square (mPLS) regression model
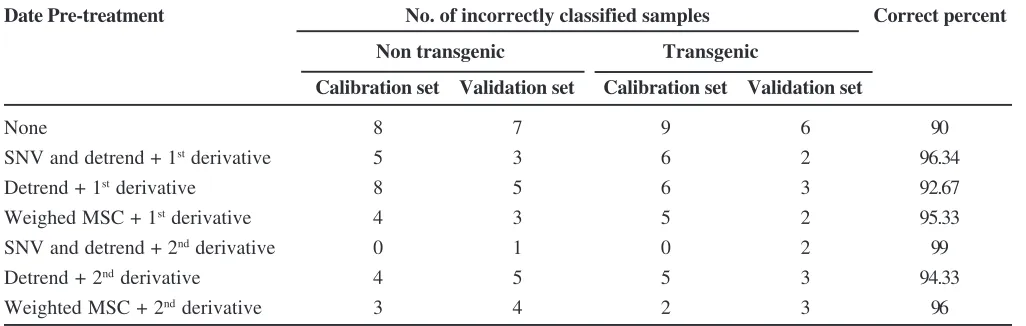
The results of mPLS regression model presented in Table 2 depicts the number of incorrectly classified samples under calibration and validation set. The optimum model involved the spectral data pretreatment with second derivate and SNV and detrend scatter corrections and the percent correct classification of the calibration as well as the validation data set for non-transgenic and non-transgenic was 99%. Calibration statistics of raw spectra recorded classification accuracy to the Table1. Performance of different regression models to differentiate transgenic and non-transgenic cotton seeds.
Date Pre-treatment No. of incorrectly classified samples in calibration set (n=100) using regression models
mPLS PLS PCR
Non Transgenic Non Transgenic Non Transgenic
transgenic transgenic transgenic
None 8 9 20 18 31 37
1st derivative 6 4 8 11 21 24
2nd derivative 5 5 13 9 25 21
SNV and detrend 6 8 6 7 27 29
SNV and detrend + 1st derivative 5 6 2 4 24 22
SNV and detrend + 2nd derivative 0 0 3 5 21 20
Table 2. Cotton seed Classification results of mPLS regression model.
Date Pre-treatment No. of incorrectly classified samples Correct percent
Non transgenic Transgenic
Calibration set Validation set Calibration set Validation set
None 8 7 9 6 90
SNV and detrend + 1st derivative 5 3 6 2 96.34
Detrend + 1st derivative 8 5 6 3 92.67
Weighed MSC + 1st derivative 4 3 5 2 95.33
SNV and detrend + 2nd derivative 0 1 0 2 99
Detrend + 2nd derivative 4 5 5 3 94.33
extent of 90% highlighting the requirement of pretreatment and spectral corrections.
The Vis/NIR predictions of cotton genotypes in the validation set using the mPLS model with the spectra after second derivative treatment is shown in Fig.3. It reveals two distinct groups. The transgenic sample was classified correctly if the value was between 0.5 and 1.5, else the sample was classified wrong and, it was non-transgenic sample if the value was between 1.5 and 2.5. That is to say, the samples using a predicted value of ±0.5 as a cutoff were all considered to be correctly classified by the model. Based on the vibrational responses of chemical bonds to Vis/NIR radiation, the model can discriminate or identify genotypes.
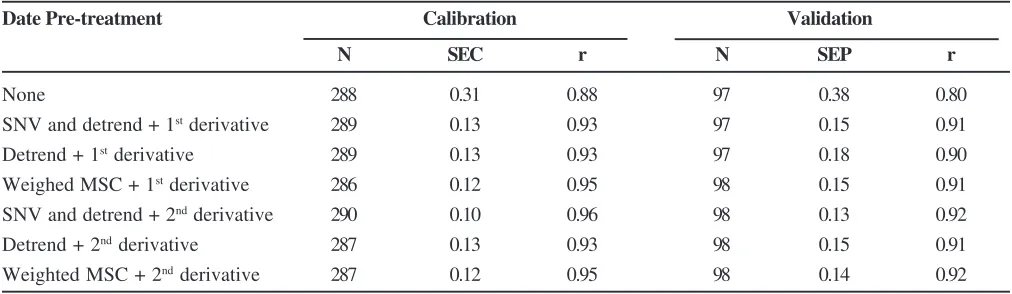
Scatter correction with detrend and first and second derivative treatment performed low recording correct percent classification of 92.67% and 94.33% respectively. The raw spectra after weighted MSC scatter correction recorded correct classification accuracy of 95.33% with first derivative pretreatment and 96% with second derivative pretreatment. The calibration and validation statistics for cottonseed samples using mPLS regression model on the raw spectra and spectra with various pretreatments is given in Table 3. The results indicate that mPLS model developed on the derivative spectra showed better statistics compared with raw spectra.
During the development of regression model, some samples were removed as outliers, form all further data analysis. The best statistics were obtained using SNV and detrend and second derivative pretreatment with r=0.96 and r=0.92 for calibration and validation respectively coupled with low SEC (0.10) and SEP (0.13) values. Weighted MSC after first and second derivative pretreatment recorded an ‘r’ value of 0.95 for calibration set and found to be next best scatter correction after SNV and detrend in developing reliable calibration statistics. Calibration on raw spectra recorded an ‘r’ value of 0.88 and 0.80 for calibration and validation sets respectively with 0.31 (SEC) and 0.38 (SEP) values.
The robustness of the calibration equation is generally decided based on SEC, r2, SECV and 1-VR
Fig. 3. Plot of actual vs predicted values of transgenic (◆) and non-transgenic (▲) cotton seeds using mPLS model
based on second derivative (validation set).
Table 3. Calibration and validation statistics of cotton seed samples using mPLS model on raw spectra and spectra with various pre-treatments.
Date Pre-treatment Calibration Validation
N SEC r N SEP r
None 288 0.31 0.88 97 0.38 0.80
SNV and detrend + 1st derivative 289 0.13 0.93 97 0.15 0.91
Detrend + 1st derivative 289 0.13 0.93 97 0.18 0.90
Weighed MSC + 1st derivative 286 0.12 0.95 98 0.15 0.91
SNV and detrend + 2nd derivative 290 0.10 0.96 98 0.13 0.92
Detrend + 2nd derivative 287 0.13 0.93 98 0.15 0.91
statistics. Lower SEC and SECV with higher r2 values indicate the reliability of the equation (Velasco and Becker 1998). Spectral pre-processing and scatter correction with good regression model (mPLS) are necessary to differentiate the samples belonging two groups with high accuracy. The regression models can discriminate or identify the varieties/genotypes based on the vibrational responses of chemical bonds to Vis/NIR radiations. The best prediction results were obtained after spectral pre-processing with SNV and detrend scatter correction and second derivative pretreatment using the mPLS regression model, with r=0.96 and 0.92 in calibration and validation set respectively. This suggests that mPLS models with spectra after second derivative treatment and SNV and detrend scatter correction contain enough information for discriminating the samples. The correct identification and 100% accurate classification of tomatoes was achieved using discriminate partial least square (DPLS) model (Xie et al. 2007).
This study shows that differences between transgenic and nontransgenic cotton seeds do exist and groups are apparent. Vis/NIR spectroscopy combined with multivariate analysis after the appropriate spectral data pretreatment has been proved to be a very powerful tool for judgment of the relative patterns of the samples that have very similar properties. The result of this study shows that an excellent classification can be obtained by mPLS model after optimizing spectral data pretreatment with accuracy up to 96 %. Hence NIR spectroscopy can be employed for initial classification of samples of different groups on large-scale, where monitoring of quality is on priority and needs to be regulated continuously. The elegance of NIRS technique lays in that, it is fast, relatively inexpensive, and more environmentally friendly compared to costly and laborious chemical and sensory analysis.
REFERENCES
Andre, M. (2003). Multivariate analysis and classification of the chemical quality of 7-aminocephalsporanic acid using near-infrared reflectance spectroscopy. Anal. Chem. 75: 3460–3467.
Anklam, E., Gadani, F., Heinze, P., Pijnenburg, H. and Guy, V.D.E. (2002). Analytical methods for detection and determination of genetically modified organisms in agricultural crops and plant-derived food products. Eur Food Res and Tech 214, 3–26. App. Spectrosc. 55: 425– 1430
Armenta, S., Garrigues, S. and Guardia, M. (2007). Determination of edible oil parameters by near infrared spectroscopy. Anal. Chim. Acta. 596: 330-337.
Barnes, R.J., Dhanoa, M.S. and Lister, S.J. (1989). Standard Normal VariateTransformation and De-trending of Near-Infrared Diffuse Reflectance Spectra App. Spectrosc.
43: 772-777.
Belton, P.S., Kemsley, E.K., McCann, M.C., Ttofis, S., Wilson, R.H. and Delgadillo, I. (1995). The identification of vegetable matter using Fourier transform infrared spectroscopy. Food Chem. 54: 437–441.
Blanco, M. and Villar, A. (2003). Development and validation of a method for the polymorphic analysis of pharmaceutical preparations using near infrared spectroscopy. J. Pharm. Sci. 92: 823-830.
Bokobza, L. (2002). Origin of near-infrared absorption bands, in: Siesler HW, Ozaki Y, Kawata S, Heise HM(Eds.), Near Infrared Spectroscopy: Principles, Instruments, Applications, Wiley-VCH Verlag GmbH, Weinheim, pp. 11 – 41.
Bonfini, L., Heinze, P., Kay, S. and Van Den Eede, G. (2001). Review of GMO detection and quantification techniques. Ispra, Italy, pp. 21.
Chen, Q., Zhao, J., Zhang, H., Liu, M. and Fang, M. (2005). Qualitative identification of tea by near infrared spectroscopy based on soft independent modeling of class analogy pattern recognition. J. Near Infrared
Spectrosc. 13: 327–332.
Cozzolino, D., Smuth, H.E. and Gishen, M. (2003). Feasibility study on the use of visible and near-infrared spectroscopy together with chemometrics to discriminate between commercial white wines of different varietal origins. J. Agric. Food Chem. 51: 7703-7708.
agricultural products. Journal of Near Infrared Spectroscopy. 12:177-182. J. Near Infrared Spectrosc.
12: 177-182.
Geladi, P. Macdougall. D. and Martens, H. (1985). Linearization and scatter-correction for near-infrared reflectance spectra of meat. Appl. Spectrosc. 39: 491– 500.
Giese, A.T. and French, C.S. (1955). The Analysis of Overlapping Spectral Absorption Bands by Derivative Spectrophotometry Appl. Spectrosco. 9: 78 – 96.
Heise, H.M. and Winzen, R. (2002). Fundamental chemometric methods, in: Siesler HW, Ozaki Y, Kawata S, Heise HM (Eds.) Near Infrared Spectroscopy: Principles, Instruments, Applications, Wiley-VCH Verlag GmbH, Weinheim, pp. 125–162.
Helland, I.S., Naes, T. and Isaksson, T. (1995). Related versions of the multiplicative scatter correction method for preprocessing spectroscopic data. Chemon. Intell.
La. Syst. 29: 233–241.
Holler, F., Burns, D.H. and Callis, J.B. (1989). Direct Use of Second Derivatives in Curve-Fitting Procedures Appl.
Spectrosc. 43: 877–882.
Lavine, B.K. (2000). Fundamental Reviews: Chemometrics.
Anal. Chem. 72: 91-98.
Martens, H. and Naes, T. (1989) Multivariate calibration Wiley, New York, pp. 225-289.
Miller, C.E. (2001). Near- infrared technology in the agricultural and food industries, 2nd edition, Chapter 2, ed. By P. C.
Williams.
Naes, T., Isaksson, T., Fearn, T. and Davies, T. (2002). Multivariate calibration and classification, NIR Publications, Chichester, pp. 27–54.
Pazdernik, D.L., Killam, A.S. and Orf, J.H. (1997). Analysis of amino and fatty acid composition in soybean seed, using near infrared reflectance spectroscopy. Agron. J.
89: 679-685.
Roussel, S.A., Hardy, C.L., Hurburgh, C.R. and Rippke, G.R. (2001) Detection of roundup readyTM soybeans by
near-infrared spectroscopy. Appl. Spectrosc.55: 1425–1430.
Rui, Y.K., Luo, Y.B. Huang, K.L., Wang, W.M. and Zhang, L.D. (2005). Application of near-infrared diffuse reflectance spectroscopy to the detection and identification of transgenic corn. Spectrosco. and Spect.
Anal.25: 1581-1583.
Shenk, J. and Westerhans, M.O. (1993). Analysis of agriculture and food products by near infrared reflectance spectroscopy, Infrasoft International Port Matilda, USA.
Velasco, L. and Becker, H.G. (1998). Estimating the fatty acid composition of the oil in intact seed rapeseed (Brassica
napus L.) by near Infra red reflectance spectroscopy.
Euphytica. 101: 221-230.
Velasco. L., Perez-Vich Begona and Fernandez-Martinez, J.M. (1999). Nondestructive screening for oleic and linoleic acid in single sunflower achenes by nearinfrared reflectance spectroscopy. Crop Sci. 39: 219-222.