CODEN (USA)-IJPRUR,e-ISSN: 2348-6465
Original Article
Formulation and In Vitro Evaluation of Floating
Microspheres of Glipizide
A Salomy Monica Diyya*, V Rakesh Kumar
Department of pharmaceutics, Bharat institute of technology-pharmacy, Mangalpally(V), Ibrahimpatnam (M), Rangareddy District, Hyderabad-501510, Telangana, India.
A R T I C L E I N F O A B S T R A C T
_______________________________________________________________________________
1. INTRODUCTION
Diabetes is one of the major causes of death and
disability in the world. Glipizide is used to control
hyperglycemia in type II diabetes.1It is commercially
available as conventional tablets. Drugs that are easily
International Journal of Pharma Research and Health Sciences
Available online atwww.pharmahealthsciences.net
Received: 11 Apr 2015 Accepted: 30 Apr 2015
Objective: The aim of the present study is to develop floating microspheres of Glipizide, an oral rapid- and short-acting anti-diabetic drug from the sulfonylurea class. Glipizide is rapidly and completely absorbed from the gastrointestinal tract. Single unit dosage form of Glipizide causes gastric irritation and when converted to multiple unit dosage like microspheres causes no gastric irritation and maintains a constant drug concentration in the blood plasma for a longer period of time as glipizide is rapidly absorbed and eliminated from the body.
Methods: Preformulation studies like identification tests, solubility analysis, melting point determination, compatibility studies and evaluation of formulation blend are determined by suitable methods. Floating microspheres of Glipizide were prepared by ‘emulsion solvent evaporation technique’by employing polymers like ethylcellulose, HPMC K4M, HPMC K15M and solvents like ethanol, dichloromethane and tween80. Floating microspheres are evaluated for drug entrapment efficiency, particle size by microscopic method, shape and surface morphology by scanning electron microscopy, in vitro drug release studies.
Results:The floating microspheres were evaluated for angle of repose, particle size, percentage yield, in vitro buoyancy, incorporation efficiency, drug polymer compatibility (IR study), scanning electron microscopy, drug release and DSC(Differential Scanning colorimetry), of microspheres. Results show that as the concentration of polymer increases, the particle size, percentage yield, in vitro buoyancy and drug release from microspheres varies. Percentage drug release at the end of 12 hrs was found to be 91%. Microspheres that are prepared by HPMC K15M exhibited excellent Micromeritic properties, percentage yield, in vitro buoyancy, incorporation efficiency and percentage drug release when compared to HPMC K4M and Ethyl Cellulose polymer.
Conclusion:Results clearly indicate that floating microspheres of Glipizide offers a suitable, practical approach to achieve a prolonged gastric residence time and continuous release of the medication over an extended period of time thus oral bioavailability of the drug and subsequent efficacy is improved.
Keywords: Glipizide, Floating Microspheres, Solvent Evaporation Technique, In-vitro Buoyancy, Percentage Drug Release
Corresponding author *
Divya et al. Volume 3 (2), 2015, Page-606-615 absorbed from the gastrointestinal tract (GIT) and
having a short half life are eliminated quickly from the
blood circulation eg. Glipizide . To avoid this problem,
the oral sustained or controlled release (CR) systems
have been developed as these systems release the drug
slowly from the delivery systems and maintain a
constant drug concentration in the blood plasma for a
longer period of time. Single unit dosage form of
Glipizide causes gastric irritation and when converted
to multiple unit dosage like microspheres causes no
gastric irritation. 2 The gastro retentive drug delivery
system of Glipizide can be prepared to improve the
bioavailability and extend the release of Glipizide by
retaining the system in the stomach for prolonged
period of time.
2. MATERIALS AND METHODS
Glipizide is used to control hyperglycemia in type-II
diabetes was procured from Hetero Drugs Ltd,
Hyderabad ,Ethyl cellulose and Tween -80 were
procured from Thomas Baker chemicals, Mumbai ,
HPMC K 4 M and HPMC K 15 M were purchased
from Yarrow Chem Products, Mumbai, Ethanol was
procured from Fine Chem industries, Chennai.
2.1 Preformulation studies
Preformulation studies were carried on obtained
samples of drug, excipients and drug-excipient
granules to establish the necessary physicochemical
characteristics of the drug substance and to establish
drug compatibility with different excipients.
Preformulation studies include identification tests,
solubility analysis, melting point determination,
compatibility studies and evaluation of formulation
blend.3
IR Spectroscopy
Identification of the chemicals procured is done by IR
spectroscopy, in which FT-IR spectrum of the obtained
sample of chemicals were compared with standard
FT-IR spectra of the pure chemicals.3, 4
Solubility analysis
Solubility analysis was done to select a suitable solvent
system to dissolve the drug and also to test its
solubility in the dissolution medium which was to be
used.5
Melting point determination
Melting point determination of the obtained sample
was done by open capillary method. Drug was taken in
a capillary tube whose end was sealed by means of
flame. The capillary tube was placed in a melting point
apparatus to measure the melting point.5Melting point
is the first indication of purity of the sample since the
presence of relatively small amount of impurity can be
detected by a lowering as well as widening in the
melting point range.
Drug-Excipient compatability studies
Before producing the actual formulation, compatibility
of Glipizide with different polymers was tested using
FT-IR spectroscopy and differential scanning
calorimeter (DSC) studies.
FT-IR Spectroscopy
In the present study Potassium bromide pellet (KBr)
method was employed. The samples were thoroughly
blended with dried Potassium bromide crystals. The
mixture was compressed to form a disc. The disc was
placed in spectrophotometer and spectra of pure drug
and drug-excipient combinations were recorded.6
The FT-IR spectra of the samples were compared with
FT-IR spectra of the pure drug and excipients.
Differential Scanning Calorimeter (DSC) Studies
Thermograms were obtained by using a differential
scanning calorimeter at a heating rate of 10ºC/min over
a temperature range of 50-300 ºC. The sample was
hermetically sealed in an aluminium crucible.6
2.2 Formulation and composition
Preparation of floating microspheres of Glipizide
Floating microspheres of Glipizide were prepared by
Accurately weighed drug and polymers in different
ratios are dissolved in the solvents like ethanol and
dichloromethane (1:1 ratio) and is given in Table No.1.
The drug solution is slowly introduced in to 100ml of
water containing 0.01 ml of Tween 80 and 5 ml
n-hexane under continous stirring to form a homogenous
solution, which is maintained at 40˚C temperature and
at an agitation speed of 800 rpm for one hour to allow
the volatile liquid to evaporate. The microspheres
formed were filtered and air dried for 24 hours at room
temperature.
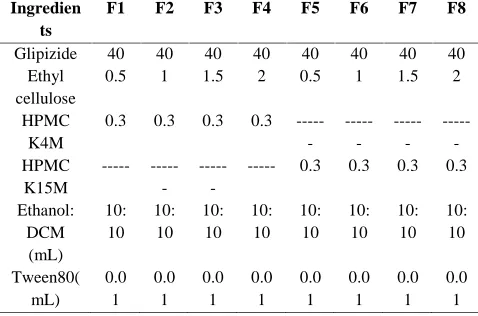
Table 1: Composition of Glipizide Floating microspheres
Ingredien ts
F1 F2 F3 F4 F5 F6 F7 F8
Glipizide 40 40 40 40 40 40 40 40 Ethyl
cellulose
0.5 1 1.5 2 0.5 1 1.5 2
HPMC K4M
0.3 0.3 0.3 0.3 - - - -HPMC K15M --- -
--- 0.3 0.3 0.3 0.3
Ethanol: DCM (mL) 10: 10 10: 10 10: 10 10: 10 10: 10 10: 10 10: 10 10: 10 Tween80( mL) 0.0 1 0.0 1 0.0 1 0.0 1 0.0 1 0.0 1 0.0 1 0.0 1
2.3 Evaluation and characterization of prepared microspheres
Production yield (%)
The production yield of microspheres of various
batches were calculated using the weight of the final
product after drying with respect to the initial weight of
the drug and polymer used for the preparation of
microspheres and percentage production yield was
calculated as per the following formula.8
Particle size analysis
Many methods are available for determining the
particle size, such as optical microscopy, sieving,
sedimentation and particle volume measurement.
Optical microscopy is most commonly used for particle
The average particle size is determined by using
Edmondson’s equation:
Where, n Number of microspheres observed. d
-Mean size range.
Shape and surface morphology
The shape and surface characteristics of the prepared
microspheres were evaluated by means of scanning
electron microscopy. The scanning electron
microscopy samples were prepared by lightly
sprinkling the microspheres powder on a double
adhesive tape, which is stucked to an aluminium stub.
The stubs were then coated with gold using a sputter
coater under high vacuum and high voltage to achieve
a film thickness of 30nm. The samples were then
imaged using a 20KV electron beam.10
Drug entrapment efficiency
100 mg of floating microspheres were taken for
evaluation. The amount of drug entrapped was
estimated by crushing the microspheres and extracting
with ethanol. The extract was transferred to a 100 ml
volumetric flask and the volume was made up using
0.1N HCl solution. The solution was filtered and
dilutions were made and the absorbance was measured
against blank solution spectrometrically at 278nm. The
amount of drug entrapped in the floating microspheres
was calculated by using the formula.10, 11
Percentage Drug entrapment = (Actual drug
content/Theoretical drug content) X100
In-vitro buoyancy
100 mg of floating microspheres about 100 mg was
placed in the dissolution medium of 500 ml of
stimulated gastric fluid (pH1.2), which was placed in
USP dissolution apparatus type II (rotating paddle).
The temperature of dissolution medium was
maintained at 37±0.5°C and was agitated by paddle at
Divya et al. Volume 3 (2), 2015, Page-606-615 medium and those that settled down at bottom of the
flask were recovered separately and dried. The
percentage buoyancy of the floating microspheres were
calculated by using the formula
Buoyancy % = [W f/ (W f+ W s)] x 100
Where W f and W s are the weight of the floating and
settled microspheres respectively.
In-vitro drug release studies
The in-vitro drug release studies of Glipizide from
formulations were carried out in acid buffer pH 1.2 for
2 hours and then continued in phosphate buffer pH 6.8
for 10 hours. 13 The studies were performed in USP
dissolution apparatus II, (Dissolution Test Apparatus,
Model DS 8000, LAB INDIA Pvt Ltd) at 37 ± 0.5° C
and 100 rpm speed. Samples were taken at hourly
interval and analyzed for Glipizide content at 237 nm
by using UV–visible spectrophotometer, (Mode No.
UV 3000+, LAB INDIA Pvt Ltd)
Drug release kinetics
The type of release of drug Glipizide from the
formulated floating microspheres was studied by curve
fitting analysis of the dissolution data of the optimized
formulation in following models.14, 15 1. Zero order 2.
First order 3. Higuchi model 4. Korsemeyer and
Peppas kinetic model.
The analysis of drug release mechanism from the
pharmaceutical dosage form is an important but
complicated process and it is practically evident in case
of matrix systems. As model-dependent approach, the
dissolution data are fitted to four popular release
models such as a zero-order, first order, Higuchi and
Peppas equations (Higuchi, 1963; Peppas, 1985;
Ritger, 1987). The order of drug release from matrix
systems was studied by using Higuchi equation and
Erosion equation. The value of n indicates the drug
release mechanism. For a slab the value n = 0.5
indicates fickian diffusion and values of n between 0.5
and 1.0 or n=1.0 indicate non-fickian mechanism. In
case of a cylinder n=0.45 instead of 0.5, and 0.89
instead of 1.0. This model was used to analyze the
release from polymeric dosage forms, when the release
mechanism is not well known or when there is a
possibility of more than one type of release
phenomenon being involved.
3. RESULTS AND DISCUSSION
3.1 Preformulation studies
Identification studies
IR Spectroscopy
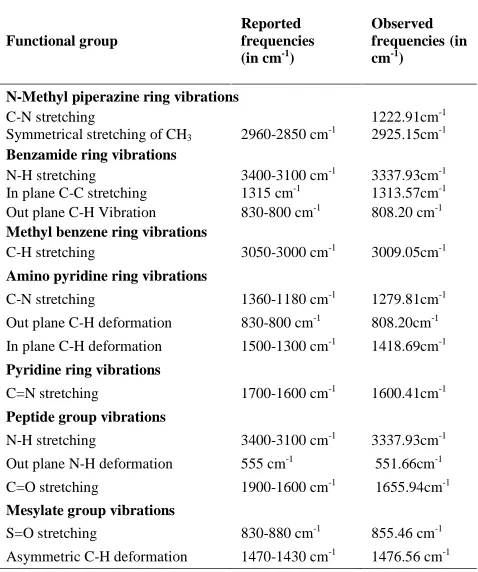
Functional group frequencies of Glipizide were in the
reported range which indicates that the obtained
sample was of Glipizide and was pure.16
Table 2: Reported and observed IR frequencies of Glipizide
Functional group
Reported frequencies (in cm-1
)
Observed frequencies (in cm-1
)
N-Methyl piperazine ring vibrations
C-N stretching 1222.91cm-1
Symmetrical stretching of CH3 2960-2850 cm-1 2925.15cm-1
Benzamide ring vibrations
N-H stretching 3400-3100 cm-1
3337.93cm-1
In plane C-C stretching 1315 cm-1
1313.57cm-1
Out plane C-H Vibration 830-800 cm-1
808.20 cm-1
Methyl benzene ring vibrations
C-H stretching 3050-3000 cm-1 3009.05cm-1 Amino pyridine ring vibrations
C-N stretching 1360-1180 cm-1
1279.81cm-1
Out plane C-H deformation 830-800 cm-1
808.20cm-1
In plane C-H deformation 1500-1300 cm-1
1418.69cm-1
Pyridine ring vibrations
C=N stretching 1700-1600 cm-1
1600.41cm-1
Peptide group vibrations
N-H stretching 3400-3100 cm-1
3337.93cm-1
Out plane N-H deformation 555 cm-1
551.66cm-1
C=O stretching 1900-1600 cm-1
1655.94cm-1
Mesylate group vibrations
S=O stretching 830-880 cm-1
855.46 cm-1
Asymmetric C-H deformation 1470-1430 cm-1
1476.56 cm-1
Solubility analysis
Sample of Glipizide was found to be soluble in water,
chloroform, methanol, dimethylsulphoxide.17
Melting point determination
The melting point of obtained sample was found to be
170°C which is within the reported range of
that, the sample was pure 18without any impurities as
presence of impurities widen the melting point range.
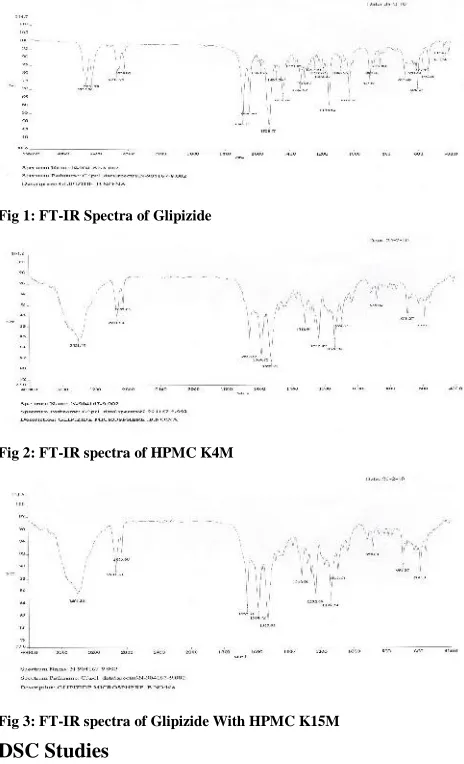
3.2 Drug-excipient compatability studies
FT-IR Spectroscopy
The FT-IR spectra of pure drug alone and along with
the polymers are shown in the figures 1 to 3 which
indicate no interaction between the drug and the
polymers when compared with the FT-IR spectrum of
pure drug as there are no prominent changes in peaks
of FT-IR spectrum.
Fig 1: FT-IR Spectra of Glipizide
Fig 2: FT-IR spectra of HPMC K4M
Fig 3: FT-IR spectra of Glipizide With HPMC K15M
DSC Studies
The thermo gram of Glipizide exhibited an
endothermic peak at 204 ºC corresponding to its
melting point range. 19, 20 The thermo grams of
formulation does not show profound shift in peaks,
suggesting that drug has almost same melting point in
its formulation. Hence it was concluded that drug had
not interacted with the polymer, which indicates
compatibility
Fig 4: DSC Thermogram of Drug, Polymer, Physical mixture and Formulation
3.3 Characterization of floating microspheres of
Glipizide
The Floating microspheres of Glipizide were
characterized for flow properties like angle of repose,
bulk density, tapped density, Carr’s index, and drug
content. 21 Angle of repose was less than 35° and
Carr’s index values were less than 12 for the raw
material of all the batches indicating good to fair flow
ability and compressibility. Hausner’s ratio was less
than 1.25 for all the batches indicating good flow
properties. The drug content was more than 90 % for
all the granules of different formulations.
Table 3: Physical Properties of Glipizide (API)
Standard Calibration curve of Glipizide
Table 4: Calibration curve data for Glipizide in 0.1N Hydrochloric acid.
S. No. Concentration Absorbance
1 0 0
2 1 0.100
3 2 0.235
4 3 0.320
5 4 0.432
6 5 0.534
7 6 0.662
8 7 0.745
9 8 0.874
Formula
Code
Angle of
repose ( °) Bulk
Density
(g/mL)
Tapped
Density
(g/mL)
Carr’s
Index (%)
Hausner’s
ratio
Divya et al. Volume 3 (2), 2015, Page-606-615
Fig 5: Standard calibration curve of Glipizide in 0.1N HCl
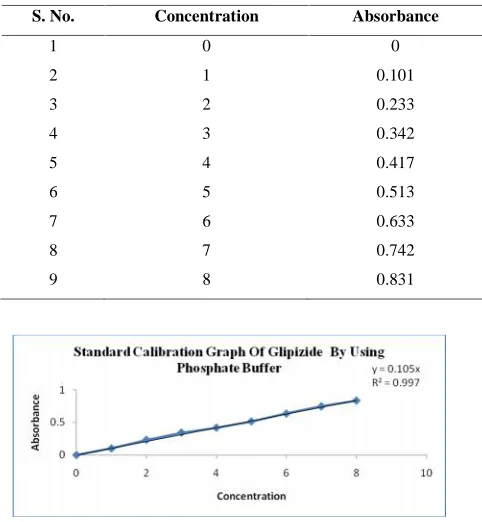
Table 5: Calibration curve data for Glipizide in phosphate buffer.
S. No. Concentration Absorbance
1 0 0
2 1 0.101
3 2 0.233
4 3 0.342
5 4 0.417
6 5 0.513
7 6 0.633
8 7 0.742
9 8 0.831
Fig 6: Standard calibration curve of Glipizide in phosphate buffer
From the standard curve of 0.1 N HCl and Phosphate
buffer pH 6.8 it was observed that the drug obeys Beer
– Lambert’s law in concentration range of 0 –30µg /
ml in the medium.
3.4 Characterization of formulated floating
microspheres of glipizide22
Percentage yield
The production yield of Floating microspheres
prepared by Solvent evaporation method was found to
be between 80.46 to 87.12%. It was observed that as
the polymer ratio in the formulation increases, the
product yield slightly decreases. The probable reason
behind this may be the high viscosity of the solution
which decreased its syringe ability resulting in
blocking of needle and wastage of the drug- polymer
solution which ultimately decreased the production
yields of microspheres.
Table 6: Evaluation and characterization of prepared Floating
microspheres
S NoFormulation Code
Percentage Yield
Drug entrapment
efficiency
Mean particle size(μm)
In-vitro buoyancy
1 F1 87.12 62.15±1.13 110±2.10 73.12±1.32 2 F2 85.56 72.11±1.20 135±8.23 85.14±2.25 3 F3 82.20 83.61±2.33 205±2.35 91.05±1.75 4 F4 86.02 86.12±1.24 207±1.02 90.91±2.75 5 F5 84.23 67.63±0.68 145.3±2.32 66.62±1.12 6 F6 80.62 77.91±2.26 115±3.21 74.47±0.63 7 F7 86.46 84.55±1.32 168±1.02 82.25±1.2 8 F8 83.54 85.63±1.08 226±2.35 88.05±1.54
Particle size analysis
The mean particle size of microspheres as determined
by optical microscopy by using stage micrometer and
ocular micrometer is shown in table 7. With the
increase in the EC concentration the particle size
increased from F1 to F4, F5 to F8. This is because the
viscosity of the polymer increases with increasing
polymer concentration, which in turn decrease the
stirring efficiency. The polymer rapidly precipitates
leading to hardening and avoiding further particle size
reduction during solvent evaporation.
Table 7: Particle Size Analysis Glipizide floating microspheres
S No Formulation code Mean particle size (μm)
1 F1 110±2.10
2 F2 135±8.23
3 F3 205±2.35
4 F4 207±1.02
5 F5 145.3±2.32
6 F6 115±3.21
7 F7 168±1.02
8 F8 226±2.35
Shape and surface morphology
Fig 8, 9: Scanning electron microscopy of Glipizide
In-vitro buoyancy
The microspheres floated over the surface of
dissolution media for prolonged period of time without
any apparent gelation. The pores on the microspheres
surface also helps in the floating which was confirmed
by SEM. So as the concentration of EC increased from
F1-F5 and F5-F8 the number of pores increased
because of which buoyancy percentage also increased.
Buoyancy percentage of the microspheres for
formulations F1-F4 was in the range of 74.31% to
91.02% and for formulations F5-F8 was 66.62% to
89.01% for 12 hours as shown in the table 4:
Table 8 : In-vitro buoyancy Glipizide floating microspheres
S.No Formulation code In-vitro buoyancy
1 F1 73.12±1.32
2 F2 85.14±2.25
3 F3 91.05±1.75
4 F4 90.91±2.75
5 F5 66.62±1.12
6 F6 74.47±0.63
7 F7 82.25±1.2
8 F8 88.05±1.54
In-vitro drug release studies
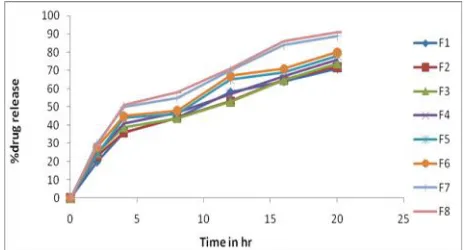
The results of the in-vitro dissolution studies data of all
the formulations were shown in table 9. The plots of
Cumulative percentage drug release Vs Time were
plotted. 23 Figure 16 shows the comparison of
cumulative percentage drug release for all the
formulations.
The formulation F8 containing HPMC K 15 M has
showen better drug release (90.82%).
Table 9: In-vitro drug release data of Glipizide floating microspheres
using HPMC K 4M , HPMC K15 as polymer.
Time(hr) F1 F2 F3 F4 F5 F6 F7 F8
2 20±1.2 23±2.1 25±0.3 25±1.6 24±0.2 28±1.1 30±1.4 29±1.2
4 36±1.8 36±0.6 39±1.8 41±0.4 44±0.6 45±0.6 50±1.2 51±0.4
6 44±1.3 44±0.2 45±1.2 46±1.2 46±1.8 48±0.8 55±0.6 58±0.1
8 58±1.5 53±1.2 55±0.5 65±0.7 65±1.2 67±0.2 70±0.8 71±1.4
10 64±1.1 65±0.8 65±0.2 69±0.9 69±0.9 71±1.7 84±0.2 86±0.8
12 71±1.8 72±0.4 74±1.8 76±1.5 78±1.1 80±1.3 89±0.4 91±0.3
Based on the results of evaluation tests , formulation
F8 (combination of ethyl cellulose, HPMC K -15 M)
was found to be the best for the oral delivery of
Glipizide that complied with all the parameters and
was found to have better in- vitro buoyancy and better
drug release of 91% at the end of 12 hrs.
Fig 10: Cumulative drug release profile of Glipizide floating microspheres F1-F8 formulations containing HPMC K4M, HPMC K15M polymers
Drug release kinetics
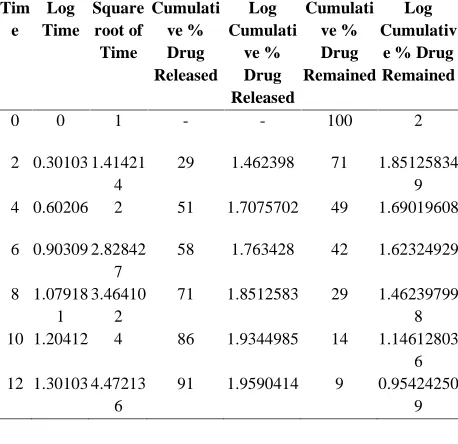
The release rate kinetic data for the F8 is shown in
Table.No.10. As shown in Figure. No. 10, drug release
data was best explained by First order equation, as the
plots showed the highest linearity (r2 = 0.976),
followed by Higuchi’s equation (r2= 0.970) . As the
drug release was best fitted in First order kinetics,
indicating that the rate of drug release is concentration
dependent. Higuchi’s kinetics explains why the drug
diffuses at a comparatively slower rate as the distance
for diffusion increases.
As shown in Figure.No 14 the corresponding plot (log
cumulative percent drug release vs log time) for the
Korsmeyer-Papas equation indicated a good linearity
(r2= 0.960). The diffusion exponent “n” was between
0.45-0.89, which indicates the diffusion mechanism is
non-fickian diffusion. And indicates that the drug
release was more than one process (both diffusion and
Divya et al. Volume 3 (2), 2015, Page-606-615
Table 10: Mathematical modelling and drug release kinetics of F8 optimized formulation.
Tim e
Log Time
Square root of Time
Cumulati ve % Drug Released
Log Cumulati
ve % Drug Released
Cumulati ve % Drug Remained
Log Cumulativ
e % Drug Remained
0 0 1 - - 100 2
2 0.30103 1.41421 4
29 1.462398 71 1.85125834 9 4 0.60206 2 51 1.7075702 49 1.69019608
6 0.90309 2.82842 7
58 1.763428 42 1.62324929
8 1.07918 1
3.46410 2
71 1.8512583 29 1.46239799 8 10 1.20412 4 86 1.9344985 14 1.14612803
6 12 1.30103 4.47213
6
91 1.9590414 9 0.95424250 9
Fig 11: Zero Order Graph by F8 optimized Formulation
Fig 12: First Order Graph by F8 optimized Formulation
Fig 13: Higuchi Plot by F8 optimized Formulation
Fig 14: Korsmeyer-Peppas plot by F8 optimized Formulation
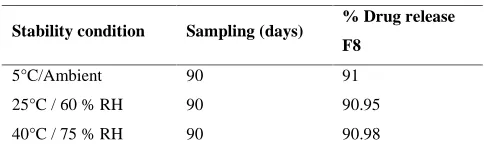
Stability studies
Optimized formulation F8 was chosen for stability
studies based on their percentage yield, percentage
drug entrapment efficiency and in-vitro drug release
characteristics. 23 The stability data showed that there
was no change in the appearance of the microspheres
indicating that the formulations were stable at all the
conditions to which they were exposed. It was
observed that there was slight reduction in the drug
content of the Floating microspheres which were stored
at 40°C / 75% RH at the end of 90days and no
significant change in drug content were observed for
formulations stored at room temperature and at 5°C.
In-vitro drug release studies for all the Optimized
formulation F8 were carried out at the end of 90 days
and did not show any significant change in drug release
and the stability study data is given the Table No.11
and 12. Thus, we may conclude that, the drug does not
undergo degradation on storage.
Percentage drug entrapment efficiency of the
formulations
Table 11: Percentage drug entrapment efficiency of the selected formulations
Stability
condition
Sampling
(days)
% Drug entrapment
efficiency
F8
5°C/Ambient 30 85.63
60 85.62
90 85.62
25°C / 60 % RH 30 85.65
60 85.62
90 85.62
60 85.62
90 85.61
Table 12: In-vitro drug release profile of the Optimized formulation F8
at the end of 90 days
4. CONCLUSION
These results clearly indicate that formulating floating
microspheres of Glipizide offers a suitable, practical
approach to achieve a prolonged gastric residence time
and continuous release of the medication over an
extended period of time thus oral bioavailability of the
drug and subsequent efficacy is improved.
5. ACKNOWLEDGEMENT
I wish to express my sincere thanks to Dr. DEEPAK S.
KHOBRAGADE, Principal, HOD, Department of
pharmaceutics, for his constant encouragement and for
providing me with all necessary facilities.
6. REFERENCES
1. Ji-Ho Lim, Sung-Kyun You,Jong-Suep
Baek,Chan-Ju Hwang,Young-Guk Na , Sang-Chul
Shin, and Cheong-Weon Cho. Preparation And
Evaluation Of Polymeric Microparticulates For
Improving Cellular Uptake Of Gemcitabine;
International Journal of Nanomedicine: 2012; 7:
2307–2314.
2. Vadaliya SK, Vadaliya KR, Desai HT and Patel
JK. Formulation and In-Vitro Evaluation of
Floating Microspheres of Anti-Diabetic Drug
Prepared by Solvent Evaporation Method.
International journal of pharmaceutical and
chemical sciences 2013; Vol. 2: (1).
3. Shwetha S Kamath K, Senthil Kumar S.K. Design
and evaluation of floating microspheres of
rabeprazole sodium. International Journal of
Pharmacy and Pharmaceutical Sciences 2012; 4.
4. M Nagpal, D K Maheswari and P Rakha.
Development and evaluation of ibuprofen
microspheres; J Young Pharm: 2012: 4(1): 13-16.
5. Yie W. Chien, Rate – controlled drug delivery
system. Indian journal of Pharmaceutical sciences;
1988: 65-87.
6. Chandy T, and Sharma C.P. Chitosan Matrix for
oral Sustained delivery of Ampicillin Biomaterials;
1989: 10: 312-315.
7. Singh Bandana, Kanoujia Jovita, Pandey Manisha,
Saraf Shubhini. A Formulation and Evaluation of
Floating Microspheres of Famotidine. International
Journal of PharmTech research April-June 2010; 2:
1415-1420.
8. Shwetha S Kamath K, Senthil Kumar S.K. Design
and evaluation of floating microspheres of
rabeprazole sodium. International Journal of
Pharmacy and Pharmaceutical Sciences 2012; Vol
4(3): 22-25.
9. Rakesh Pahwa, Neeta1, Seema, Rajeev Garg and
Sanju Nanda. Formulation and Evaluation of
Floating Multiparticulate Drug Delivery System of
Glipizide; Der Pharmacia Sinica 2011;
2(5):110-120.
10. Manas Tripathi L, P.R. Radhika and T. Sivakumar.
Formulation and evaluation of glipizide hollow
Microballoons for floating drug delivery. Bulletin
of Pharmaceutical Research 2011; 1(1):67-7.
11. M.Nagpal, D K Maheswari and P Rakha.
Development and evaluation of ibuprofen
microspheres. J Young Pharm 2012; 4(1): 13-16.
12. M. Najmuddin L, sachin shelar, asgar ali, v. Patel,
t. Khan. Formulation and In vitro evaluation of
floating microspheres of ketoprofen Prepared by
emulsion solvent diffusion method; international
Stability condition Sampling (days) % Drug release F8
5°C/Ambient 90 91
25°C / 60 % RH 90 90.95
Divya et al. Volume 3 (2), 2015, Page-606-615 journal of applied pharmaceutics:2010: Vol 2:
issue 1.
13. Arul B., Kothai, R., Sangameswaran, B., Jayakar,
B. Formulation and Evaluation of Microspheres
Containing Isoniazid; Indian Journal of
Pharmaceutical Sciences; 2003:65 (6):640-642.
14. Arjun Sony L and Sonam Jain. Formulation &
evaluation of floating microspheres of flupirtine
Maleate; international journal of pharmacy & life
sciences 2013; 4(4) :2535-2540.
15. Anand kumar srivastava devendra narayanrao
ridhurkarsaurabh wadhwa. Floating microspheres
of cimetidine; Formulation,characterization and in
vitro evaluation: Acta Pharm 2005; 55: 277–285.
16. Arai, K.Kineemaki T, Fujita T, Bull Tokai, Reg.
Fish.Res.Lab; 1968: 56-89.
17. Arjun Sony, Sonam Jain. Formulation &
evaluation of floating microspheres of flupirtine
Maleate; international journal of pharmacy & life
sciences: Int. J. Of Pharm. & Life Sci 2013; 4(4):
2535-2540
18. Arul B, Kothai R., Sangameswaran B, Jayakar, B.
Formulation and Evaluation of Microspheres
Containing Isoniazid; Indian Journal of
Pharmaceutical Sciences: 2003: 65 (6): 640-642.
19. Hazner Dar S. Preparation and in vitro evaluation
of Eudragit microspheres containing
acetazolamide; International journal of
pharmaceutics: 2004: 269: 131-140.
20. M Sivabalan, T Punitha Vani, Phaneendhar Reddy,
Vasudevaiah, Anup Jose and G Nigila.
Formulation and evaluation of gastroretentive
glipizide Floating tablets; Pharmacie Globale 2011;
1 (03).
21. Shashikant D. Barhate, Yogesh S. Rupnar, Rupesh
M. Sonvane, Kapil R. Pawar, Rahulkumar D,
Rahane. Formulation and evaluation of floating
microspheres of ketorolac trometamol
ijprd;2009:pub/arti:vol-:issue-9:Nov 05:
22. Yie W. Chien. Rate – controlled drug delivery
system. Indian journal of Pharmaceutical sciences;
1988: 65-87.
23. Jayvadan K. Patel and Jayant R. Chavda.
Formulation and Evaluation of Glipizide Floating
Bioadhesive Tablets; September-October 2010: