CODEN (USA)-IJPRUR,e-ISSN: 2348-6465
Original Article
Method development for the Simultaneous Estimation of
Metformin and Alogliptin by using RP-HPLC
Koduru Swathi*, Kalepu swathi, Mitta chaitanya
Department of Pharmaceutical Analysis, Bojjam Narsimhulu Pharmacy College For Women, Hyderabad- 500088, India
A R T I C L E I N F O A B S T R A C T
_______________________________________________________________________________
1. INTRODUCTION
Qualitative analysis is the identification of elements,
species and/or compounds present in sample.
Quantitative analysis is the determination of the
absolute or relative amounts of elements, species or
compounds present in sample.
International Journal of Pharma Research and Health Sciences
Available online atwww.pharmahealthsciences.net
Received: 10 Apr 2015
Accepted: 29 Apr 2015 chromatographic method was developed and validated for the determination ofA selective and sensitive stability-indicating high-performance liquid Metformin and Alogliptin 10 mg of Metformin and Alogliptin was dissolved in mobile phase. The solution was scanned from 200-400 nm the spectrum was obtained. The overlay spectrum was used for selection of wavelength for Metformin and Alogliptin. The isobestic point was taken as detection wavelength. 25 mg of metformin working standard was accurately weighed and transferred into a 10 ml clean dry volumetric flask and add about 1 ml of diluent and sonicated to dissolve it completely and make volume up to the mark with the same solvent (Stock solution).Further pipette out 1 ml from the above stock solution into a 10 ml volumetric flask and was diluted up to the mark with diluent. 10L of the blank, standard and sample were injected into the chromatographic system and areas for the Metformin and Alogliptin the peaks were used for calculating the % assay by using the formulae. The system suitability parameters for metformin and Alogliptin such as theoretical plates and tailing factor were found to be 2294, 1.27 and 4891 and 1.03, the resolution was found to be 8.67. The analytical method was validated according to ICH guidelines (ICH, Q2 (R1)). The linearity study of metformin and Alogliptin was found in concentration range of 50µg-250µg and 5µg-25µg and correlation coefficient (r2) was found to be 0.999 and 0.999, % recovery was found to be 99.56% and 99.48%, %RSD for repeatability was 0.7and 0.8, % RSD for intermediate precision was 0.10 and 0.5 respectively. The precision study was precision, robustness and repeatabilty.LOD value was 2.17 and 0.0372 and LOQ value was 6.60 and 0.1125 respectively.
Keywords: Metformin and Alogliptin, RP-HPLC, Acetonitrile (30:70) and Retention time.
Corresponding author *
Structural analysis is the determination of the spatial
arrangement of atoms in an element or molecule or the
identification of characteristic groups of atoms
(functional groups). An element, species or compound
that is the subject of analysis is known as analyte. The
remainder of the material or sample of which the
analyte(s) form(s) a part is known as the matrix.
The gathering and interpretation of qualitative,
quantitative and structural information is essential to
many aspects of human endeavour, both terrestrial and
extra-terrestrials. The maintenance of an improvement
in the quality of life throughout the world and the
management of resources heavily on the information
provided by chemical analysis. Manufacturing
industries use analytical data to monitor the quality of
raw materials, intermediates and finished products.
Progress and research in many areas is dependent on
establishing the chemical composition of man-made or
natural materials, and the monitoring of toxic
substances in the environment is of ever increasing
importance. Studies of biological and other complex
systems are supported by the collection of large
amounts of analytical data. Analytical data are required
in a wide range of disciplines and situations that
include not just chemistry and most other sciences,
from biology to zoology, butte arts, such as painting
and sculpture, and archaeology. Space exploration and
clinical diagnosis are two quite desperate areas in
which analytical data is vital. Important areas of
application include the following. Metformin decreases
blood glucose levels by decreasing hepatic glucose
production, decreasing intestinal absorption of glucose,
and improving insulin sensitivity by increasing
peripheral glucose uptake and utilization. These effects
are mediated by the initial activation by metformin of
AMP-activated protein kinase (AMPK), a liver enzyme
that plays an important role in insulin signaling, whole
body energy balance, and the metabolism of glucose
and fats. Activation of AMPK is required for
metformin's inhibitory effect on the production of
glucose by liver cells. Increased peripheral utilization
of glucose may be due to improved insulin binding to
insulin receptors.
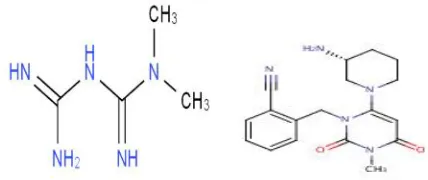
Fig 1: Structure of Metformin & Alogliptin
Metformin administration also increases AMPK
activity in skeletal muscle. AMPK is known to cause
GLUT4 deployment to the plasma membrane, resulting
in insulin-independent glucose uptake. The rare side
effect, lactic acidosis, is thought to be caused by
decreased liver uptake of serum lactate, one of the
substrates of gluconeogenesis. In those with healthy
renal function, the slight excess is simply cleared.
However, those with severe renal impairment may
accumulate clinically significant serum lactic acid
levels. Other conditions that may precipitate lactic
acidosis include severe hepatic disease and
acute/decompensated heart failure.
2. MATERIALS AND METHODS
2.1 Chromatographic conditions
Column : X Bridge C18 column
(4.6×150mm), 5µ
Mobile phase ratio : Buffer: Methanol:
ACN (20:60:20%v/v/v)
Detection wavelength : 290 nm
Flow rate : 1.0ml/min
Injection volume : 20µl
Column temperature : Ambient
Auto sampler temperature : Ambient
Run time : 15 min
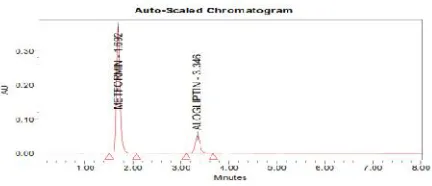
Fig 2: Chromatogram showing trial-5 injection
The separation was good, peak shape was good, so we
conclude that there is no required for reduce the
retention times of peaks, so it is taken as final method.
2.2 Preparation of phosphate buffer
2.95 grams of KH2PO4and 5.45 grams of K2HPO4was
weighed and taken into a 1000ml beaker, dissolved and
diluted to 1000ml with HPLC water and pH was
adjusted to 3 with ortho phosphoric acid. The resulting
solution was sonicated and filtered.
2.3 Preparation of mobile phase
Mix a mixture of above buffer 20 ml (30%) and 60 ml
of methanol (HPLC grade-60%) and Acetonitrile
(20%) degassed in ultrasonic water bath for 5 minutes.
Filter through 0.22 µ filter under vacuum filtration.
2.4 Preparation of the individual Metformin standard
preparation
25 mg of metformin working standard was accurately
weighed and transferred into a 10 ml clean dry
volumetric flask and add about 1 ml of diluent and
sonicated to dissolve it completely and make volume
up to the mark with the same solvent (Stock
solution).Further pipette out 1 ml from the above stock
solution into a 10 ml volumetric flask and was diluted
up to the mark with diluent.
2.5 Preparation of the individual Alogliptin standard
preparation
10 mg of Alogliptin working standard was accurately
weighed and transferred into a 10 ml clean dry
volumetric flask and add about 1 ml of diluent and
sonicated to
Dissolve it completely and make volume up to the
pipette out 1 ml from the above stock solution into a 10
ml volumetric flask and was diluted up to the mark
with diluent.
2.6 Preparation of the Metformin and Alogliptin
standard and sample solution
Sample solution preparation
25 mg of metformin and 10 mg Alogliptin tablet
powder were accurately weighed and transferred into a
10 ml clean dry volumetric flask, add about 1 ml of
diluent and sonicated to dissolve it completely and
making volume up to the mark with the same
solvent(Stock solution). Further pipette 1 ml of the
above stock solution into a 100ml volumetric flask and
was diluted up to the mark with diluent.
Standard solution preparation
25 mg metformin and 10 mg Alogliptin working
standard was accurately weighed and transferred into a
10ml clean dry volumetric flask and add about 2ml of
diluent and sonicated to dissolve it completely and
make volume up to the mark with the same solvent
(Stock solution).Further pipette out 1ml of the above
stock solution into a 10ml volumetric flask and was
diluted up to the mark with diluent.
2.7 Analytical Method Validation
Specificity
The system suitability for specificity was carried out to
determine whether there is any interference of any
impurities in retention time of analytical peak. The
specificity was performed by injecting blank.
2.8 Linearity
2.8.1 Preparation of stock solution
25 mg of metformin and 10 mg of Alogliptin working
standard were accurately weighed and were transferred
into a 10ml clean dry volumetric flask, add about 1 ml
of diluent and sonicate to dissolve it completely and
make volume up to the mark with the same solvent.
2.8.2 Preparation of Level – I (60ppm of metformin
0.6 And 0.15 ml of stock solution was taken in to 10ml
of volumetric flask and diluted up to the mark with
diluent.
2.8.3 Preparation of Level – II (70ppm of metformin
and 1.75ppm of Alogliptin)
0.7 And 0.17 ml of stock solution was taken in to 10ml
of volumetric flask and diluted up to the mark with
diluent.
2.8.4 Preparation of Level –III (80ppm of metformin
and 2.0ppm of Alogliptin)
0.8 And 0.2 ml of stock solution was taken in to 10ml
of volumetric flask and diluted up to the mark with
diluent.
2.8.5 Preparation of Level –IV (90 ppm of metformin
and 2.25ppm of Alogliptin)
0.9 And 0.225 ml of stock solution was taken in to
10ml of volumetric flask and diluted up to the mark
with diluent.
2.8.6 Preparation of Level–V (100 ppm of metformin
and 2.5ppm of Alogliptin)
1.0 And 0.25 ml of stock solution was taken in to 10ml
of volumetric flask and diluted up to the mark with
diluent.
2.9 Accuracy
2.9.1 Preparation of standard stock solution
25mg of metformin and 10 mg of Alogliptin working
standard were accurately weighed and transferred into
a 10ml clean dry volumetric flask add about 1ml of
diluent and sonicate to dissolve it completely and make
volume up to the mark with the same solvent (Stock
solution).Further pipette out 1 ml of the above stock
solution into a 10 ml volumetric flask and was diluted
up to the mark with diluent.
2.9.2 for preparation of 50% solution (with respect to
target assay concentration)
15 mg of metformin and 5 mg of Alogliptin working
standard were accurately weighed and transferred into
a 10 ml clean dry volumetric flask add about 1ml of
diluent and sonicate to dissolve it completely and make
volume up to the mark with the same solvent (Stock
Solution).Further pipette out 10 ml of the above stock
solution into a 100ml volumetric flask and was diluted
up to the mark with diluent.
2.9.3 For preparation of 100% solution (with respect
to target assay concentration)
25 mg of metformin and 10 mg of Alogliptin working
standards were accurately weighed and transferred into
a 10ml clean dry volumetric flask add about 1 ml of
diluent and sonicate to dissolve it completely and make
volume up to the mark with the same solvent (Stock
solution).Further pipette out 1ml of above stock
solution into a 10 ml volumetric flask and was diluted
up to the mark with diluent.
2.9.4 For preparation of 150% solution (with respect
to target assay concentration)
30 mg of metformin and 15 mg of Alogliptin working
standards into a 10ml clean dry volumetric flask add
about 1 ml of diluent and sonicate to dissolve it
completely and make volume up to the mark with the
same solvent. Further pipette out 1ml of the above
stock solution into a 10ml volumetric flask and was
diluted up to the mark with diluent.
3. RESULTS AND DISCUSSIONS
3.1 Method Development
The detection wavelength was selected by dissolving
the drug in mobile phase to get a concentration of
10µg/ml for individual and mixed standards. The
resulting solution was scanned in U.V range from
200-400nm. The overlay spectrum of metformin and
Alogliptin was obtained and the isobestic point of
metformin and Alogliptin showed absorbance’s
Fig 3: Spectrum showing overlapping spectrum of MET and
ALO
Table 1: Linearity Level of Metformin and Alogliptin
Fig 4: Spectrum showing wavelength of Metformin
Fig 5: Spectrum showing wavelength of Alogliptin
The chromatographic method development for the
simultaneous estimation of metformin and Alogliptin
were optimized by several trials for various parameters
as different column, flow rate and mobile phase, finally
the following chromatographic method was selected
for the separation and quantification of metformin and
Alogliptin in API and pharmaceutical dosage form by
RP-HPLC method.
Optimized chromatographic conditions for
simultaneous estimations of Metformin and Alogliptin
by RP-HPLC method
Column : X Bridge RP C18 4.6×50 mm
3.7 µm
Column temperature : Ambient
Wavelength : 290 nm
Mobile phase ratio : 40:20:40 methanol: ACN :
phosphate buffer pH 7
Flow rate : 1 ml/min
Auto sampler temperature : Ambient
Injection volume : 10µl
Run time : 10.0 minutes
Specificity
The system suitability for specificity was carried out to
determine whether there is any interference of any
impurities in retention time of analytical peak. The
study was performed by injecting blank.
Fig 6: Chromatogram showing sample injection
Linearity : The linearity study was performed for the
concentration of 60 ppm to100 ppm of metformin 1.5
ppm to 2.5 ppm of Alogliptin level. Each level was
injected into chromatographic system. The area of each
level was used for calculation of correlation coefficient
S.No Linearity
Level Concentration Area (Metformin)
1 I 1.5ppm 47154
2 II 1.75 ppm 65627
3 III 2.0ppm 79499
4 IV 2.25 ppm 94612
5 V 2.5 ppm 100213
Correlation Coefficient 0.999
SI.NO Leniarity
level
Concentration Area(Alogliptin)
1 I 60 ppm 56472
2 II 70ppm 73841
3 III 80ppm 92655
4 IV 90ppm 111541
5 V 100ppm 130567
Correlation Coefficient 0.999
Alogliptin
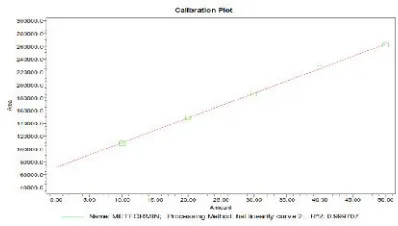
Fig 7: Showing calibration graph for Alogliptin Accuracy
Metformin r2= 0.999
The accuracy study was performed for 50%, 100% and
150 % for metformin
and Alogliptin. Each level was injected in triplicate int
o chromatographic system. The area of each level was
used for calculation of % recovery.
Table 2: Showing accuracy results for Alogliptin
%Concentration
(at specification
level)
Average
area
Amount
added
(mg)
Amount
found
(mg) %
Recovery Mean
recovery
50% 484733 0.5 0.99 99.53% 99.47%
100% 967998 1.0 1.05 99.38%
150% 145437 1.5 1.495 99.52%
The accuracy study was performed for % recovery of
Metformin and Alogliptin. The % recovery was found
to be 99.18% and 99.91% respectively (NLT 98% and
NMT 102%).
4. REFERENCE
1. Hassa Saad S.M., Mahmoud Wagiha H,
Elmosallamy Mohamed A.F, Othman Abdel
Hammeed M. Determination of metformin in
pharmaceutical preparations using potentiometry,
spectrofluorimetry and uv–visible
spectrophotometry. Anal. Chimica acta .1999;
378(1-3): 299-311.
2. Aburuz, s., Millership J, Mcelnay J. The
development and validation of liquid
chromatography method for the simultaneous
determination of metformin and glipizide,
gliclazide, glibenclamide or glimperide in plasma.
J chromatogr. B, 2005; 817(2): 277-286.
3. Herman g, bergman a, liu f, stevens c, wang a,
zeng w, chen l, snyder k, hilliard d, tanen m, tanaka
w, meehan a, lasseter k, dilzer s, blum r, wagner j.
Pharmacokinetics and pharmacodynamic effects of
the oral dpp-4 inhibitor sitagliptin in middle-aged
obese subjects. J.clin.pharmacol.2006; 46 (8): 876–
886.
4. G. Satya sri et al, A New Stability Indicating
Rp-Hplc Method Development For Simultaneous
Estimation of Metformin and Alogliptin In Bulk
As Well As In Pharmaceutical Formulation By
Using PDA Detector. Indo American Journal of
Pharmaceutical Research 2013; 3(11): 9222-9241.
5. Georgita c, Albu F, David V, Medvedovici A.
simultaneous assay of metformin and
glibenclamide in human plasma based on
extraction-less sample preparation procedure and lc
/(apci)ms. J.chromatogr. B.2007;
854(1-2):211-218.
6. Praveen kumar et al, [international bulletin of
drug research., 3(5): 58-68, 2013]
7. Maria-cristina ranetti et al, [farmacia, 2009, vol.
57, 6]
8. Jain D, Jain S, Jain D ,Maulik A. Simultaneous
estimation of metformin hydrochloride,
pioglitazone hydrochloride and glimepiride by
rp-hplc in tablet formulation .journal of chromatogr.
Sci.2008; 46:501-504.
9. Patil S.S., Bonde C. .development and validation
of analytical method for simultaneous estimation
of glibenclamide and metformin hcl in bulk and
tablets using uv visible spectroscopy, int. J.