ISSN (e): 2250-3021, ISSN (p): 2278-8719
Vol. 09, Issue 11, November. 2019, Series -II, PP 48-59
A Statistical Study of Water Quality of River Brahmani, Odisha
(India) To Assess Its Potability
Abhijeet Das
1, Dr. Bhagirathi Tripathy
21Assistant Professor (Consolidated), Civil Engineering Department, IGIT, Sarang, Odisha. 2
Assistant Professor, Civil Engineering Department, IGIT, Sarang, Odisha. Corresponding Author: Abhijeet Das
Received 06November 2019; Accepted 21 November 2019
Abstract: The surface water quality of Brahmani river system in Odisha was analyzed by applying the multivariate statistical techniques including cluster analysis (CA), factor analysis (FA) and principal component analysis (PCA). Agglomerative hierarchical cluster analysis (AHC) grouped 15 sampling sites into three clusters namely less polluted (LP), moderately polluted (MP), and highly polluted (HP) sites under the similarity of surface water quality parameters. The application of factor analysis/ principal component analysis to the evaluated data set of three different clusters, generates eight PCs for LP and two PCs for MP sites while two PCs were obtained for HP sites with each cases having Eigen values (Component variance values) >1. The PCs obtained from factor analysis indicates that the increase in load of nitrate,Fe, Turbidity, Calcium, Sulphate, Fluorine, Alkalinity, Boron, Magnesium and decrease in DO, pH level of water in HP and MP sites, display the intensity of organic pollution in the river that are mainly attributed to agriculture runoff, industrial effluents and regional anthropogenic contributions from both point and non-point sources. Thus these methods are believed to be valuable for water resource manager to identify the complex nature of water quality issues and determine the relative precedence to enhance the water quality of surface water body.
Keywords: Brahmani River, Industrial/Urban sewage, Cluster analysis, Principal Component analysis, Statistical analysis, Water quality.
I.
INTRODUCTION
Water, a prime natural resource, is a basic need for sustenance of human civilization. Sustainable management of water resources is an essential requirement for the growth of the state’s economy and well being of the population. As per National water policy, 2002, water resources development and management will have to be planned for a hydrological unit such as drainage basin as a whole or for a sub-basin for sustainable use incorporating quantity and quality aspects as well as environmental considerations.
The water environment quality is a very important and is a subject of major concern for economic development of any country. The water resource problems related to degradation have increasingly been serious because of rapid industrialization and urban sprawl. Anthropogenic influences such as urbanization, industrial and agricultural activities, increasing consumption of water recourses along with natural process i.e. change in precipitation inputs, erosion, effectively deteriorate surface water quality and impair their uses for drinking, industrial, agriculture, recreating and other purposes. The application of different multivariate statistical techniques, such as cluster analysis (CA) , principal component analysis (PCA) helps in the interpretation of complex data matrices to better understand the water quality and ecological status of the studied system, allows the identification of possible factors that influences water environment system, and offers a valuable tool for reliable management of water resources. The statistical method applied in this study can be used to assess the relationship between variable and possible pattern in distribution of measured data. In this study we mainly used CA to group water body into several zones with different water quality and PCA to find the most important factor that describe the natural and anthropogenic influences.
The Brahmani watershed is the most developed and urbanized region in the state of Odisha. The increasing deterioration of water quality of the watershed is mainly attributed to the uncontrolled and improper disposal of solid and toxic waste from industrial effluents, agricultural runoff and other human activities. This alarming water pollution not only causing degradation of water quality but also threatens human health and balance of aquatic ecosystem, and economic development of the state.
The specific objectives of the research are to
Classify the watershed into several zones with different water quality.
Extract and establish the parameters that are most important in assessing variation in water quality of different zones,
Find out a good approach to assess the water quality of each cluster reasonably that can be helpful to the managers to take the effective measures to manage the water resource respectively.
To perform time series analysis, trend Analysis and PCA Analysis of water quality parameters.
To interpret the complex water quality data matrices as well as to identify the possible sources or factors that influences the water quality by using different analysis methods viz., principal Component Analysis (PCA) and Cluster Analysis (CA).
To compare all the employed models in terms of the predictive ability as well as to carry out the analysis of the estimated water quality parameters so as to obtain the most suitable model.
II.
REVIEW OF LITERATURE
Water quality is a complex subject, which involves physical, chemical, hydrological and biological characteristics of water and their complex and delicate relations. From the user's point of view, the term "water quality" is defined as "those physical, chemical or biological characteristics of water by which the user evaluates the acceptability of water". For example for drinking water should be pure, wholesome, and potable. Similarly, for irrigation dissolved solids and toxicants are important, for outdoor bathing pathogens are important and water quality is controlled accordingly.
raw sewage. Rout [2016] carried out an analysis was carried out by taking certain important parameters like pH, dissolved oxygen (DO), biological oxygen demand (BOD), chemical oxygen demand (COD), Chloride, total dissolved oxygen (TDS), Nitrate, sulphates, total hardness (TH), electrical conductivity (EC) and Fluoride. Vega et al., [2016]signifies the application of different multivariate statistical techniques, such as cluster analysis (CA), principal component analysis (PCA) helps in the interpretation of complex data matrices to better understand the water quality and ecological status of the studied systems.
III.
STUDY AREA AND DATA COLLECTION
STUDY SITE:
Brahmani, the second major river in Odisha, is formed by the combined waters of South Koel and Sankh rivers at Vedvyasa near Rourkela in the Sundergarh district. The left bank tributary South Koel originates near Nagri village in the Ranchi district of Jharkhand state. After its confluence with river Karo in Singhbhum district, it is known as koel. From Manoharpur, it flows in the south-west direction for a distance of about 54 km uptoVedvyasa where the right bank tributary Sankh joins with it. River Sankh originates an elevation of 1000 m near village Lupungpat in Ranchi district of Jharkhand state.
River Brahmani travels southward through valleys incised in the Gadjat Hills to form the famous Gangpur Basin. In this stretch the river is joined by several fast flowing tributaries. The deltaic region of Brahmani starts from Jenapur at river distance equals to 315 km, where the Kalamitra Island divides the river into two branches. The left branch is called Brahmani main and the right branch is called Kharasuan, which agains join the Brahmani river at RD 429 km. River Birupa, a distributary of Mahanadi river, joins Brahmani river at RD 327 km. In place of being a receiving stream, it now branches into numerous spill channels which criss-cross the spill channels of river Baitarani and ultimately joins river Baitarani at RD 446 km to form Dhamra mouth before finally being dischargedinto Bay of Bengal at RD 461 km.
The basin area of river Brahmani in Odisha constitutes 57.63% of the total basin area. The basin covers 9 revenue districts of the State.
The below (figure 1, 2 & 3) showing monitoring stations of Brahmani basin by the application of GIS Software.
(Figure2. Flow path of Brahmani basin showing monitoring stations)
(Figure4. Area coverage of districts of Brahmani basin in Odisha)
Fifteen different stations as mentioned below are selected across the stretch of the Brahmani River. The selection of the sites was done depending upon the industrial and mining activities along the river bank (Table 1)
Table1.Showing the monitoring stations and the justification on the site selected SL NO MONITORING
STATION
JUSTIFICATION ON THE SITE SELECTED
1 SANKHA(U/S) D/S of Mandira dam
2 KOEL(U/S) Before confluence with river sankha and after waste water discharge of koelnagar 3 PANPOSH(U/S) Water quality before industrial activity after confluence of Sankh and Koel 4 PANPOSH(D/S) Impact of industrial activities like RSP and domestic waste water discharge from
Rourkela city.
5 ROURKELA(D/S) To asses water quality improvement at further down stream of Rourkela city and identification of polluted stretch.
6 BONAIGARH To assess the improvement of water quality. 7 RENGALI A multipurpose dam
8 SAMAL Samal Barrage, Water intake point for TSTPP,Kaniha 9 TALCHER(U/S) Water intake point of industries and mines
10 TALCHER(D/S) Impact of industrial and muncipal discharge. Downstream of the confluence of Nandirajhor with Brahmani
11 DHENKANAL(U/S) Upstream of Dhenkhanal town 12 DHENKANAL(D/S) Downstream of Dhenkhanal town 13 BHUBAN A major human settlement with water intake point
14 DHARMASALA Thickly populated area with intensive agriculture practice D/s of industrial activities at Kalinganagar
15 PATTAMUNDAI Thickly populated area, Tidal effect
IV. MATERIALS AND METHODS
SAMPLING AND PARAMETERS:Water samples were collected from 15 stations along the course of theBrahmani river system, starting from the Sankh U/s Reservoir to Pattamundai. The sampling strategy was designed in such a way to cover a wide range of determinants at keysites that accurately represent the water environment quality of the river systems and account for tributary inputs that can have important impacts upon downstream water quality. Various water quality parameters from the monitoring stations were analyzed yearly from 2000 to 2015. The mean value of the data sets was taken into consideration for evaluating the pollution load in the water system. The measured parameters include pH, Nitrate(NO₃),Total Dissolved Solids (TDS), Boron, Alkalinity, Calcium, Magnesium, Turbidity, Chloride(Clˉ) , Sulphate (SO₄²ˉ), Fluoride(Fˉ) and Iron(Fe).
SUNDERGARH, 59 %
DEOGARH, 85%
SAMBALPUR, 21% ANUGUL, 66%
KEONJHAR, 21% DHENKANAL, 89%
JAJPUR, 63% KENDRAPADA, 42
% CUTTACK, 1%
(Table 2.MINIMUM, MAXIMUM, MEAN AND STANDARD DEVIATION OF WATER QUALITY PARAMETERSAT DIFFERENT MONITORING STATIONS FROM 2000 TO 2014)
PARAMETERS STATIONS MIN MAX MEAN
STANDARD DEVIATION
PH 15 7.478 7.821 7.681933 0.093202136
TURBIDITY 15 61.625 164.3 93.48833 24.89554116
TDS 15 71.66667 234.1667 111.0889 46.27446293
CALCIUM 15 12.29 30.06 16.78933 5.76978146
MAGNESIUM 15 4.1325 11.50167 6.102334 2.419139123
IRON 15 1.323833 5.828917 2.858724 0.995811285
CHLORINE 15 9.1 28.01 13.82713 5.609048963
FLUORINE 15 0.21075 1.593833 0.494911 0.428257389
NITRATE 15 1.705833 30.365 4.184667 7.263498
SULPHATE 15 7.138 37.55 14.71427 10.31852366
ALKALINITY 15 36.885 75.06333 48.48828 12.9094684
BOR0N 15 0.033333 0.178333 0.076278 0.038847244
STASTICAL ANALYSIS:In recent years, various statistical procedures based on multivariate data taken fromriver system have been used to formulate environmental classifications, which help for a better understanding of the chemical processes occurring in the river environment. Principal component analysis and cluster analyses (CA) were carried out for data set obtained yearly from 2000-2014. The factor analyses were calculated using component variance values greater than 1.0 is considered the significant influences towards the geo-chemical processes.The hierarchical clustering was carried out from data normalized to a zero mean and using Euclidian distances as a measure of similarity. Ward’s method was selected because it possesses a small space-distorting effect and accesses more information on cluster content. The results indicate that the CAtechnique offers a reliable classification of surface water in the whole region and make it possible to design a future spatial sampling strategy in an optimal method that can reduce the number of monitoring sites.
CLUSTER ANALYSIS:
Cluster analysis (CA) is used to develop meaningful aggregations or groups of entitiesbased on a large number of interdependent variables. The resulting clusters of objects should exhibit high internal (within-cluster) homogeneity and high external (between clusters) heterogeneity. Of all cluster analysis, hierarchical cluster is most common approach. In the study, hierarchical agglomerative CA was performed based on the normalized data set (mean of observations over the whole period) by means of the Ward’s method using Euclidean distances as a measure of similarity. The spatial variability of water environment quality in the whole river basin was determined from CA, which divides a large number of objects into smaller number of homogenous groups on the basis of their internal correlations.
PRINCIPAL COMPONENT ANALYSIS / FACTOR ANALYSIS:
Factor analysis, which includes PCA is a very powerfultechnique applied to reduce the dimensionality of a dataset consisting of a large number of interrelated variables, while retaining as much as possible the variability presented in dataset. Mathematically, the PCs are computed from covariance or other cross-product matrix, which describes the dispersion of the multiple measured parameters to obtain Eigen values (Component variance values) and eigenvectors. Factor analysis attempts to explain the correlations between the observations in terms of the underlying factors, which are not directly observable. This study comprises application of multivariate statistical techniques to analyze water quality dataset obtained from the Mahanadi River in Odisha.
V.
RESULTS AND DISCUSSION:
depending on the similarity of their water quality characteristics. Grouped stations under each cluster are depicted in Ward’s minimum variance dendrogram.
(Figure5. Dendrogram showing clustering of monitoring sites according to surface water qualitycharacteristics of the Brahmani river basin)
(Figure6.Andrew plots showing physico-chemical parameters and their composition of monitoring sites of the Brahmani river basin)
CLUSTER- I (4-5-6-10-11-12-13-14-15 ):Monitoring sites, mainly located in between the Panposh (U/s) uptoPattamundai including Rourkela, Bonaigarh, Talcher, Dhenkanal (U/s), Dhenkanal (D/s), Bhuban namely (stations4-5-6-10-11-12-13-14-15) are clustered in this group. The impact of human beings activities on the riverine ecosystem is relatively low. Although the mining and the direct discharge of domestic water contaminated the river water system, cluster I corresponds to less polluted (LP) site, because the inclusion of sampling location suggests the self purification and assimilative capacity of the river are strong.
CLUSTER- II (1-3-8):This cluster sites mainly located in between Sankh U/s uptoSamal including Panposh U/s namely (stations1-3-8).These sites are classified as moderately polluted (MP).
From the data, it is seen that there is deterioration of water quality at Panposh D/s and Talcher D/s. This is an expected observation since a number of large and medium industries and mines are operating at Rourkela and AngulTalcher industrial complex.
After confluence of Nandira River with Brahmani River, the water quality at Talcher D/s deteriorates both with respect to Hg and Cd. Though As value increases in comparison to U/s stations of Talcher still it remains within the prescribed limit where both Pb and Ni counts significantly exceeds the prescribed limit. The water quality gets improved uptoDhenkanal U/s. Impact of Dhenkanal town on the water quality of Brahmani River is not that much significant irrespective of increase in Cd and Fe counts.
After Bhuban, there is some restoration in the water quality which continues uptoPottamundai through Dharmasala. The magnitude of improvement in the water quality in this stretch is however not the same as that in the Bonaigarh-Rengali-Samal stretch, since there is increase in the population density and intensity in agricultural activities as the river enters into the deltaic region.
CLUSTER- III (7-9):This cluster mainly includes Rengali and Talcher U/s. These sites are classified as highly polluted (HP). During the eighties and early nineties, the water quality of the river at Rourkela and Angul-Talcher caused much concern. Presently, however, there is no indication of any severe industrial pollution in these two stretches. This could be because of some effective control measures taken by the industries and mines, subsequently. A significant step in this direction is recycling/reusing of waste water by some of the major polluting units and reduction in the quantity of effluent generation by some large industries. Improvement in the water quality over the years is reflected in the water quality trend at Talcher D/s and the rivulet Nandira. This small tributary of Brahmani originates at Golabandha and after travelling a distance of about 39 km, joins Brahmani at kamalnaga. Most of the major industries and mines in the Angul-Talcher area are located in the catchment of Nandira. Till late nineties, it is used to receive effluent (directly or indirectly) heavily laden with suspended solids and other pollutants, from many major industries. With improved pollution control measures and recycling of waste water, the quantum of effluent discharged to Nandira has now been reduced considerably, leading to a significant improvement in its water quality and hence at Talcher D/s.
DATA STRUCTURE DETERMINATION AND SOURCE IDENTIFICATION:
Principal component analysis/factor analysiswas performed on the normalized data sets separately for the three different regions, viz., LP, MP and HP, as delineated by CA techniques, to compare the composition structure between analyzed water samples and the factors loadings of each variable. PCA of the three data sets yield eight PCs for LP and two PCs for MP sites while two PCs were obtained for HP sites with each cases having eigen values (Component variance values) >1. An eigen value gives a measure of the significance for the factor, which with highest eigen value is the most significant. Eigen values of 1.0 or greater are considered significant.
LESS POLLUTED SITES:
For the data set pertaining to LP sites, eight PCs were obtained having eigen value >1 as shown in the screen plot for LP sites. Among four PCs, PC1, explaining 58.1807% of the total variance, has moderate positive loadings on Calcium, Magnesium, Iron, TDS, Chlorine, Nitrate, Sulphate and Strong positive loading on pH, Fe, Turbidity and Alkalinity which is attributed to localized anthropogenic input and also due to deamination of nitrogen containing organic compounds rather than river runoffs(Figure 7). PC2, explaining 17.911% of the total variance, moderate positive loadings on Chlorine, Nitrate, and strong positive loadings on Fe, Boron, Sulphate, Fluorine and strong negative loading on Mg, Ca and Turbidity..
PC3, explaining 11.3262% of the total variance, has strong positive loadings on pH, Turbidity, strong negative loading on Chlorine, Alkalinity and Nitrate, moderate positive loading on Sulphate, Fluorine and TDS. PC2 and PC3 represent organic pollution from domestic waste and non-point source pollution. PC4, explaining the lowest variance (6.3741%) has moderate loadings on Fe, Calcium and Nitrate and strong positive loading on pH, Alkalinity which is due to normal biological degradation products of nitrogenous organic matter and the process is repeated for rest of the PCs of less polluted sites.
Table No.3Principal Component Analysis of LP sites
PARAMETERS PC1 PC2 PC3 PC4 PC5 PC6 PC7 PC8
PH 0.0663 -0.0006 0.0626 0.139 0.0711 0.024 0.0806 0.0748
TURBIDITY 0.0334 -0.0123 0.0403
-0.0833 0.0111 0.0439 0.0003 0.0622
TDS 0.0121 0.0081 0.003 0.0044 0.0152 -0.0103
-0.0165 0.0002
CALCIUM 0.0142 -0.0103 -0.0052 0.0018 0.0003 0.025 -0.0054
-0.0208
MAGNESIUM 0.0174 -0.0017 -0.0005 0.0035 -0.0372
-0.0162
-0.0005 0.0135
IRON 0.0452 0.0366 -0.0501 0.0062
-0.0335 0.021 0.0236 -0.0555
CHLORINE 0.018 0.0091 -0.0065
-0.0217 0.018
-0.0229 0.0267 -0.0142
FLUORINE -0.0022 0.0212 0.0025 0.0009 0.0002 0.0074
-0.0113 0.0049 NITRATE 0.0015 0.0002 -0.0069 0.0003 0.0011 0.0016 0.0003 0.0025
SULPHATE 0.0071 0.0143 -0.008 -0.0023
-0.0062 0.0013 0.0008 -0.0023 ALKALINITY 0.0244 -0.0091 -0.0048 0.0117 -0.006 0.0046 0.0048 0.0112
BOR0N -0.0258 0.0274 -0.0012 0.0039
-0.0042 0.0219 0.0432 0.0067 COMPONENT
VARIANCES 6.9817 2.1493 1.3591 0.7649 0.4075 0.2164 0.1211 0 PERCENT VARIANCE
EXPLAINED 58.1807 17.9112 11.3262 6.3741 3.3955 1.8034 1.0089 0
MEDIUM POLLUTED SITES
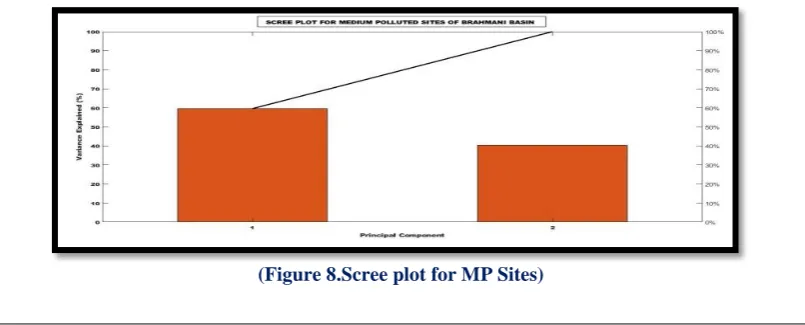
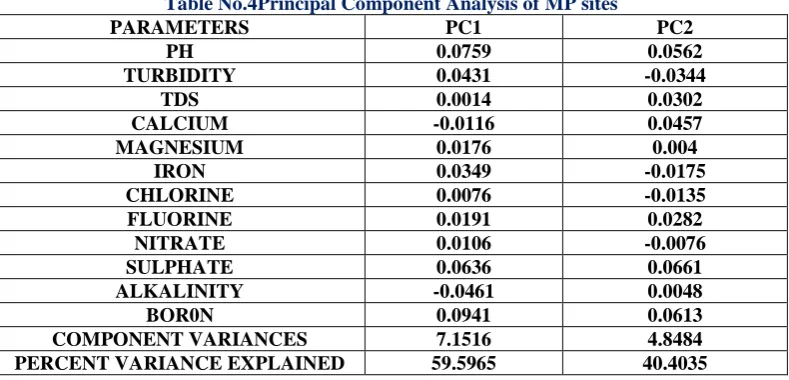
For the data set pertaining to the MP sites, two PCs were obtained having eigen value >1 as depicted in screen plot for MP sites. Among total seven significant PCs, PC1, explaining about 59.5965% of the total variance, has strong positive loading on pH, Fe, Sulphate, Turbidity and moderate positive loadings on TDS, Magnesium and Fluorine(Figure8).These factors represent the contribution of excess localized anthropogenic input into water bodies, runoff from agricultural fields using phosphatic fertilizers and some industrial effluents. PC2, explaining about 40.4035% of the total variance, has strong positive loading on pH, TDS, Sulphur, Fluorine, Boron and moderate loadings on Mg and Alkalinity which represent the direct input of organic matter and domestic wastewater containing chemicals that are susceptible to oxidation from the nearby cities.
Table No.4Principal Component Analysis of MP sites
PARAMETERS PC1 PC2
PH 0.0759 0.0562
TURBIDITY 0.0431 -0.0344
TDS 0.0014 0.0302
CALCIUM -0.0116 0.0457
MAGNESIUM 0.0176 0.004
IRON 0.0349 -0.0175
CHLORINE 0.0076 -0.0135
FLUORINE 0.0191 0.0282
NITRATE 0.0106 -0.0076
SULPHATE 0.0636 0.0661
ALKALINITY -0.0461 0.0048
BOR0N 0.0941 0.0613
COMPONENT VARIANCES 7.1516 4.8484
PERCENT VARIANCE EXPLAINED 59.5965 40.4035
HEAVY POLLUTED SITES:
Lastly, for the data set pertaining to water quality in HP sites, two PCs were obtained having eigen value >1 as shown in the scree plot for HP sites. Among the one PCs, PC1 explaining 87.6845% of total variance, has strong loadings on Turbidity, Iron, Nitrate. This factor can be interpreted as untreated wastewater and sewage disposal from both Rengali and Talcher cities and also industrial effluents. The strong negative loading on NO₃ in PC1, is due to anaerobic conditions in river from the loading of high dissolved organic matter (Figure 5).
(Figure 9.Scree plot for HP Sites)
PC2 explaining about lowest variance of 12.3155% having strong positive loadings on Sulphate, Boron and moderate positive loadings on Turbidity, TDS, Calcium, Fluorine and strong negative loading on pH, Magnesium, Fluorine and Alkalinity. These factors also represent pollution from domestic wastewater and non-point sources. Through the PCA, the sources of the pollutants were identified in the three zones. As mentioned above, it can be helpful to the government and managers, who can lay down different regulations and policies in three zones respectively.
Table No 5. Principal Component Analysis of HP sites:
PARAMETERS PC1 PC2
PH -0.1437 -0.1208
TURBIDITY 0.1669 0.0576
TDS 0.0715 0.0135
CALCIUM 0.0439 0.0391
MAGNESIUM 0.0444 -0.0477
IRON 0.1332 -0.0645
CHLORINE 0.0572 0.0454
NITRATE 0.1716 0.0053
SULPHATE 0.0396 0.1146
ALKALINITY 0.0317 -0.0491
BOR0N -0.1098 0.1248
COMPONENT VARIANCES 10.5221 1.4779
PERCENT VARIANCE
EXPLAINED 87.6845 12.3155
APPLICATIONS:The application of multivariate statistical analysis is an excellent technique for assessment of large and complex databases, generated by continuous monitoring of water quality to evaluate similarity and dissimilarity in the physicochemical characteristic of surface water bodies. These methods can also be used to discern water quality variables responsible for yearly variation among them and to categorize them on the basis of pollution levels besides identifying the source of pollution. Thus these techniques are believed to be valuable for water resource managers to design sampling, analytical protocols and the effective measures to control / management of pollution load in the surface water.
VI. CONCLUSIONS
In this case study, multivariate statistical techniques were used to evaluate spatial variations in surface water quality of the Brahmani river basin. Hierarchical cluster analysis grouped 15 sampling sites into three clusters of similar water quality characteristics. Based on obtained information, it is possible to design an optimal sampling strategy, which could reduce the number of sampling stations and associate costs. Also this analysis allowed the identification of three different zones for LP and MP and HP in the river, with different water quality. The major pollutants in all the three zones arecontributed by local anthropogenic activities rather than agricultural/ land drainage. The intensity of microbial activities and the influx of organic sewage are reflected through the high Turbidity, Iron, and Nitrate values for cluster-III in HP, which are more than the permissible limit for drinking water.The inverse relationship between Calcium with Sulphate and Boron with Fluorine and Alkalinity in HP sites implies that the organic nitrogen part plays a major role in the depletion of DO in the river systems.
The PCs obtained fromprincipal component analysis indicate that parameters responsible for water quality variations are mainly related to untreated or partially treated municipal sewage, domestic and industrial wastewater. With serious situation of water pollution in the Brahmani watershed, the management of water quality of the different zones is becoming more and more important as well as the planning of the whole watershed. According to the sources of pollution, different measures should be adopted, in order to control the total quantity of the pollutants and achieve the goal of sustainable use of the water resources. It could be helpful to managers and government agencies in water quality management. As a result, multivariate statistical methods including factor, principal component, and cluster analysis can be used to understand complex nature of water quality issues and determine priorities to improve water quality.
REFERENCES
[1].
APHA-AWWA-WPCF, 1985. Standard Methods for the Examination of Water and Waste Water. American Public Health Association, Washington, DC.[2].
Almasri, M. L. and J. J. Kaluarachchi (2004). Assessment and management oflongterm nitrate pollution of groundwater in agriculture-domonated watersheds. Journal of Hydrology, I295 (1-4): 225-245.[3].
Abbasi, S. A. and P.C. Nipaney (1995). An assessment of drinking water quality ofthe open wells in Malappuram coast, Kerala. Poll Res. 14 (3): 313-316.[4].
Bishwanath, G. and N. Banerjee, 2004. Impact of informal regulation of pollution on water quality in rivers in India, Journal of Environmental Management, 73: 117-130.[5].
Banerjee S.K., M. Banerjee and K.M. Agarwal (1999). Study of Tikara and Brahmaniriver ecosystems. Env Eco, 17(2): 296-305[6].
Kaur, H., J. Syal and S.S. Dhillon (2001). Water quality index of the river Satluj. PollRes., 20(2): 199-204.[7].
Kamal D., Khan A.N., Rahaman M.A. and Ahamed F. (2007). Study on the physic-chemical properties of water of Mouri River, Khulna, Bangladesh. Pakistan Journal of Biological Sciences, 10 (5): 710-717.[8].
Khan F., Husain T. and Lumb A. (2003). Water quality evaluation and trend analysis in selectedwatersheds of theMahanadi Basin. Journal of Environmental Monitoring Assessment,. 88:221-242.
[9].
Karnchanawong, S. and S. K. T. Ikeguchi (1993). Monitoring and evaluation of shallow well waterInternational organization of Scientific Research
59 | Page
[10].
Kataria, H.C. (1995). Turbidity measurement in groundwater of Bhopal city. J NatureConservators, 7(1):79-82.
[11].
Koshy, M. and V. Nayar (1999). Water quality aspects of river Pambha. Poll Res.,18(4): 501-510.[12].
Koshy, M., T. VasudevanNayar (2000). Water quality of river Pambha atKozhencherry. Poll Res., 19(4):665-668.