An Optimization of Laser Welding for Bead
Width and Weld Hardness
Rajbeer Singh Sandeep Singh Sangwan
M. Tech. Research Scholar Assistant Professor
Department of Mechanical Engineering Department of Mechanical Engineering Universal Institute of Engg & Tech, Lalru, Punjab, India Universal Institute of Engg & Tech, Lalru, Punjab, India
Abstract
In today world the need for a optimized technique which can easily join two dissimilar materials in increasing day rapidly. Dissimilar joints are important because of both economical and technical aspects, because a satisfactory service can be provided in cost reduction and performance by these joints. The demand for such joints in industry is huge. So, the study of dissimilar material welding is of a great interest for many of the researchers. In the paper work two dissimilar materials namely 1020 Mild steel and AISI 1552 were used in configuration of lap joint for laser welding. The process parameters are Laser Power, Scan Speed and Pulse Frequency at four levels were taken for the optimization process. Two response parameters namely weld hardness and Bead width was considered for different combinations of process parameters. Laser power and Frequency was found most effective parameters. The predicted values by the model were fairly close to the observed, which indicates that the model can be used to predict the values of responses within the range of parameter studied.
Keywords: Welding, Laser Welding, Bead Width, Bitumen. Weld Hardness
________________________________________________________________________________________________________
I.
INTRODUCTION
The laser beam is an efficient technique to join different metals. Laser beam welding is a welding process used to join two metals by the use of a laser source. The laser source provides an intense and high density heat source, allowing for narrow, deep weld bead with high welding scan speed. In today world the need for a optimized technique which can easily join two dissimilar materials in increasing day rapidly. Dissimilar joints are important because of both economical and technical aspects, because a satisfactory service can be provided in cost reduction and performance by these joints. The demand for such joints in industry is huge. So, the study of dissimilar material welding is of a great interest for many of the researchers. [1]
In industrial process and application laser welding has high advantage due to its high degree of automation; high degree of power density and also it has very high degree of production rate. Again the quality of the weld joints produced by laser welding is very good. And the parameters of laser welding plays important role in determining quality of the weld. Since the demand of a product depends mostly on its quality, the parameters of laser welding should be optimized properly so as to find good weld quality.
The focus of this paper is to perform the evaluation between two dissimilar materials namely 1020 Mild steel and AISI 1552 was used for laser welding in lap joint configuration, so it may help future researcher which tends to exceed in the field of laser welding which is a key area in the mechanical engineering which serves as a base for many of industries such as ship building, construction in fields of robotics and other applications. [3].
II.
TECHNIQUES USED FOR OPTIMIZATION
Taguchi Method: A.
For high quality manufacturing systems Taguchi’s philosophy is very widely used in industries. On the basis of orthogonal array experiments a Japanese consultant of quality management named Dr. Genichi Taguchi developed this system. This system provides optimum setting for process control parameters and much-reduced variance for the experiment. Thus in Taguchi method the integration of design of experiments helps to achieve desired results with parametric optimization of process. Orthogonal array (OA) provides a set of well-balanced (minimum experimental runs) experiments and Taguchi’s signal-to-noise ratios (S/N), which is logarithmic functions of desired output serve as objective functions for optimization. This technique helps in data analysis and prediction of optimum results. In order to evaluate optimal parameter setting Taguchi method uses a statistical measure of performance called signal-to-noise ratio. The S/N ratio takes both the mean and the variability into account. The S/N ratio is the ratio of the mean (signal) to the standard deviation (noise). The use of the S/N ratios is generally as follows: [6]
Table – 1 Signals To Noise Ratio Signal-to-Noise Ratio Use when the goal
is to: And your data are:
Larger is better Maximize the
response Positive
Smaller is better Minimize the
response Non-negative with a target value of zero
Nominal is best
Target the response and you want to base the S/N ratio
on standard deviations only
Positive, zero, or negative
Larger Is Better: 1)
Where,
Smaller Is Better: 2)
Where,
Nominal Is Better: 3)
Where,
d= Diameter in mm
Fig. 1: Vicker Hardness Testing Machine The Samples Display of the Vicker Hardness:
A.
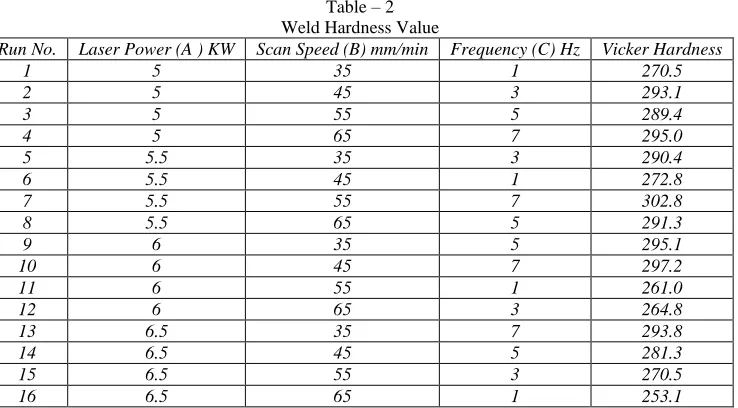
Table – 2 Weld Hardness Value
Run No. Laser Power (A ) KW Scan Speed (B) mm/min Frequency (C) Hz Vicker Hardness
1 5 35 1 270.5
2 5 45 3 293.1
3 5 55 5 289.4
4 5 65 7 295.0
5 5.5 35 3 290.4
6 5.5 45 1 272.8
7 5.5 55 7 302.8
8 5.5 65 5 291.3
9 6 35 5 295.1
10 6 45 7 297.2
11 6 55 1 261.0
12 6 65 3 264.8
13 6.5 35 7 293.8
14 6.5 45 5 281.3
15 6.5 55 3 270.5
16 6.5 65 1 253.1
Taguchi Analysis: Weld Hardness Vs Laser Power, Scan Speed & Frequency: B.
Fig. 2: Main Effect Plot for S/N Ratio (Weld Hardness)
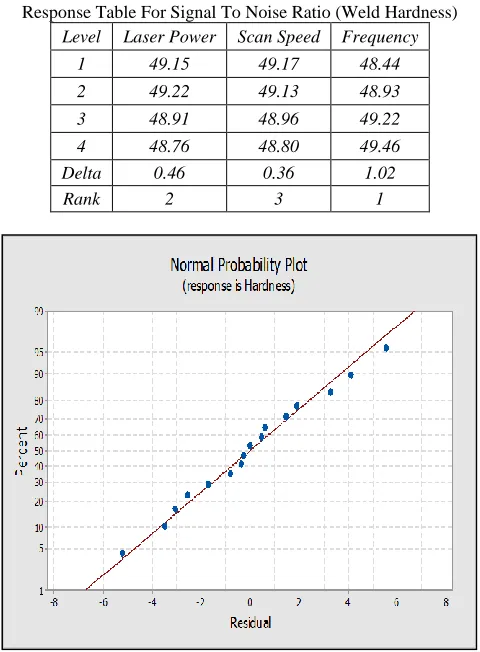
And on these values weld hardness will be maximum. So A2B1C4 will be the optimal parameter combination for highest value of weld hardness. Rank values indicates the relative importance each factor to the response. Delta shows the differences between the highest value of all the three factors for signal to noise ratio and for means here which has the highest delta, gets the highest rank as shown table 5.2 .The rank and delta values for various parameters shows that the frequency has the greatest effect on weld hardness and is followed by laser power and scan speed.
Table – 3
Response Table For Signal To Noise Ratio (Weld Hardness) Level Laser Power Scan Speed Frequency
1 49.15 49.17 48.44
2 49.22 49.13 48.93
3 48.91 48.96 49.22
4 48.76 48.80 49.46
Delta 0.46 0.36 1.02
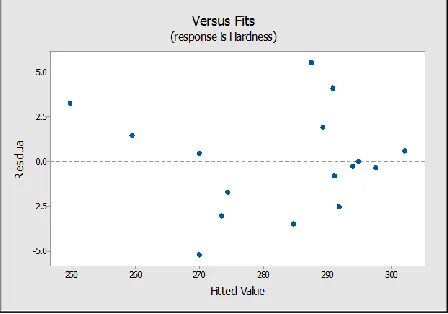
The residuals in the figure 5.4 are randomly distributed across the residuals versus the predicted plot. This figure 5.4 shows that there is no obvious pattern and unusual structure present in the data which indicates that the residuals analysis does not show any model inadequacy.
Fig. 4: Residuals versus the Fitted Values for Weld Hardness
Anova Test Results for Weld Hardness: 1)
General linear model ANOVA Was used for checking the significance of the purposed model. MINI TAB version 17 was used for plotting the ANOVA table.
Table – 4
General Linear Model of Anova for Weld Hardness
Source DF Adj SS Adj MS F P Contribution %
Laser Power 3 547.4 182.46 8.84 0.013 16.12% Scan Speed 3 325.9 108.64 5.26 0.041 9.60%
Freq. 3 2396.7 798.91 38.71 0.000 70.61%
Error 6 123.8 20.64
Total 15 3393.9
First of all we draw the ANOVA table to check the adequacy of the model ANOVA table is shown in table 5.3, the calculations are done at 95% confidence level. In an analysis of variance table, the P value determines the most significant factor. The factor whose P value is less than 0.05 will be most effective factor. The ANOVA table clearly indicates that all the three parameters are significant, means that these terms influence the model to a great extent. Frequency has the greatest effect on weld hardness and is followed by laser power and scan speed.
General Regression Equation for Weld Hardness: 2)
The equation has been formed with the help of software MINI TAB version 17, the equation is given below. Weld Hardness = 334.5 - 9.35
Laser Power - 0.394 Scan Speed+ 5.406 Frequencies
Optimized Result for Weld Hardness: 3)
As weld hardness is the “larger is better: type quality type characteristic, from the figure 5.2 it is cleared that second level of laser power (A2) 5.5 KW, first level of scan speed(B1) 35 mm/min and fourth level of frequency(C4)7 Hz results in maximum value of weld hardness.
Table - 4
Comparisons Of Results For Weld Hardness
Sr. No. Laser Power Scan Speed Frequency
Hardness
Actual Predicted
1 5.5 KW 35mm/min 7 HZ 309.3 307.12
Table – 5
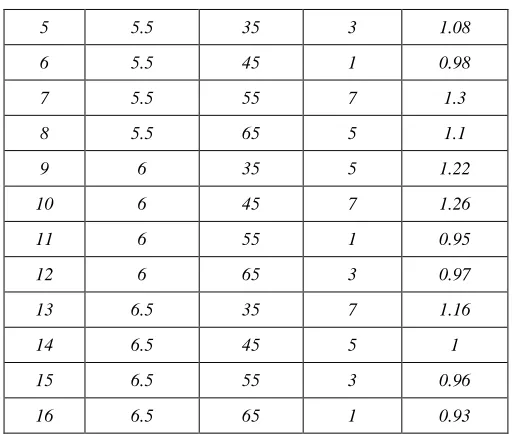
Results of Bead Width for Samples
Run No. Laser Power Scan Speed Frequency Bead Width
1 5 35 1 0.96
2 5 45 3 1.14
3 5 55 5 1.05
5 5.5 35 3 1.08
6 5.5 45 1 0.98
7 5.5 55 7 1.3
8 5.5 65 5 1.1
9 6 35 5 1.22
10 6 45 7 1.26
11 6 55 1 0.95
12 6 65 3 0.97
13 6.5 35 7 1.16
14 6.5 45 5 1
15 6.5 55 3 0.96
16 6.5 65 1 0.93
Taguchi Analysis: Bead Width Vs Laser Power, Scan Speed & Frequency: C.
In the figure 5.5 the lower value of each factor shows the optimal solution for the data means. So from the figure 5.5 it is cleared that 6.5 KW of laser power, 65 mm/min scan speed and 1 Hz frequency are the values for the optimal solution for Data means. And on these values Bead width will be minimum. So A4B4C41will be the optimal parameter combination for lowest value of Bead width.
Rank values indicates the relative importance each factor to the response. Delta shows the differences between the highest value of all the three factors for signal to noise ratio and for means here which has the highest delta, gets the highest rank as shown in table 5.6 .The rank and delta values for various parameters shows that the frequency has the greatest effect on Bead width and is followed by laser power and scan speed.
Fig - 5 Main Effect Plots For Data Means (Bead Width) Table - 6
The residuals can be said to follow the straight line in normal probability plot of residuals that means the errors are distributed normally as shown in figure 5.6. And it is concluded that there are some points which are far away from the normal line shows that these are not significant values and some work has to be done for making them significant.
The residuals in the figure 5.7 are randomly distributed across the residuals versus the predicted plot. This figure 5.7 shows that there is no obvious pattern and unusual structure present in the data which indicates that the residuals analysis does not show any model inadequacy.
Fig. 6: Normal Probability Plot of the Residuals for Bead Width
Fig. 7: Residuals versus Fitted Values for Bead Width
ANOVA Test Results for Bead Width: 1)
Table – 7
General Linear Model Of Anova For Bead Width
Source DF Adj SS Adj MS F P Cont%
Laser Power 3 0.024925 0.008308 1.68 0.046 12% Scan Speed 3 0.007875 0.002625 0.53 0.677 3.5% Freq. 3 0.160325 0.053442 10.81 0.008 72.07%
Error 6 0.029650 0.004942 - - -
Total 15 0.222775 - - - -
General Regression Equation for Bead Width: 2)
The equation has been formed with the help of software MINI TAB version 17, the equation is given below. Weld Hardness = 1.276 – 0.0480
Laser Power – 0.00195 Scan Speed+ 0.04400 Frequencies
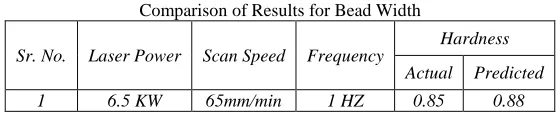
Optimized Results for Bead Width: 3)
As Bead width is the “lower is better: type quality type characteristic, from the figure 5.5 it is cleared that fourth level of laser power (A4) 6.5 KW, fourth level of scan speed(B4) 65 mm/min and first level of frequency(C1) 1 Hz results in minimum value of Bead width.
Table - 8
Comparison of Results for Bead Width
Sr. No. Laser Power Scan Speed Frequency
Hardness
Actual Predicted
1 6.5 KW 65mm/min 1 HZ 0.85 0.88
IV.
CONCLUSION
In the previous chapters, the effect of process parameters of Laser beam welding on response variables such as weld hardness and Bead width rate has been discussed. Also the level of importance of welding parameters for each of response variable has been found out using ANOVA. An optimal set of process variables for each response which gives optimum performance has been investigated using technique. The important conclusions drawn from the present study are summarized below:
1) The process parameters and their ranges are chosen for the present study.
2) The effect of process parameters i.e. laser power, scan speed and frequency on response variables such as weld hardness and Bead width has been thoroughly studied. The level of significance of process parameters for each response variable has been investigated using ANOVA.
3) Frequency was found to be the most significant factors influencing all responses investigated for both the experiment sets.
4) 4. Optimal process parameters for maximum weld hardness have been found and as laser power 5.5 KW, scan speed 35 mm/min and frequency 7 Hz.
5) 5. Optimal process parameters for minimum Bead width have been found and as laser power 6.5 KW, scan speed 65 mm/min and frequency 1 Hz.
ACKNOWLEDGMENT
The author wants to heartily thank his guide Er. Sandeep Singh Sangwan, Department of Mechanical Engineering, Universal Institute of Engineering & Technology, Lalru, Punjab, India under Punjab Technical University, Jalandhar, Punjab for their critique discussion, constant encouragement, valuable suggestion and timely guidance.
REFERENCES
[1] Acherjee B., Kuar A. S., Mitra S. and Misra D., “Modeling and analysis of simultaneous laser transmission welding of polycarbonates using an FEM and RSM combined approach,” Optics and Laser Technology, 44 (2012): pp. 995–1006
[2] Akio Hirose, Hirotaka Todaka, Hiroto Yamaoka, Nobutaka Kurosawa, Kojiro F Kobayashi, “Quantitative Evaluation of Softened Regions In Weld Heat Affected Zones of 6061 T6 Aluminum alloy Characterizing Of The Laser Beam Welding Process ,”Metallurgical And Materials Transactions A, 30, (1999): pp. 2115-2120.
[3] E.M. Anawa, and A.G. Olabi, “Optimization of tensile strength of ferritic/austenitic laser welded Components”, Optics and Lasers in Engineering 46, 571– 577 2008
[4] E. M. Anawa, A. G. Olabi, and F. A. Elshukri,“Modeling and optimization of tensile shear strength of Titanium/ Aluminum dissimilar welded component”, IOP Publishing, 7th International Conference on Modern Practice in Stress and Vibration Analysis, Conference Series 181, 2009.
[5] Dongcheol Kim, Sehun Rhee, “Optimization of GMA welding process using the dual response approach,” International Journal of Production Research, February 2004, pp 4505-4515