www.pharmascholars.com
116
Research Article
CODEN: IJPNL6
A RP-HPLC METHOD DEVELOPMENT AND VALIDATION FOR THE ESTIMATION
OF DIHYDRALAZINE IN BULK AND PHARMACEUTICAL DOSAGE FORMS
Saroj Kumar Raul
1*, B.V.V Ravi kumar
2, Ajaya Kumar Pattnaik
3and Nagireddy Neelakanta
Rao
41
M .R. College of Pharmacy, Phool-Baugh, Vizianagaram, A.P, India
2Roland Institute of Pharmaceutical Sciences, Berhampur, Orissa, India
3Departments of Chemistry, Ravenshaw University, Cuttack, Orissa, India
4Suraksha Pharma Ltd, Suraksh Towers, Hyderabad, A.P, India
*Corresponding author e-mail:
[email protected]
ABSTRACT
A simple, selective, linear, precise and accurate RP-HPLC method was developed and validated for rapid assay of Dihydralazine in pharmaceutical dosage form. Isocratic elution at a flow rate of 0.8 mL min -1 was employed on a Hypersil C18 column at 40oC. The mobile phase consisted of phosphate buffer: acetonitrile 98:2 (v/v) and the detection wavelength was at 305 nm. Linearity was observed in concentration range of 25-150 μg/mL. The retention time for Dihydralazine was 2.75 min. The method was validated as per the ICH guidelines. The proposed method can be successfully applied for the estimation of Dihydralazine in pharmaceutical dosage forms.
Keywords: Estimation, Method development, Validation, Dihydralazine, RP-HPLC. .
INTRODUCTION
Dihydralazine (Figure1) is a drug with antihypertensive properties[1]. It belongs to the hydrazinophthalazine chemical class and it has very similar effects to hydralazine. Chemically it is described as 4-hydrazinyl-1-hydrazinylidene-1, 2-dihydrophthalazine[2].Dihydralazine is a direct-acting vasodilator which acts predominantly on the arterioles. It reduces BP and peripheral resistance thus increasing cardiac output. It also tends to improve renal and cerebral blood flow and its effect on diastolic pressure is more marked than on systolic pressure.
Literature survey reveals that more work has not carried out on this particular drug and very few analytical methods [3-5] has been reported for the estimation of Dihydralazine. The aim of the present study is to develop a simple, precise and accurate reversed-phase HPLC method for the estimation of
Dihydralazine in pharmaceutical dosage form as per ICH guidelines.
MATERIALS AND METHOD
Instrumental and analytical conditions : The HPLC analysis was carried out on Waters HPLC system (2695 module) equipped with PDA detector (2996 module) with auto Sampler and running on Waters Empower software. The column used is Hypersil C18 (150 × 4.6 mm, packed with 5 µm) and detection was performed at 305 nm. The injection volume of sample was 20 µL and the run time was 7 minutes. An isocratic mobile phase containing 0.025M phosphate buffer and acetonitrile at 98: 2 (v/v) at the pH 3 was carried with the flow rate at 0.8mL min-1. The mobile phase was filtered through 0.45µm membrane filter and degassed before use.
Reagents and chemicals: Dihydralazine working standard was kindly gifted by Ordain Health Care
International Journal of Pharmacy
www.pharmascholars.com
117
Private limited, Chennai. Tablets were purchased from local pharmacy manufactured by Ordain healthcare (Apresol). Ultra pure water was obtained from a millipore system. HPLC grade acetonitrile was obtained from Merck (India) limited. All other chemicals used were AR grade.
Preparation of mobile phase: 3.4 gm of Potassium Di hydrogen orthophosphate dissolved in 1000 mL of water and mixed, pH adjusted to 3 with ortho phosphoric acid, sonicated to degas the buffer. Transferred 20 volumes of acetonitrile and 980 volumes of buffer into a 1000 volumes mobile phase bottle and mixed. Then sonicated up to 15 minutes for degas the mobile phase and filtered through 0.45 μm filter under vacuum. Acetonitrile and buffer in the ratio of 50:50 (v/v) used as diluent.
Preparation of Standard Solution: Accurately weighed about 10 mg of Dihydralazine and transferred into a 10mL volumetric flask and 7 mL of HPLC grade water was added and sonicate to dissolve it completely and the volume was adjusted with the diluent to get stock solution of 1000 µg/mL. Then 1 mL of stock solution is transferred into 10 ml volumetric flask and make up to volume with diluent and filter through 0.45 μm filters, which gives a solution of strength 100 µg/mL.
Preparation of sample solution: Weigh 20 Dihydralazine tablets and calculate the average weight. Accurately weigh and transfer the sample equivalent to 50 mg of Dihydralazine into a 50 ml volumetric flask. Add about 35ml of diluent, sonicate to dissolve it completely and make volume up to the mark with diluent. Mix well and filter through 0.45 μm filter. Further pipette 1 ml of the above stock solution into a 10 ml volumetric flask and dilute up to the mark with diluent. Mix well and filter through 0.45 μm filter.
METHOD VALIDATION
The objective of the method validation is to demonstrate that the method is suitable for its intended purpose as it is stated in ICH guidelines. The method was validated for linearity, precision, accuracy, specificity, limit of detection, limit of quantification, robustness and system suitability.
Linearity: From the standard stock solution, the various dilutions of Dihydralazine in the concentration of 25, 50, 75, 100, 125 and 150µg/mL were prepared. The solutions were injected using 10 μL injection volumes in to the chromatographic system at the flow rate of 0.8mLmin-1 and the
effluents were monitored at 305 nm, chromatograms were recorded. Calibration curve of Dihydralazine was obtained by plotting the peak area ratio versus the applied concentrations of Dihydralazine, given in table 1. The linear correlation coefficient was found to be 0.999, shown in figure2.
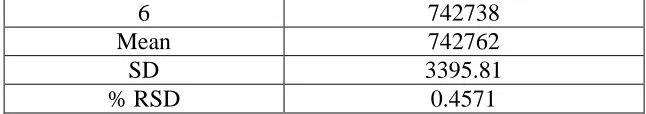
Precision: Repeatability of the method was checked by injecting replicate injections of 100 μg/mL of the solution for six times on the same day as intraday precision study of Dihydralazine and the % RSD was found to be 0.45, given in table 2.
Accuracy: Dihydralazine reference standards were accurately weighed and added to a mixture of the tablets excipients, at three different concentration levels (50%, 100% and 150%). At each level, samples were prepared in triplicate and the recovery percentage was determined and presented in table 3
Specificity: Spectral purities of Dihydralazine chromatographic peaks were evaluated for the interference of the tablet excipients as per the methodology. In the work, a solution containing a mixture of the tablet excipients was prepared using the sample preparation procedure to evaluate possible interfering peaks and no interference peaks were observed.
Robustness: To determine the robustness of the method, two parameters (temperature, composition of mobile phase) from the optimized chromatographic conditions were varied. Statistical analysis showed no significant difference between results obtained employing the analytical conditions established for the method and those obtained in the experiments in which variations of parameters were introduced. Thus the method showed to be robust which is shown in table 4.
Ruggedness: Inter day variations were performed by using six replicate injections of standard and sample solutions of concentrations which were prepared and analyzed by different analyst on three different days over a period of one week. Ruggedness also expressed in terms of percentage relative standard deviation and statistical analysis showed no significant difference between results obtained employing different analyst.
www.pharmascholars.com
118
method is the quantitation of Dihydralazine so that the values obtained should be considered as the limit of method sensitivity.
System Suitability: System suitability tests were carried out on freshly prepared standard stock solutions of Dihydralazine and it was calculated by determining the standard deviation by injecting standards in six replicates at 6 minutes interval and the values were recorded and the system suitability parameters are shown in table 5.
Assay of Dihydralazine tablet: Three different batches of Apresol were analyzed using the validated method. For the analysis, six replicates of each batch were assayed. Twenty tablets were weighed and finely powdered. An accurately weighed portion of the powder, equivalent to about 50mg of Dihydralazine was transferred to a 50 ml volumetric flask followed by the addition of 35 ml of diluent .The solution was sonicated for 10 minutes and volume adjusted with the diluents then filtered through 0.45 μm membrane filter. Further dilutions were made to get the final concentration equivalent to 100 µg/mL of Dihydralazine. The mean peak area of the drug was calculated and the drug content in the tablets was quantified and the results were presented in table 6. All the analyzed batches presented Dihydralazine were very close to the labeled amount. The Dihydralazine content in the tablets samples varied from 98.9 to 99.8%.
RESULTS AND DISCUSSION
The nature of the sample, its molecular weight and solubility decides the proper selection of the stationary phase. The drug Dihydralazine was
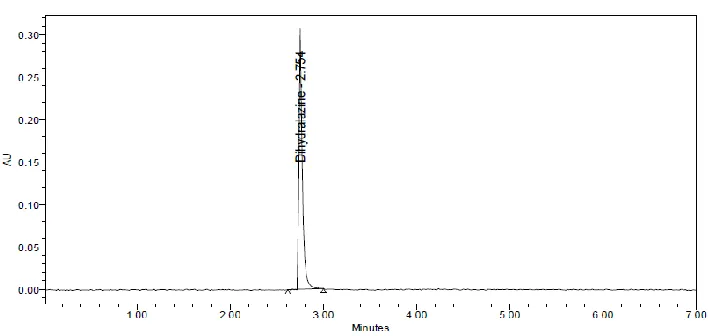
preferably analyzed by reverse phase chromatography and accordingly C18 column was selected. The elution of the compound from the column was influenced by polar mobile phase. The ratio of the phosphate buffer to acetonitrile was optimized to give symmetric peak with short run time. Different mobile phases were tried but satisfactory separation, well resolved and good symmetrical peaks were obtained with the mobile phase of buffer: acetonitrile at the ratio of 98:2 (v/v).The retention time of Dihydralazine was found to be 2.75 min, which indicates a good base line. The RSD values for accuracy and precision studies obtained were less than 2% which revealed that developed method was accurate and precise. The system suitability parameters are given in Table 5. Developed chromatographic method was applied for the determination of Dihydralazine in tablet formulation, given in table 7. A typical chromatogram showing the separation of Dihydralazin is shown in figure 3.
CONCLUSIONS
A validated RP-HPLC method has been developed for the determination of Dihydralazine in tablet dosage form. The proposed method is simple, rapid, accurate, precise and specific. Therefore, it is suitable for the routine analysis of Dihydralazine in pharmaceutical dosage form.
ACKNOWLEDGEMENTS
The authors are thankful to Ordain Health Care Private limited, Chennai for providing gift sample of Dihydralazine.
www.pharmascholars.com
119
Figure 2:
Linearity curve of Dihydralazine
Figure 3:
Standard Chromatogram of Dihydralazin
Table 1
: Linearity of Dihydralazine
Concentration (µg/mL)
Average area
25
211621
50
410260
75
589507
100
787958
125
976311
150
1200636
Table 2:
Precision of Dihydralazine
Injections
Area
1
740657
2
740758
3
740054
4
743143
www.pharmascholars.com
120
6
742738
Mean
742762
SD
3395.81
% RSD
0.4571
Table 3
: Accuracy of Dihydralazine
%Conc
Amount
added
(mg)
Amount
found
(mg)
% Recovery
Mean
Recovery
50%
5.0
4.94
98.8 %
99.4%
100%
10.0
9.92
99.2%
150%
15.0
14.89
99.27 %
Table 4:
Robustness of Dihydralazine
Parameters
Adjusted to
Average
Area
R
tSD
% RSD
Temperature as per
method
40
oC
38
0C776413
2.761 3918.8
0.50
As it is
750142
2.759 3393.2
0.45
42
0C710694
2.723 3897.6
0.54
Mobile phase
composition
Buffer:Acetonitrile
(98:2)
Buffer:Acetonitrile (99:1)
762132
2.762 4172.5
0.55
As it is
748975
2.757 3187.8
0.43
Buffer:Acetonitrile (97:3)
713882
2.718 5525.8
0.77
Table 5:
System Suitability of Dihydralazine
Concentration Injection
Area
R
t100 µg/mL
Inj-1
751446
2.757
Inj-2
749045
2.767
Inj-3
747306
2.754
Inj-4
743278
2.767
Inj-5
744816
2.757
Inj-6
743422
2.755
Statistical
Analysis
Mean
746552.2
2.7595
SD
3294.373
0.005925
% RSD
0.44
0.21
Tailing Factor
1.49
www.pharmascholars.com
121
Table 6:
Contents of Dihydralazine in tablets (n=6)
Sample
tablet
Batch
L
abel
Claim(mg)
Amount
found(mg)±SD
%Amount
found
Apresol
(25mg)
1
2
3
10
10
10
9.96±0.12
9.89±0.08
9.98±0.14
99.6
98.9
99.8
S.D=Standard Deviation
Table7:
Developed Chromatographic Conditions
Parameters
Method
Stationary phase (column)
HypersilC18 (150 × 4.6 mm, packed with 5 µm)
Mobile Phase
98:2 (Phosphate buffer : Acetonitrile)
pH
3 ± 0.02
Flow rate (ml/min)
0.8
Run time (minutes)
7.0
Column temperature (°C)
40
Volume of injection loop (
l)
20
Detection wavelength (nm)
305
Drugs Rt (min)
2.75
REFERENCES