Performance Comparison of a Typical Nonlinear Load
Supplied by ac and dc Voltages
Tiago J. C. Sousa
1,*, Vítor Monteiro
1, J. G. Pinto
1and João L. Afonso
11Centro ALGORITMI, University of Minho, Campus de Azurém, Guimarães, Portugal
Abstract
This paper presents a performance comparison of a typical nonlinear load when supplied by ac or dc voltages with the same rms value. The performance of the nonlinear load towards its connection to ac and dc power grids is accomplished in terms of the waveforms and efficiency. A simulation model was developed using realistic database models of the power semiconductors comprising the load, and an experimental setup was assembled, so that the efficiency can be determined and compared for simulation and real operating conditions. Three distinct cases were considered for this study: (1) Load supplied by ac voltage; (2) Load supplied by dc voltage; and (3) Load without the input ac-dc converter supplied by dc voltage. The obtained results show that supplying nonlinear loads with dc power grids is advantageous in relation to the ac power grid, and therefore it can be beneficial to adapt nonlinear loads to be powered by dc power grids.
Keywords: ac Grids, dc Grids, dc Smart Homes, Nonlinear Loads, Efficiency.
Received on 11 April 2019, accepted on 11 November 2019, published on 21 November 2019
Copyright © 2019 Tiago J. C. Sousaet al., licensed to EAI. This is an open access article distributed under the terms of the Creative Commons Attribution licence (http://creativecommons.org/licenses/by/3.0/), which permits unlimited use, distribution and reproduction in any medium so long as the original work is properly cited.
doi: 10.4108/eai.13-7-2018.161748
*Corresponding author. Email:[email protected]
1. Introduction
Dc power transmission and dc grids have gained attention over the past few years. In the last century, ac power transmission was preferred due to transformers, which allow the changing of voltage and current levels in a reliable and efficient manner. Despite being heavy and bulky, transformers were a more suitable solution than power electronics-based converters towards the advent of power transmission, more than one hundred years ago. However, power electronics has been undergoing a significant development since the second half of the last century. This led to the establishment of the high voltage dc (HVDC) transmission systems, which was not only a research target at that time [1]-[9], but with real applications in the recent years [10]-[17]. In HVDC transmission systems, skin effect and voltage drops due to the conductors’ reactance are inexistent when compared to ac power transmission. Moreover, HVDC power
transmission can reduce power transmission losses even further with the appliance of superconductivity [18]-[24].
Besides the advent of HVDC transmission systems, the development of power electronics contributed to the implementation of more efficient and lower power demanding electrical loads. These loads are named nonlinear loads, i.e., the relation between the supplied voltage and the consumed current is not linear. This phenomenon gave rise to the widely known harmonic issues [25]-[29], as well as the respective proposed compensation techniques [30]-[34].
From the power grid point of view, nonlinear loads are comprised by a diode full-bridge ac-dc converter in the input, therefore operating in dc power at the output. In fact, this type of connection is present in the vast majority of domestic appliances, such as computers, televisions, modern refrigerators and modern lighting equipment such as compact fluorescent and light emitting diode (LED) lamps. Accordingly, the operation of nonlinear loads, both from the power grid and from the load point of view, can be improved if the traditional ac voltage supply is
replaced by a dc voltage supply with equivalent rms value. Besides the electrical loads, the paradigm of dc grids is also more suitable than ac grids, which is proved by the dc systems based on photovoltaics, fuel cells and batteries. Dc microgrids are also an attractive asset for future power systems [35]-[36] and can also be used for wind and wave power generation [37]. With the dc approach, the power conversion stages can be reduced and the efficiency can be improved, whereby dc smart homes represent a viable alternative in the near future [38]-[41].
In this context, this paper presents a study about the performance of a typical nonlinear load connected to ac and dc power grids. The differences between the two types of power grids are analyzed in terms of consumed current and, consequently, power. A comparison is also made in terms of efficiency and a third case is considered, aiming to improve the efficiency of the type of nonlinear load under study in dc power grids. The analyses are based on simulation results using realistic database models of the power semiconductors comprising the load, in an initial step, and then based on experimental results obtained with a developed laboratorial setup.
The paper is structured as follows: Section 2 presents the nonlinear load under analysis; Section 3 presents the developed simulation model and the obtained results in terms of waveforms and efficiency comparison; Section 4 presents the experimental setup and the obtained results, also in terms of waveforms and efficiency comparison; finally, Section 5 finalizes the paper with the conclusions.
2. Load Analysis: Electrical Model
This section presents the electrical model of the load under analysis in this paper. As aforementioned, the typical loads used in domestic appliances are nonlinear loads. These loads are mainly comprised by an ac-dc converter, typically a diode full-bridge ac-dc converter with a filter capacitor, which converts the input ac voltage into an unregulated dc voltage. A dc-dc converter is connected downstream the filter capacitor in order to adjust the rectified voltage to the desired value, as well as to minimize its ripple. This load is basically a power supply that can be found in computers, televisions, modern refrigerators and battery chargers, for instance. Figure 1 depicts this type of load, where the aforementioned elements can be seen. The ac-dc converter is comprised by diodes D1 to D4 and contains a filter capacitor (Cdc) in order to smooth the dc-link voltage (vdc) and an input inductive filter (Lg) in order to smooth
the absorbed grid current (ig). The dc-dc converter (S1, D5, Lo and Co) is a buck converter, whose function is to step-down the dc-link voltage (vdc) into a controlled output voltage (vo) with low ripple. Additionally, a resistor is connected in the output (Ro) to emulate the power consumption of the load.
3. Simulation Model and Results
This section presents the simulation model developed in the software PSIM v9.1 and the subsequent performed analysis for the nonlinear load described in the previous section when fed by ac and dc power. Three different cases are considered: (1) Load supplied by an ac voltage (Figure 2 (a)); (2) Load supplied by a dc voltage (Figure 2 (b)); and (3) Load without the input ac-dc converter supplied by a dc voltage (Figure 2 (c)). Case 1 represents the traditional connection of the considered nonlinear load to an ac power grid. Case 2 represents the same load connected to a dc power grid instead, meaning the case of a traditional nonlinear load connected in a possible dc home that can also be connected in a regular ac power grid. On the other hand, Case 3 represents a possible evolution suffered by the considered type of load, being possible to discard the diode full-bridge ac-dc converter since both the input and the output are dc. However, this type of load can operate only in a dc power grid, whereby this scenario is only feasible when dc smart homes and dc grids would be widespread. Furthermore, Case 3 is more prone to failure, as the input terminals of the load are polarized; an input voltage with a reverse polarity cannot supply the load properly and even can
(a)
(b)
(c)
Figure 2. Considered cases for the analyzed nonlinear load: (a) Case 1 - Load supplied by ac voltage;
(b)Case 2 - Load supplied by dc voltage; (c)Case 3 - Load without the input ac-dc converter
destroy the electronic components, while a diode full-bridge ac-dc converter assures a fixed polarity in the dc-link voltage. Nevertheless, this issue can be solved by adopting a polarized plug for this type of load, assuring that it is only connected in one possible way.
The parameters considered in the simulation model for the ac and dc power grids and the loads are listed in
Table 1. It should be mentioned that the value of 24 V used in the ac power grid refers to the secondary side of a 230 V/24 V transformer, typically included in this type of loads, whereby the transformer is excluded from the analysis in order to compare the same load being supplied with ac and dc power.
In order to perform an efficiency evaluation for the three cases, realistic database models of diodes and MOSFETs were used. The diodes used in both ac-dc and dc-dc converters are ST Microelectronics STTA206S (600 V, 8 A), and the MOSFET used in the dc-dc converter is International Rectifier IRF1010EZ (60 V, 75 A) switched at 20 kHz. It should be referred that the focus of analysis is the efficiency comparison between the cases and not the efficiency values per se.
3.1. Waveform Comparison
This section compares the waveforms of the main voltage and current quantities of the system comprised by the power grid and the load. In this analysis, only Cases 1 and 2 are scrutinized so that a comparison of ac and dc voltage supply with the same rms value for the same connected load is performed.
The waveforms of the current consumed by the nonlinear load from the power grid point of view can be seen in Figure 3, where ig_ac relates to the ac power grid and ig_dc to the dc power grid. As expected, the input current of this type of load presents a distorted waveform when supplied by ac voltage, while presenting a constant value when supplied by dc voltage. Besides the difference in the waveforms, the current rms values also differ for the same rms supply voltage, being 1.1 A and 0.75 A for ac and dc voltage, respectively. This can be explained by
the consumption of reactive power in the ac case, which in dc does not exist.
Besides the differences in the grid current, the connection of this type of load to ac or dc power grids also results in differences in the dc-link voltage, i.e., the voltage rectified by the diode full-bridge ac-dc converter and the input voltage of the buck dc-dc converter. Figure 4 shows the waveforms of the dc-link voltage for the same load when supplied by an ac power grid (vdc_ac) and when supplied by a dc power grid (vdc_dc). As expected, the dc-link voltage in Case 1 exhibits a double grid frequency ripple (100 Hz) resultant from the ac-dc power conversion, while the ripple in Case 2 is negligible. Besides, the average value of the dc-link voltage is higher in the Case 1 (29.5 V) because the 24 V rms sinusoidal voltage has a peak value of 34 V. Nevertheless, in Case 2 occurs a voltage drop in the load input inductor (Lg), which is inexistent in dc. The average value of the dc-link voltage in the Case 2 is 20.9 V, with the diodes voltage drops being the main source of voltage decrease with respect to the power grid voltage.
Figure 5 shows the waveforms of the output voltage of the load for Case 1 (vo_ac) and Case 2 (vo_dc). The buck dc-dc converter is responsible for the synthetization of this voltage, in both cases controlling its value to 12 V. Although the ripple is small in both cases, it is even smaller in Case 2, since the constant dc-link voltage facilitates the control of the output voltage. Consequently, the ripple component of the output voltage in Case 2
Figure 3. Input current for the load supplied by ac voltage (ig_ac) and when supplied by
dc voltage (ig_dc).
Figure 4. Dc-link voltage of the load when supplied by ac voltage (vdc_ac) and when supplied by
dc voltage (vdc_dc).
Figure 5. Output voltage of the load when supplied by ac voltage (vo_ac) and when supplied by dc voltage (vo_dc).
ig_ac
ig_dc
vdc_ac
vdc_dc
vo_ac vo_dc
Table 1. Simulation model parameters.
Parameter Value
ac Power Grid Voltage (Vg_ac) 24 V
ac Power Grid Frequency 50 Hz
dc Power Grid Voltage (Vg_dc) 24 V
Output Voltage (Vo) 12 V
Line Impedance (ZL) 1 mΩ, 50 µH
Input Inductor (Lg) 1 mH
dc-link Capacitor (Cdc) 1 mF
Output Inductor (Lo) 2 mH
Output Capacitor (Co) 470 µF
consists of switching ripple only. It should be noted that the same control strategy was applied in both cases.
3.2. Efficiency Comparison
The previous results compared the voltage and current waveforms of the power grid and the load for the same load being supplied with ac and dc voltages. In this section, Case 3 (load without input ac-dc converter supplied by dc voltage) is also analyzed and compared with the other two cases in terms of efficiency.
Table 2 presents a comparison in terms of input power, output power and efficiency for the three designed cases. Since the load output voltage is the same for the three cases (12 V), as well as the output resistor (10 Ω), the output power is 14.4 W for all the cases. In terms of input active power, i.e., the active power absorbed from the power grid, it should be noted that Case 1 presents a lower value than Case 2 (17.9 W against 18.1 W) and, consequently, a higher efficiency (80.4% against 79.6%). This is justified by the fact that the power losses in the diodes of the ac-dc converter are 1.92 W in Case 1 and 2.32 W in Case 2. However, in Case 1 there is an apparent power of 26.7 VA, corresponding to a power factor of 0.67, which does not exist in Cases 2 and 3, since these are related to dc grids. Nonetheless, the highest efficiency is attained by removing the ac-dc converter (Case 3), resulting in a 96% efficiency for the same load supplied by a dc power grid.
4. Experimental Setup and Results
This section shows the developed experimental setup and the obtained results for the three cases, aiming to corroborate the simulation results. The experimental results were obtained in a similar way to the simulation results, i.e., the three cases were individually analyzed in terms of waveforms and efficiency, with the latter being compared among the cases. However, differently from the simulation results, three different load values were used, aiming to evaluate the three cases with different operating conditions.
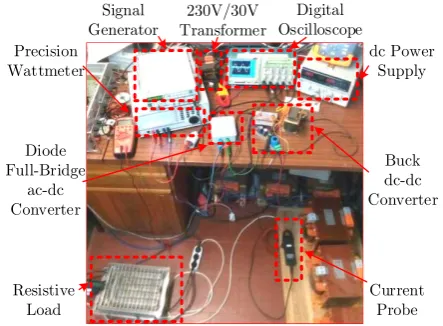
The experimental setup used for this study can be seen in Figure 6. In order to step-down the power grid voltage, a 230 V / 30 V transformer was used, and the grid side inductor (Lg) present in Figure 1 was not used, since the
leakage inductance of the transformer is high enough to smooth the high di/dt of the load current, which is characteristic from the considered type of nonlinear load. Regarding the components that comprise the nonlinear load, the figure shows a diode full-bridge ac-dc converter (Comchip model GBPC5010), a buck dc-dc converter, which is comprised by IGBTs FGA25N120ANTD from the company ON Semiconductor and the respective internal antiparallel diodes, an inductor and a set of capacitors, and, finally, a resistive load. A dc power supply ISO-TECH model IPS2303 was used to emulate the dc power grid. In terms of measurement equipment, a precision wattmeter from the company Zimmer, model LMG95, was used to measure the power values both at the input and at the output of the load. A digital signal generator from the company GWInstek, model SFG-1013, was used to generate the gate signals of the buck dc-dc converter, which in turn was connected to an Avago HCPL3120 driver board in order to drive the IGBT gate. The waveform results were obtained through a Tektronix TPS 2024 digital oscilloscope, and the currents were measured by current probes Fluke i400 s and Prosys CP 35. Table 2. Power and efficiency comparison for the three
cases obtained in simulation.
Case
1 (ac voltage
with ac-dc converter)
2 (dc voltage with ac-dc converter)
3 (dc voltage without ac-dc
converter) Input Active Power 17.9 W 18.1 W 15.0 W
Output Active Power 14.4 W 14.4 W 14.4 W
Efficiency 80.4% 79.6% 96.0%
Figure 6. Laboratory workbench used for obtaining the experimental results.
Table 3. Experimental setup parameters.
Parameter Value
ac Power Grid Voltage (Vg_ac) 30 V
ac Power Grid Frequency 50 Hz
dc Power Grid Voltage (Vg_dc) 30 V
Output Voltage (Vo) 20 V
dc-link Capacitor (Cdc) 3.28 mF
Output Inductor (Lo) 5 mH
Output Capacitor (Co) 10 mF
Output Resistor (Ro) 26 Ω or 13 Ω or 8.7 Ω
Switching Frequency 20 kHz
Diode Full-Bridge
ac-dc Converter
Resistive Load
Current Probe Precision
Wattmeter Signal Generator
Buck dc-dc Converter 230V/30V
Transformer
dc Power Supply Digital
(a) (b) (c)
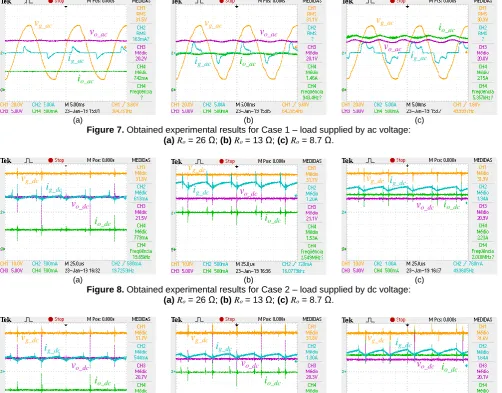
Figure 7. Obtained experimental results for Case 1 – load supplied by ac voltage: (a)Ro = 26 Ω; (b) Ro = 13 Ω; (c) Ro = 8.7 Ω.
(a) (b) (c)
Figure 8. Obtained experimental results for Case 2 – load supplied by dc voltage: (a)Ro = 26 Ω; (b) Ro = 13 Ω; (c) Ro = 8.7 Ω.
(a) (b) (c)
Figure 9. Obtained experimental results for Case 3 – load without the input ac-dc converter supplied by dc voltage: (a)Ro = 26 Ω; (b) Ro = 13 Ω; (c) Ro = 8.7 Ω.
vg_ac
vo_ac
ig_ac
io_ac
vg_ac
vo_ac
ig_ac io_ac
vg_ac
vo_ac ig_ac
io_ac
vg_dc
vo_dc ig_dc
io_dc
vg_dc
vo_dc ig_dc
io_dc
vg_dc
vo_dc ig_dc
io_dc
vg_dc
vo_dc ig_dc
io_dc
vg_dc
vo_dc ig_dc
io_dc
vg_dc
vo_dc ig_dc
io_dc
4.1. Waveform Comparison
This section shows the obtained results in terms of waveforms for the three cases, using three load values for each case. Each of these results shows the power grid voltage (vg), the input current (ig), the output voltage (vo) and the output current (io). Each of these variables is represented with the subscript _ac for Case 1 and _dc for Cases 2 and 3. The output resistive load (Ro) is 26 Ω for the figures listed with (a), 13 Ω for (b) and8.7 Ω for (c), resulting in output powers of approximately 15 W, 30 W and 45 W, respectively, with a 20 V dc load voltage (Vo).
Figure 7 shows the obtained results for Case 1 (load supplied by an ac voltage). As referred, a 230 V / 30 V transformer was employed to step-down the power grid voltage in order to emulate a low power rating nonlinear
load. It can be seen that the current ig_ac is distorted, as expected, and its di/dt is similar to the one obtained in the simulation results, evidencing that the leakage inductance of the transformer is high enough to limit the di/dt of the load current. The output voltage (vo_ac) and current (io_ac) present a slight 100 Hz ripple component due to the open loop control of the buck dc-dc converter, whereby the 5 mH inductor (Lo) and the 10 mF capacitor (Co) are the only responsible parts for the ripple reduction.
Figure 9 shows the obtained results for Case 3 (load without input ac-dc converter supplied by dc voltage). The waveforms are very similar to those of Figure 8, but the registered mean values differ essentially in the input current (ig_dc). For the same output power, it can be seen that this current is higher for Case 2 than Case 3, which reflects in a lower input power for the same output power and, hence, a higher efficiency for Case 3, as it can be analyzed in the next section.
4.2. Efficiency Comparison
This section presents the obtained results in terms of efficiency for the operating conditions of the previous sections. For such purpose, a precision wattmeter was used, as aforementioned, measuring values of voltage, current, active power and apparent power, among others. For each case, and for each load, these values were measured both at the input (grid side) and at the output (load side), allowing to determine the efficiency for each situation.
The values registered by the wattmeter for both input and output are shown in Figure 10, Figure 11 and Figure 12 for Cases 1, 2 and 3, respectively. Based on these figures,
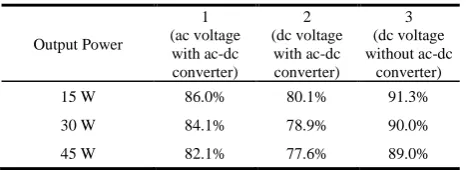
Table 4 shows the calculated efficiency for each case and load, similarly to Table 2 for the simulation results. Comparatively to these results, the experimental efficiency values are slightly lower. Nevertheless, as referred for the simulation results, the focus is to compare the efficiency values along the different cases, and, similarly to the simulation, the highest efficiency is obtained in Case 3. Also in accordance with the
simulation are the higher values obtained for Case 1 with respect to Case 2. However, it can be seen that the decrease in efficiency with the increasing output power is more significant for Case 1 than for Case 2 (3.9% efficiency decrease against 2.5%), suggesting that, for higher power values, Case 2 would be more efficient than Case 1. Nonetheless, Case 1 presents a power factor of 0.65 for the Ro = 26 Ω and 0.79 for the Ro = 8.7 Ω, while the lowest value of power factor registered for Cases 2 and 3 is 0.995, which is a consequence of the input current ripple of the buck dc-dc converter. Nonetheless, the efficiency values obtained with the experimental setup show a proper match with the efficiency values obtained in the simulation, validating the higher efficiency of Case 3 and, therefore, the convenience of adapt this type of electric load to be supplied only by dc voltages.
5. Conclusions
This paper presented an analysis of a typical nonlinear load used in domestic appliances and its behavior when connected to an ac power grid and to a dc power grid, both with the same rms voltage value. The considered load was a diode full-bridge ac-dc converter followed by a buck dc-dc converter, representing a typical power supply that can be found in computers and battery chargers, among other electronic domestic appliances. Three distinct cases were considered, namely: (1) Load supplied by ac voltage; (2) Load supplied by dc voltage; (3) Load without the input ac-dc converter supplied by dc voltage. Simulation models were developed considering realistic database models of the power semiconductors used in this
(a) (b) (c) (d) (e) (f)
Figure 10. Powers, voltages and currents obtained for Case 1 – load supplied by ac voltage: (a) Input and (b) Output values for Ro = 26 Ω; (c) Input and (d) Output values for Ro = 13 Ω; (e) Input and (f) Output values for Ro = 8.7 Ω.
(a) (b) (c) (d) (e) (f)
Figure 11. Powers, voltages and currents obtained for Case 2 – load supplied by dc voltage: (a) Input and (b) Output values for Ro = 26 Ω; (c) Input and (d) Output values for Ro = 13 Ω; (e) Input and (f) Output values for Ro = 8.7 Ω.
(a) (b) (c) (d) (e) (f)
Figure 12. Powers, voltages and currents obtained for Case 3 – load without input ac-dc converter supplied by dc voltage: (a) Input and (b) Output values for Ro = 26 Ω; (c) Input and (d) Output values for Ro = 13 Ω;
type of load, and the attained simulation results aimed to perform a comparison in terms of voltage and current waveforms, and efficiency. This comparison based in simulations was feasible due to the use of the database models of the power semiconductors. An experimental setup was assembled in order to perform the comparison with real operating conditions, and the obtained results matched the simulation results. It was seen that efficiency can be significantly improved (from 80% to around 90%) in a dc power grid by simply removing the input ac-dc converter of the analyzed type of nonlinear load (Case 3). This fact corroborates the feasibility of dc smart homes and dc grids, making them more suitable, not only from the low and medium power renewable energy generation and from energy storage systems point of view, but also from the perspective of the vast majority of domestic appliances.
Acknowledgements.
This work has been supported by COMPETE: POCI-01-0145– FEDER–007043 and FCT – Fundação para a Ciência e Tecnologia within the Project Scope: UID/CEC/00319/2013. This work is financed by the ERDF – European Regional Development Fund through the Operational Programme for Competitiveness and Internationalisation – COMPETE 2020 Programme, and by National Funds through the Portuguese funding agency, FCT – Fundação para a Ciência e a Tecnologia, within project SAICTPAC/0004/2015 – POCI – 01–0145– FEDER–016434. Mr. Tiago Sousa is supported by the doctoral scholarship SFRH/BD/134353/2017 granted by the Portuguese FCT agency.
References
[1] R. Foerst, G. Heyner, K. Kanngiesser, and H. Waldmann, “Multiterminal Operation of HVDC Converter Stations,” IEEE Transactions on Power Apparatus and Systems, vol. PAS-88, no. 7, pp. 1042–1052, Jul. 1969.
[2] C. Dewey, F. Ellert, T. Lee, and C. TITUS, “Development of Experimental 20-kY, 36-MW Solid-State Converters for HVDC Systems,” IEEE Transactions on Power Apparatus and Systems, vol. PAS-87, no. 4, pp. 1058–1066, Apr. 1968.
[3] F. Hirsch and E. Schafer, “Progress Report on the HVDC Test Line of the 400 kV-Forschungsgemeinschaft: Corona Losses and Radio Interference,” IEEE Transactions on Power Apparatus and Systems, vol. PAS-88, no. 7, pp. 1061–1069, Jul. 1969.
[4] N. Hingorani, “Transient Overvoltage on a Bipolar HVDC Overhead Line Caused by DC Line Faults,” IEEE Transactions on Power Apparatus and Systems, vol. PAS-89, no. 4, pp. 592–610, Apr. 1970.
[5] J. Reeve, J. Baron, and P. Krishnayya, “A General Approach to Harmonic Current Generation by HVDC Converters,” IEEE Transactions on Power Apparatus and Systems, vol. PAS-88, no. 7, pp. 989–995, Jul. 1969. [6] J. S. Hess and L. R. Rice, “Three Megawatt HVDC
Transmission Simulator,” IEEE Transactions on Industry and General Applications, vol. IGA-3, no. 6, pp. 531–537, Nov. 1967.
[7] A. Ekstrom and G. Liss, “A Refined HVDC Control System,” IEEE Transactions on Power Apparatus and Systems, vol. PAS-89, no. 5, pp. 723–732, May 1970. [8] T. Horigome, K. Kurokawa, K. Kishi, and K. Ozu, “A
100-kV thyristor converter for high-voltage dc transmission,” IEEE Transactions on Electron Devices, vol. 17, no. 9, pp. 809–815, Sep. 1970.
[9] C. Heising and R. Ringlee, “Prediction of Reliability and Availability of HVDC Valve and HVDC Terminal,” IEEE Transactions on Power Apparatus and Systems, vol. PAS-89, no. 4, pp. 619–624, Apr. 1970.
[10] N. G. Hingorani, “High-voltage DC transmission: a power electronics workhorse,” IEEE Spectrum, vol. 33, no. 4, pp. 63–72, Apr. 1996.
[11] T. J. Hammons et al., “Role of HVDC transmission in future energy development,” IEEE Power Engineering Review, vol. 20, no. 2, pp. 10–25, Feb. 2000.
[12] N. A. Belda, C. A. Plet, and R. P. P. Smeets, “Analysis of Faults in Multiterminal HVDC Grid for Definition of Test Requirements of HVDC Circuit Breakers,” IEEE Transactions on Power Delivery, vol. 33, no. 1, pp. 403– 411, Feb. 2018.
[13] N. Flourentzou, V. G. Agelidis, and G. D. Demetriades, “VSC-Based HVDC Power Transmission Systems: An Overview,” IEEE Transactions on Power Electronics, vol. 24, no. 3, pp. 592–602, Mar. 2009.
[14] C. M. Franck, “HVDC Circuit Breakers: A Review Identifying Future Research Needs,” IEEE Transactions on Power Delivery, vol. 26, no. 2, pp. 998–1007, Apr. 2011. [15] C. Guo, Y. Zhang, A. M. Gole, and C. Zhao, “Analysis of
Dual-Infeed HVDC With LCC–HVDC and VSC–HVDC,” IEEE Transactions on Power Delivery, vol. 27, no. 3, pp. 1529–1537, Jul. 2012.
[16] G. Liu, F. Xu, Z. Xu, Z. Zhang, and G. Tang, “Assembly HVDC Breaker for HVDC Grids With Modular Multilevel Converters,” IEEE Transactions on Power Electronics, vol. 32, no. 2, pp. 931–941, Feb. 2017.
[17] Y. Liu and Z. Chen, “A Flexible Power Control Method of VSC-HVDC Link for the Enhancement of Effective Short-Circuit Ratio in a Hybrid Multi-Infeed HVDC System,” IEEE Transactions on Power Systems, vol. 28, no. 2, pp. 1568–1581, May 2013.
[18] S.-M. Baek, H.-J. Kim, J.-W. Cho, and H.-S. Ryoo, “Cryogenic Electrical Insulation Characteristics of Solid Insulator for the HVDC HTS Cable,” IEEE Transactions on Applied Superconductivity, vol. 28, no. 4, pp. 1–4, Jun. 2018.
[19] Taesik Nam, Jae Woong Shim, and Kyeon Hur, “Design and Operation of Double SMES Coils for Variable Power System Through VSC-HVDC Connections,” IEEE Transactions on Applied Superconductivity, vol. 23, no. 3, pp. 5701004–5701004, Jun. 2013.
[20] J. G. Kim et al., “Loss characteristic analysis of HTS DC power cable using LCC based DC transmission system,”
Table 4. Power and efficiency comparison for the three cases obtained with the experimental setup.
Output Power
1 (ac voltage with ac-dc converter)
2 (dc voltage
with ac-dc converter)
3 (dc voltage without ac-dc
converter)
15 W 86.0% 80.1% 91.3%
30 W 84.1% 78.9% 90.0%
IEEE Transactions on Applied Superconductivity, vol. 22, no. 3, pp. 3–6, 2012.
[21] B. Malek and B. K. Johnson, “Branch Current Control on a Superconducting DC Grid,” IEEE Transactions on Applied Superconductivity, vol. 23, no. 3, pp. 5401005–5401005, Jun. 2013.
[22] Q. Yang, S. Le Blond, F. Liang, W. Yuan, M. Zhang, and J. Li, “Design and Application of Superconducting Fault Current Limiter in a Multiterminal HVDC System,” IEEE Transactions on Applied Superconductivity, vol. 27, no. 4, pp. 1–5, Jun. 2017.
[23] Bin Xiang, Zhiyuan Liu, Yingsan Geng, and S. Yanabu, “DC Circuit Breaker Using Superconductor for Current
Limiting,” IEEE Transactions on Applied
Superconductivity, vol. 25, no. 2, pp. 1–7, Apr. 2015. [24] A. Marian, S. Holé, F. Lesur, M. Tropeano, and C. E.
Bruzek, “Validation of the superconducting and insulating components of a high-power HVDC cable,” IEEE Electrical Insulation Magazine, vol. 34, no. 1, pp. 26–36, Jan. 2018.
[25] IEEE Standards Association, “IEEE Recommended Practice and Requirements for Harmonic Control in Electric Power Systems,” in IEEE Std 519-2014 (Revision of IEEE Std 519-1992), vol. 2014, pp. 1–29, 2014. [26] J. H. R. Enslin and P. J. M. Heskes, “Harmonic Interaction
Between a Large Number of Distributed Power Inverters and the Distribution Network,” IEEE Transactions on Power Electronics, vol. 19, no. 6, pp. 1586–1593, Nov. 2004.
[27] W. K. A. Gonçalves, J. C. De Oliveira, and V. L. S. Franco, “Harmonics Produced by Advanced Static Var Compensator under Electric Power Supply Conditions with Loss of Quality,” International Conference on Electric Utility Deregulation and Restructuring and Power Technologies Proceedings, pp. 660–665, 2000.
[28] A. M. Blanco, R. Stiegler, and J. Meyer, “Power quality disturbances caused by modern lighting equipment (CFL and LED),” in 2013 IEEE Grenoble Conference, 2013, pp. 1–6.
[29] R. C. Dugan, M. F. McGranaghan, S. Santoso, and H. W. Beaty, Electrical Power Systems Quality, 3rd Editio. 2004. [30] W. M. Grady, M. J. Samotyj, and A. H. Noyola, “Survey
of active power line conditioning methodologies,” IEEE Transactions on Power Delivery, vol. 5, no. 3, pp. 1536– 1542, Jul. 1990.
[31] G. A. Taylor, “Power quality hardware solutions for distribution systems: Custom Power,” in IEE North Eastern Centre Power Section Symposium on the Reliability, Security and Power Quality of Distribution Systems, 1995, vol. 1995, pp. 1–9.
[32] B. Singh, K. Al-Haddad, and A. Chandra, “A review of active filters for power quality improvement,” IEEE Transactions on Industrial Electronics, vol. 46, no. 5, pp. 960–971, 1999.
[33] M. M. Morcos and J. C. Gomez, “Electric power quality -the strong connection with power electronics,” IEEE Power and Energy Magazine, vol. 1, no. 5, pp. 18–25, 2003.
[34] V. Khadkikar, “Enhancing Electric Power Quality Using UPQC: A Comprehensive Overview,” IEEE Transactions on Power Electronics, vol. 27, no. 5, pp. 2284–2297, May 2012.
[35] T. Dragicevic, J. C. Vasquez, J. M. Guerrero, and D. Skrlec, “Advanced LVDC Electrical Power Architectures and Microgrids: A step toward a new generation of power
distribution networks.,” IEEE Electrification Magazine, vol. 2, no. 1, pp. 54–65, Mar. 2014.
[36] A. Kwasinski, “Quantitative Evaluation of DC Microgrids Availability: Effects of System Architecture and Converter Topology Design Choices,” IEEE Transactions on Power Electronics, vol. 26, no. 3, pp. 835–851, Mar. 2011. [37] S. Lu, L. Wang, T.-M. Lo, and A. V. Prokhorov,
“Integration of Wind Power and Wave Power Generation Systems Using a DC Microgrid,” IEEE Transactions on Industry Applications, vol. 51, no. 4, pp. 2753–2761, Jul. 2015.
[38] B. T. Patterson, “DC, Come Home: DC Microgrids and the Birth of the ‘Enernet,’” IEEE Power and Energy Magazine, vol. 10, no. 6, pp. 60–69, 2012.
[39] E. Rodriguez-Diaz, J. C. Vasquez, and J. M. Guerrero, “Intelligent DC Homes in Future Sustainable Energy Systems: When efficiency and intelligence work together,” IEEE Consumer Electronics Magazine, vol. 5, no. 1, pp. 74–80, Jan. 2016.
[40] A. Ghazanfari and Y. A.-R. I. Mohamed, “Decentralized Cooperative Control for Smart DC Home with DC Fault Handling Capability,” IEEE Transactions on Smart Grid, vol. 9, no. 5, pp. 1–1, 2017.