Bakht Azam (Corresponding Author) Assistant Professor
Department of Computer Science, University of Malakand - Pakistan
Cell: +92-346-9004003
E-mail: [email protected]
Date Received: March 24, 2017 Date Revised: September 23, 2017 Date Accepted: November 20, 2017
AUTOMATED DIFFERENTIAL BLOOD COUNT
USING IMAGE QUANTIZATION
Bakht Azam, Sami Ur Rahman, Fakhre Alam
Department of Computer Science, University of Malakand - Pakistan
ABSTRACT
Objective: The objective of this research is to automate the calculation of differential blood count in blood smear pho-tomicrographs using image quantization.
Material and Methods: A series of image processing steps were used for the detection of White Blood Cells (WBCs), Red Blood Cells (RBCs) and platelets as: image acquisition, separating the channels of RGB and applying wiener filter on each channel for smoothing the image. The purpose is to enhance the visual interpretation of the image, recombining the channels and applying the quantization over the wiener output.
Results: The accuracy of this technique is very close to that of the hematologists’ manual calculation. It was 85% for Red blood cells and 98% for White blood cells.
Conclusion: This proposed technique gives precise results under varied luminance conditions such as darkness, brightness and low contrast images, it gives reliable results for all the images in the image sets having different quality of images.
Key Words: Blood Smear, White Blood Cells, Red Blood Cells, Platelets, hematology, Quantization, digital image processing.
This article may be cited as: Azam B, Rahman Su, Alam F. Automated differential blood count using image quantization J Med Sci 2017; 25: (4) 457-462.
INTRODUCTION
Many diseases can be diagnosed and evaluated by counting and classifying the blood cells in the micro-scopic blood smear images. The prominent disorders which are frequently diagnosed in the blood samples of most patients are leukocytosisand leucopenia. After cat-egorizing a blood smear as White Blood Cells (WBCs) with lower or higher counts, they are further classified into various diseases according to hematology’s own protocols1. Similarly, the diseases related to the
eryth-rocytes can also be found in the human blood samples studying some changes like increase or decrease in the size or count of RBC’s. Malarial parasites in the blood affect the compactness of cells which varies from that
of normal cells, or if there is low RBC count then the disease is labeled asanemia.
This research work has an inspiration from the previous work done by Bakht A.2 In our previous work,
the WBCs were detected and counted automatically by quantizing the digital blood smear photomicrographs. The protocols used by the hematologists were used as part of algorithm of our work. WBCs were collected as filtered residue and the rest of the contents were vanished. The labeled WBC’s were then counted up and were matched with the results produced by the hematologists manually.
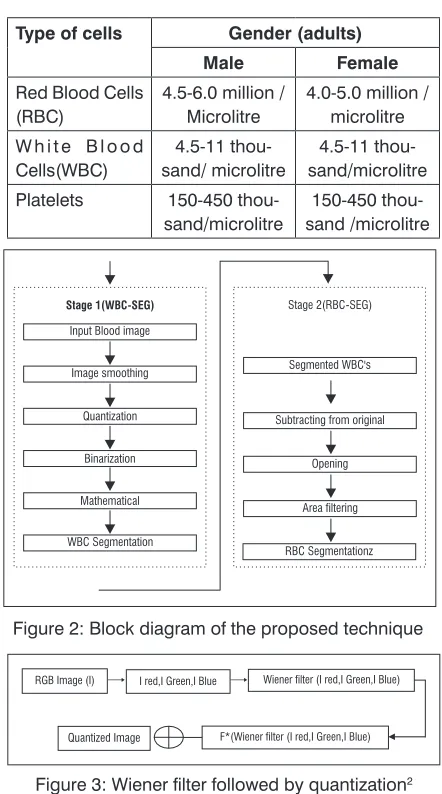
As revealed previously, hematologists used to count the main components in the blood smear slides. A normal man and woman has its normal range, shown in Table 1, and mentioned in the protocols build by the World Health Organization WHO.3 If a count exceeds or
IB. A factor F was set to a value of 255 after an iterative process, observing good results of visibility of WBC’s and disappearance of the other contents, as shown in Figure 5.
Binarization
We used Otsu thresholding method6 (use
con-sistent voice either passive or active) for binarizing the quantized image, which dynamically calculates a threshold value from the input image and classify the pixels as follow:
(3)
(4)
(5)
(6)
(7) Where equation (3) shows the weighted sum within-class variance, equation (4) and (5) shows how the class probabilities are projected, the class means are calculated as in equation (6) and (7) and finally the individual class variances are calculated as in equation (8) and (9):
(8)
(9)
O2
1 (t) = The variance of the pixels in the background
(below threshold) O2
2 (t) = The variance of the pixels in the foreground
(above threshold), Weights ωiare the probabilities of the two classes separated by a threshold t and σ2
i is
the variances of these classes. MorphologicalOperations
In order to make the extracted objects in the image closest to the shapes of the natural objects, these operations are carried out, the morphological operations we have done are erosion, dilation, opening and then reconstruction.
Opening is the dilation of the eroded set A by a structuring element B:
A o B=(A ∅ B) ⊕ B (10) Where o standsforopening, ∅representserosionand ⊕ denotesdilation.
This operation was carried out, in order to make the edges of the extracted components smoother and clear the noisy artifacts7.
These distinguishing features of the above cells are used for the segmentation purpose of the blood smear images and keeping in view the following counts given in Table 1, decisions are taken whether the count is normal or not.
MATERIAL & METHODS
This research work is categorized into two stag-es. In the first stage, the input image is preprocessed and the WBCs are segmented. This segmented image become an input for the second stage. In the second stage, the WBC segmented image is processed and gives output as RBC’s,
Stage 1 (WBC Segmentation) Image acquisition:
A special microscope with a high resolution camera mounted over it, used for acquiring the blood smear photomicrographs. Snapshots were taken of different fields, an oil immersion 100 x objective was used, and the resolution of images was kept 750 x550 pixels. Figure 2 shows the step by step approach of this algorithm and is explained as follows:
Preprocessing
In the next step the acquired images were pre-processed4. The images having uneven factors like
increased luminosity, darkness and brightness were normalized and a wiener filter of window size 7 x 7 using the following equations was applied over the images in the manner shown in Figure 3.
(1)
(2)
Equation (1) and (2) calculates the mean and variance around each pixel respectively.
Where h is the N-by-M local neighborhood of the candidate pixel of an input image in the following man-ner. This filter generates a range of frequencies from an image and automatically cuts off the filter at frequencies where noise becomes significantly higher than signal. Quantization
Quantization actually means to reduce the num-ber of levels5. Here we are reducing the number of
WBC’sSegmentation:
WBC’s segmentation is the final step of stage 1 of this methodology, which were easily distinguished from other objects (RBC’s and Platelets) leveraging its color feature in the quantization step of this technique explained in Figure 2.
In Figure 5, (a) is a cropped part of an original image, containing a WBC and some RBCs, (b) is the wienered image, (c) is the quantized image showing a WBC and the eliminated RBC’s, (d) is binarized form of (c) and (e) is the labeled WBC.
Stage 2 (RBCSegmentation) WBCMasking
The WBC’s extracted in the final step of stage 1 are used as masks for the input image (binarized form of original image) in stage 2, which was overlayed upon the binarized image of the original image and pointing the said WBC’s.
Image Subtraction
After using mask of WBCs, it is easy to subtract it from the binarized image of original one, the subtraction process results in the disappearance of WBCs and remaining out the RBCs as shown in Figure 6.
Mathematical Morphology:
The shape of RBC is biconcave, flattened and disc like structure, having no nuclei in it. Its average size is 6-8 µm in diameter. These features are kept in mind in order to eliminate unwanted artifacts or roughness in the edges of contents left behind after masking and im-age subtraction process. Mathematical morphological operators like closing and opening are used.
Area Filtering:
RBCs are of average size in all the contents present in human blood, this size of RBCs helped in recognizing them and the extra artifacts were filtered out in this step.
Area Filter = AF(σ2 -w(t),p) (11) RBC’s Segmentation:
Finally, the residual components were RBCs, after all operations being performed on blood smear images and which were successfully segmented from the rest of image. The result is show in Figure 6.
RESULTS
The proposed technique was tested on 4 image sets, each containing 15 images, prepared by authors in the department of pathology of a local postgraduate research hospital. The image sets were manually
ex-Figure 2: Block diagram of the proposed technique
Figure 3: Wiener filter followed by quantization2
amined by well qualified pathologists and each image was commented bythem.
Each image set was evaluated through our proposed algorithm. The results were cross matched with some other novel techniques and showed better accuracy and reliability in many aspects as compared to them.
Figure 1: A sample blood smear showing RBC, WBC, Platelets
Table 1: Normal Blood Count of a human adult1 Type of cells Gender (adults)
Male Female
Red Blood Cells
(RBC) 4.5-6.0 million / Microlitre 4.0-5.0 million /microlitre W h i t e B l o o d
Cells(WBC) sand/ microlitre4.5-11 thou- sand/microlitre4.5-11 thou-Platelets 150-450
thou-The accuracy rate of this technique was deter-mined by comparing the count done by us with the pre calculated counts of cells done manually by expert hematologists using the following formula:
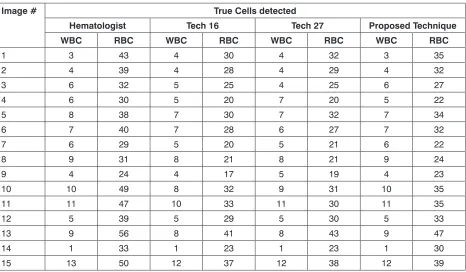
This table shows the true and false cells detected by each technique. Technique 1 and technique 2 has detected one cell for image 1 in image set 4, technique 2 has detected one cell in image 4 and one cell in image
9, which has greatly suffered the efficiency of these technique while there is no false cell detected by our proposed technique.
DISCUSSION
A number of techniques for processing the blood smear images and counting mechanisms have been developed. Diaz G and Hiremath PS presented a meth-od for the extraction of RBC’s in the peripheral blometh-od smear images infected with Plasmodium Falciparum.11,12
They utilized Gradient Vector Flow (GVF) in order to extract out the white blood cells and then used zack thresholding to separate cytoplasm from the nucleus.13
Another advanced work is also done to classify WBCs automatically by computing the WBC images in term of area, major axis length over minor axis length, perimeter, circularity and ratio of areas between nucleus and cyto-plasm.14 Joshi MD used contrast stretching and median
filter for image enhancement and Otsu thresholding for binarization.15 Various morphological operation like
opening and closing were used for removing the extra artifacts other than WBCs.15
Putzu L used histogram equalization followed by contrast stretching for image enhancement and water-shed for separating overlapped cells for the identifica-tion of WBCs in blood smear images.16 Mahmood NH for
the purpose of segmentation of blood cells used color based segmentation technique followed by the canny edge detection technique and segmented the image
Figure 8: A graph showing the accuracy rate for RBC’s of each technique (technique 18, technique
210and the proposed technique) Figure 4: Sample pixel values after quantization (a) WBC, (b) RBC, (c) Background
Figure 5: WBC’s segmentation in stage 1
Figure 6: a) Originalimage b) SegmentedWBCs c) SegmentedRBCs
Figure 7: A graph showing the accuracy rate for WBC’s of each technique (technique 18 technique
using circular Hough Transform with ROI polygon area measurement.10 Jambhekar ND calculated the image
gradient through the derivative of filter of Gaussian and detected the edges through the local maxima of that gra-dient image in order to segment RBCs from the rest of image.17 Nasrul A used a 5x5 median filter on the green
component of original image with contrast stretching technique for enhancing the contrast between RBC and WBCs for the easy separation of RBCs and used saturated component of HSV to extract WBCs.10 Tulsani
H used a 3 x 3 average filter for smoothing in YCbCr color space and morphological operations followed by watershed algorithm for the segmentation of RBCs, WBCs and platelets18. Hazwani M extracted the
saturat-ed component from the HSV color space and applisaturat-ed a 3 x 3 median filter on it18. Then the histogram of the
S component was plotted in order to determine the threshold values, they selected 110 as the threshold val-ue on the S component of acute lymphocytic leukemia (ALL) and acute myeloid leukemia (AML) images and separated the infected WBCs from the rest of image, this technique is also helpful in counting purpose. Sharif JM converted the original image into YCbCr color space and choose the second component of YCbCr, as almost all information relating classification of WBC’s are pres-ent in it, and is used specially for the normalization of illumination that affect the quality of the image.19 They
binarized each component separately and divided the Cb component by Y and extracted WBCs in thisway.
The above techniques discussed have contrib-uted a significant role in the field of segmentation, but the only shortcoming in almost each of them is that of non-consistent behavior with respect to change in im-age conditions, which is up to much extent eliminated in our proposed technique.
The only problem we faced during the experi-mental phase of our research was that the accuracy of our technique was highly suffered by overlapped cells. Leveraging our previous work combining the current methodology, we aim to build an automated system that will classify and quantify the complete blood contents of a peripheral blood smear images and will detect many severe diseases like Acute Myeloid Leukemia, Chronic Lymphocytic Leukemia etc. However, large prospective, multicentre trials are required for generalization of these findings.
CONCLUSION
Proposed algorithm is quite simple, efficient and accurate. The authors have tested many images under different luminance conditions like darkened, brightened and low contrast images, it gives consistent results for about entire image sets that were created.
REFERENCES
1. Adewoyin AS. Peripheral blood film-a review. Annals of Ibadan Postgrad Med 2014;12:71-9.
2. Azam B, Qureshi RJ, Jan Z, Khattak TA. Color based
Table 2: WBC/RBC detected in one of the image sets.
Image # True Cells detected
Hematologist Tech 16 Tech 27 Proposed Technique
WBC RBC WBC RBC WBC RBC WBC RBC
1 3 43 4 30 4 32 3 35
2 4 39 4 28 4 29 4 32
3 6 32 5 25 4 25 6 27
4 6 30 5 20 7 20 5 22
5 8 38 7 30 7 32 7 34
6 7 40 7 28 6 27 7 32
7 6 29 5 20 5 21 6 22
8 9 31 8 21 8 21 9 24
9 4 24 4 17 5 19 4 23
10 10 49 8 32 9 31 10 35
11 11 47 10 33 11 30 11 35
12 5 39 5 29 5 30 5 33
13 9 56 8 41 8 43 9 47
14 1 33 1 23 1 23 1 30
segmentation of white blood cells in blood photomi-crographs using image quantization. Res J Recent Sciences 2014; 2277:2502-9
3. Wintrobe MM. Wintrobe's clinical hematology. Lip-pincott Williams & Wilkins; 2009.
4. Lim JS. Two-dimensional signal and image process-ing. Englewood Cliffs, NJ, Prentice Hall, 1990: 710 5. Gersho A, Gray RM. Vector quantization and signal compression. Springer Science & Business Media; 2012
6. Sezgin M. Survey over image thresholding
tech-niques and quantitative performance evaluation. J Electro imag 2004;13:146-68.
7. Kimori Y. Morphological image processing for quan-titative shape analysis of biomedical structures: effective contrast enhancement. J Synchrotron Radiation 2013;20:848-53.
8. Halim NH, Mashor MY, Hassan R. Automatic blasts
counting for acute leukemia based on blood sam-ples. Inter J Res and Reviews in Computer Science 2011; 2: 23-8.
9. Sharif JM, Miswan MF, Ngadi MA, Salam MS, bin
Abdul Jamil MM. Red blood cell segmentation using masking and watershed algorithm: A preliminary study. InBiomedical Engineering (ICoBE), 2012 International Conference 2012: 258-262.
10. Mahmood NH, Lim PC, Mazalan SM, Razak MA. Blood cells extraction using color based segmen-tation technique. Int J Life Sci Biot Pharm Res 2013;2:2250-3137.
11. Díaz G, González FA, Romero E. A semi-automatic method for quantification and classification of eryth-rocytes infected with malaria parasites in microscop-ic images. J Biomed Informatmicroscop-ics 2009; 42:296-307.
12. Hiremath PS, Bannigidad P, Geeta S. Automated identification and classification of white blood cells (leukocytes) in digital microscopic images. IJCA special issue on “recent trends in image processing and pattern recognition” RTIPPR 2010:59-63. 13. Zack GW, Rogers WE, Latt SA. Automatic
measure-ment of sister chromatid exchange frequency. J Histochemistry & Cytochemistry 1977 ;25: 741-53. 14. Savkare SS, Narote SP. Automatic classification
of normal and infected blood cells for parasitemia detection. Int J Comput Sci Net Sec 2011;1: 94-7. 15. Joshi MD, Karode AH, Suralkar SR. White blood
cells segmentation and classification to detect acute leukemia. Int J Emerging Trends and Technology in Computer Science (IJETICS) 2013;2: 9-22. 16. Putzu L, Di Ruberto C. White blood cells
identifica-tion and counting from microscopic blood image. In: Proceedings of World Academy of Science, Engineering and Technology 2013. World Academy of Science, Engineering and Technology (WASET) 2013;73: 363-9.
17. Jambhekar ND. Red blood cells classification using image processing. Science Research Reporter 2011;1:151-4.
18. Tulsani H, Saxena S, Yadav N. Segmentation using morphological watershed transformation for count-ing blood cells. IJCAIT 2013;2: 28-36.
19. Sharif JM, Miswan MF, Ngadi MA, Salam MS, bin Abdul Jamil MM. Red blood cell segmentation using masking and watershed algorithm: A preliminary study. In Biomedical Engineering (ICoBE), 2012 International Conference 2012: 258-262.
CONFLICT OF INTEREST: Authors declare no conflict of interest GRANT SUPPORT AND FINANCIAL DISCLOSURE NIL
AUTHOR’S CONTRIBUTION
Following authors have made substantial contributions to the manuscript as under: Azam B: Study design, data collection, data analysis.
Rahman S: Literature review.
Alam F: References, Bibliography, statistics, data analysis.