on Creative Technologies
Research Article
Mathematical Foundation Based Inter-Connectivity
modelling of Thermal Image processing technique for
Fire Protection
Sayantan Nath
1,*, Dr. Sonali Agarwal
2and Prof. G.N. Pandey
31
Research Scholar, IIIT-Allahabad, Uttar Pradesh, India
2Assistant Professor, IIIT-Allahabad, Uttar Pradesh, India 3Adjunct Professor, IIIT-Allahabad, Uttar Pradesh, India
Abstract
In this paper, integration between multiple functions of image processing and its statistical parameters for intelligent alarming series based fire detection system is presented. The proper inter-connectivity mapping between processing elements of imagery based on classification factor for temperature monitoring and multilevel intelligent alarm sequence is introduced by abstractive canonical approach. The flow of image processing components between core implementation of intelligent alarming system with temperature wise area segmentation as well as boundary detection technique is not yet fully explored in the present era of thermal imaging. In the light of analytical perspective of convolutive functionalism in thermal imaging, the abstract algebra based inter-mapping model between event-calculus supported DAGSVM classification for step-by-step generation of alarm series with gradual monitoring technique and segmentation of regions with its affected boundaries in thermographic image of coal with respect to temperature distinctions is discussed. The connectedness of the multifunctional operations of image processing based compatible fire protection system with proper monitoring sequence is presently investigated here.
The mathematical models representing the relation between the temperature affected areas and its boundary in the obtained thermal image defined in partial derivative fashion is the core contribution of this study. The thermal image of coal sample is obtained in real-life scenario by self-assembled thermographic camera in this study. The amalgamation between area segmentation, boundary detection and alarm series are described in abstract algebra. The principal objective of this paper is to understand the dependency pattern and the principles of working of image processing components and structure an inter-connected modelling technique also for those components with the help of mathematical foundation.
Keywords: inter-connectivity, event-calculus, thermal imaging, abstract algebra, mathematical foundation, DAGSVM.
Received on 04 September 2014, accepted on 26 March 2015, published on 20 October 2015
Copyright © 2015 S. Nath et al., licensed to EAI. This is an open access article distributed under the terms of the Creative Commons Attribution licence (http://creativecommons.org/licenses/by/3.0/), which permits unlimited use, distribution and reproduction in any medium so long as the original work is properly cited.
doi: 10.4108/eai.20-10-2015.150097
1. Introduction
In the field of image processing, though technical as well as theoretical advancement and researches have been quite performed, the functional approach for inter-connectivity analysis especially for image segmentation and intelligent classification with boundary detection techniques in the light of mathematical foundation perspective is yet to be investigated. The functional model of intelligent classification of imaging parameters as well
as its developments are only either investigated or applied by various hybridized and unique models, but the foundational aspect of interconnected links and the flow of propagation among multiple functions and variables between each operations implemented in field of imaging especially in thermal imageries are still required to be cultivated more elaborately. In the area of image segmentation and boundary detection process, many theoretical as well as numerical combined approaches have been proposed and implemented, e.g., Markov Random Filed Model with Kullback–Leibler distance
measurement technique for structural segmentation [5] in early age; but any mathematical based interoperability method to analyze the inter-related dependency among the different components and models are still needed to be investigated more wisely.
Many researches in image processing (area segmentation, boundary detection, contour division, noise reduction, resolution enhancing) have been carried out to establish the temperature-color perspective in thermography e.g., common infrared color imaging technique [6, 11, 12] used to detect the fire temperature where the thermal affected areas are indicated by edge detection technique. The fire break out state in underground coal seam has been tracked by infrared telescopic camera from LANDSAT satellite [6] launched by NASA. The temperature distribution model for under coal pile has been recognized by chromatics thermal camera [11], [12].
The various imaging techniques such as segmentation, edges, denoising, etc., has been enhanced [1, 2, 16, 17, 19] by different mathematical interpolations and models. The edge detection of objects in medical imagery has been implemented [1], [16] on an MRI image of brain and an x-rayed image of a grain for experiment. The furnace flame recognition approach based on image processing technique has been introduced [2] to measure the combustion stage of flame inside the boiler. The theoretical developments of mathematical interpolations based on probabilistic distribution models implemented in MATLAB [17], [19] has been introduced for different image processing technique such as sharpening, object detection, feature extraction etc.
Technical approaches for various image processing functions have been theoretically developed [3, 4, 5, 7, 10] for supportive imaging tools strictly based on numerical formation. The mathematical developments of contour variation based on color values [3], [4], [5] in image has been introduced and simulated in MATLAB platform. The edge of object in image has been detected [7], [10] by the probability density function based chromatic value of objects in image.
The video sequences based fire detection technique has been introduced [9, 13, 14, 15, 18] by using infrared CCD cameras. The boundary area of flame in video image captured in CCD cameras [9], [13], [14], [15] which are installed at different location in a furnace has been detected by different image processing techniques like region growing, Gaussian field, Markov distribution etc. The recognition of fire in a video sequence has been detected [18] by the chromatic value of the flame.
Various mathematical operations [19] e.g., Fourier transformation, Laplace transformation, Gaussian function, Poisson filter for noise reduction process, numerical formulation, set theory, Minkowski fields which are generally implemented in various fields of image processing technique e.g., contrast sketching, histogram equalization, colour space changing, resolution enhancement, object tracking, positioning of the object,
image skeletoning, colour to gray conversion, pattern identification etc.,
However, NO mathematical models to indicate the dependency between those variables in their image processing techniques in the light of mapping are found in their studies. Mathematical foundation models for image processing especially for thermal image processing technique is not implemented from mapping perspective yet. The mapping in image processing could be used to connect the missing link among different models of image processing techniques by approach used of abstract algebra [20]. The mathematical design is the most crucial component in image processing to pilot the general practices in appropriate direction. The abstract algebra would be taken as the Highest Form of interoperable platform between any mathematical model especially used in image processing in this investigation. The certain mathematical operations basically used in image processing technique such as Gaussian distribution, fuzzy model, Markov field or partial differential equation would be inter-mapped with the help of metaphoric elements of abstract algebraic method.
The functional mapping in image processing will be compared into multiple abstract algebraic parameters e.g., domain, set, category etc., so that the abstract algebra could be implemented to describe the area segmentation as well as boundary detection method together and found the flow of basic processes in thermographic imaging for series of alarm generation for fire protection in real-life environment. The entanglement mapping technique among abstractive groups will be analyzed by functional characteristics of convolution property so that the code of DAGSVM based intelligent alarming system and region and boundary segmentation models based on temperature classification would be applied in MATALB platform. The core approach for the proper mathematical foundation based inter-connected model investigated would basically dependent on the pattern of temperature distribution points between reference and fire break-out temperature of an image of artificially ignited coal captured by self-assembled infrared camera.
coal are represented in Section VII. And it’s concluded in Section VIII.
2. The Basic Framework Design of the
Introduced Method
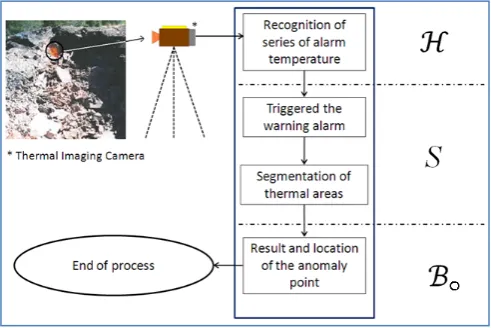
The design of the framework deals with the external skeleton of this investigation which discusses the basic establishment of the investigation from obtaining of image to produced result. The thermal image processing for temperature monitoring technique is designed by abstract algebraic formulation mentioned as: 𝒇𝒇𝒕𝒕𝒕𝒕: 𝑨𝑨𝒑𝒑⟶ 𝑩𝑩𝒑𝒑
Where,
• Ap = fire broke out condition • Bp = result and anomaly point
• fth = temperature increment based thermal imaging
In the above elements, the real-life scenario (Ap) and
introduced thermal image processing technique (fth) as well as experimental (Bp) output from the process are
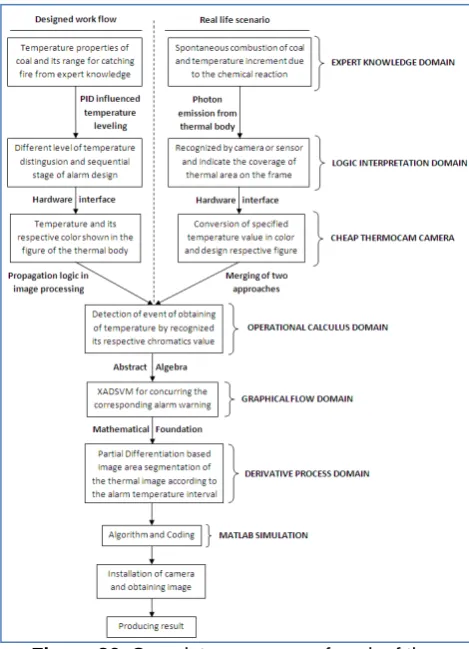
represented in canonical form. The block diagram shown in the Fig 1 below is categorized into 3 basic sections as: (Ap) indicates hardware setup for obtaining temperature
value of coal by thermal camera in practical background, section (fth) shows the designed technique and coding according to the theoretical analysis (Te) of the image
processing model and the tentative result indicated in Bp:
Figure 1. Basic flow of the investigation
The complete morphism structure of the model in mathematical abbreviation is indicated below:
𝒇𝒇𝒕𝒕𝒕𝒕: 𝑨𝑨𝒑𝒑 𝑻𝑻𝒆𝒆 → 𝑩𝑩𝒑𝒑
Where, S is the convolution operation of theoretical development (Te) for the thermal imaging technique (fth)
together as: S = [fth⋆ Im]. So, image processing technique
is morphism from hardware setup for obtaining parameters to final result. The step-by-step flow of connectivity among multiple operations of fire protection technique investigated are linked as the sequence
indicated: event-calculus for alarm generation →𝑡𝑡𝑡𝑡
DAGSVM process for corresponding alarm levels →𝑡𝑡𝑡𝑡
partial derivative based area segmentation →𝒕𝒕𝒕𝒕 boundary
detection technique →𝒕𝒕𝒕𝒕 integration of multiple operations
in a single interface →𝒕𝒕𝒕𝒕 compare the mechanism with the produced result.
3. Event Calculus Based Fire Alarm
Generation
Now, determining the proper alarm sequence with respect to different level of temperature increment is designed by event calculus (ItF) [21] based event
detection technique in this investigation as follows:
•AL = {A1, A2, A3, A4} [generating alarm sequence]
• Tr = {T0, T1, T2, T3, T4, TF} [temperature increment
sequence], T0 = initial temperature and TF = fire
ignition point of coal
•t = {t0, t1, t2, t3, t4, tf} [time variation sequence]
Where, temperature T0 is considered as the reference
point for beginning of monitoring process at time of detection t0 and temperature TF is considered as fire break
out point of coal at time tf. The clauses in event-calculus
used in this investigation to map relation between the variables are mentioned below:
• initiate(α, β, τ) = event β (alarm) start to occur after action α happens at time τ (t)
•initiate(T1, A1, t1) = alarm A1 starts to occur after T1
temperature obtained at the time t1 moments
• initial(α, τ) = action α (triggering of alarm) starts at time τ (t)
•initial(F1, t0) = action F1 starts at the time of t0
•holdAt(α, τ) = event α held at the time τ
•terminate (α, β, τ) = event β (alarm) stops after action α at time τ (t)
•terminate(T2, A1, t2) = alarm A1 stops after T2
temperature obtained at t2 moment
• happen(α, τ) = α occurs at time τ
• happen(A1, T1) = A1 alarm generated at detection
time of temperature T1
• clipped(τ1, β, τ2) = event β terminated between τ1 and
τ2 time interval
• τ1< τ2= τ1time comes before τ2
time is represented as: T0+1 temperature detected at time
t0+1 hour.
Now, the formation of event calculus for A1 alarm
generation at time t1 for T1 temperature detection is
described as: initiate (𝑻𝑻𝟏𝟏,𝑨𝑨𝟏𝟏,𝒕𝒕𝟏𝟏)⟵ (𝒕𝒕𝟎𝟎<𝒕𝒕𝟏𝟏) ⋀ happen (𝑨𝑨𝟏𝟏,𝑻𝑻𝟏𝟏) ; so, for alarm (A1) is generated when the
temperature (T1) is detected at time (t1).
The 2nd formation of Event calculus for A2 alarm
generation at time t2 for T2 temperature: initiate
(𝑻𝑻𝟐𝟐,𝑨𝑨𝟐𝟐,𝒕𝒕𝟐𝟐)⟵[ terminate(𝑻𝑻𝟐𝟐,𝑨𝑨𝟏𝟏,𝒕𝒕𝟐𝟐)] ⋀ (𝒕𝒕𝟏𝟏<𝒕𝒕𝟐𝟐) ⋀
happen(𝑨𝑨𝟐𝟐,𝑻𝑻𝟐𝟐) ; so, for alarm (A2) after terminating of
alarm (A1) is generated when temperature (T2) is detected
at the time (t2).
The 3rd formation of Event calculus for A3 alarm
generation at time t3 for T3 temperature: initiate
(𝑻𝑻𝟑𝟑,𝑨𝑨𝟑𝟑,𝒕𝒕𝟑𝟑)⟵[HoldAt(𝑭𝑭𝟑𝟑,𝒕𝒕𝟐𝟐)⋀terminate(𝑻𝑻𝟑𝟑,𝑨𝑨𝟐𝟐,𝒕𝒕𝟑𝟑)] ⋀
(𝒕𝒕𝟐𝟐<𝒕𝒕𝟑𝟑) ⋀ initial(𝑭𝑭𝟒𝟒,𝒕𝒕𝟐𝟐) ⋀ ~clipped(𝒕𝒕𝟐𝟐,𝑭𝑭𝟒𝟒,𝒕𝒕𝟑𝟑) ⋀
happen(𝑨𝑨𝟑𝟑,𝑻𝑻𝟑𝟑); so, for alarm (A3) after terminating of
alarm (A2) is generated when temperature (T3) is detected
at the time (t3).
The 4th formation of Event calculus for A4 alarm
generation at time t4 for T4 temperature: initiate
(𝑻𝑻𝟒𝟒,𝑨𝑨𝟒𝟒,𝒕𝒕𝟒𝟒)⟵[ terminate(𝑻𝑻𝟒𝟒,𝑨𝑨𝟑𝟑,𝒕𝒕𝟒𝟒)] ⋀ (𝒕𝒕𝟑𝟑<𝒕𝒕𝟒𝟒) ⋀
happen(𝑨𝑨𝟒𝟒,𝑻𝑻𝟒𝟒); so, for alarm (A4) after terminating of
alarm (A3) is generated when temperature (T4) is detected
at the time (t4).
The 5th formation of Event calculus online monitoring upto time t4 for T4 temperature arrive at the ignition point:
initiate(𝒕𝒕𝒐𝒐𝒐𝒐𝒐𝒐𝒐𝒐𝒆𝒆)⟵ �𝒕𝒕𝟒𝟒<𝒕𝒕𝒇𝒇� ⋀ terminate �𝑻𝑻𝑭𝑭,𝑨𝑨𝟒𝟒,𝒕𝒕𝒇𝒇�; so, at the time (t4).
With all combination of alarms through event calculus is defined as: complete (alarm) ⟵ [initiate(𝑻𝑻𝟏𝟏,𝑨𝑨𝟏𝟏,𝒕𝒕𝟏𝟏)⋀ terminate(𝑻𝑻𝟐𝟐,𝑨𝑨𝟏𝟏,𝒕𝒕𝟐𝟐)] ⋀ [initiate(𝑻𝑻𝟐𝟐,𝑨𝑨𝟐𝟐,𝒕𝒕𝟐𝟐) ⋀ terminate(𝑻𝑻𝟑𝟑,𝑨𝑨𝟐𝟐,𝒕𝒕𝟑𝟑)] ⋀ [initiate(𝑻𝑻𝟑𝟑,𝑨𝑨𝟑𝟑,𝒕𝒕𝟑𝟑) ⋀ terminate(𝑻𝑻𝟒𝟒,𝑨𝑨𝟑𝟑,𝒕𝒕𝟒𝟒)] ⋀ [initiate(𝑻𝑻𝟒𝟒,𝑨𝑨𝟒𝟒,𝒕𝒕𝟒𝟒) ⋀ terminate �𝑻𝑻𝑭𝑭,𝑨𝑨𝟒𝟒,𝒕𝒕𝒇𝒇�] ⋀ initial(𝒕𝒕𝒐𝒐𝒐𝒐𝒐𝒐𝒐𝒐𝒆𝒆,𝒕𝒕𝟒𝟒) ⋀ �𝒕𝒕𝟎𝟎< 𝒕𝒕𝟏𝟏<𝒕𝒕𝟐𝟐<𝒕𝒕𝟑𝟑<𝒕𝒕𝟒𝟒<𝒕𝒕𝒇𝒇�.
However, time difference between two respective alarms is less than 1 hour; the situation is considered as critical: If [time(A2) or t2] – [time(A1) or t1] < 1 hr.; condition ⟶ critical. Or, [time(A2) – time(A1)] ⋂ [time(A3) – time(A2)] ⋂ [time(A4) – time(A3)] < 1 hr. Or, [t2 – t1] ⋂ [t3 –t2] ⋂ [t4 –t3] < 1 hr → Condition is Critical.
4. Mapping between DAGSVM and
Event-Detection Technique
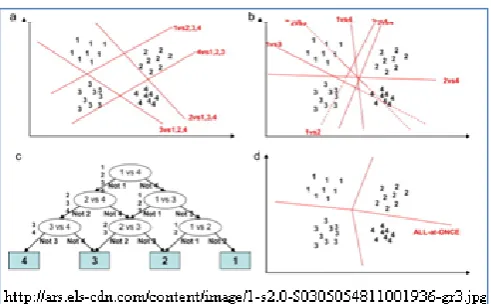
In directed binary acyclic graph which is rooted with k
leaves, contains 𝑘𝑘(𝑘𝑘−10)
2 no. of internal nodes where each
node is the binary SVM classes [22]. The respective prototype structure of DAGSVM is shown in Fig. 2 below:
Figure 2. Prototype of general DAGSVM model
The processing function of DAGSVM is analyzed in the light of mathematical foundation for establishing relation with event-calculus technique. The tetra stages of alarm series are defined according to the significance of fire break-out possibility indicated as: A1⟶Primary
tolerance temperature, (PTT); A2⟶Critical tolerance
temperature, (CTT); A3⟶Yellow alarm signal, (YL);
A4⟶Red alarm signal, (RL). The corresponding structure
of DAGSVM based on event-calculus model for alarm generation is shown in the Fig. 3 below:
Figure 3. DAGSVM with event-calculus
The flow of DAGSVM mechanism is formulated in mathematical interpretation for establish the inter-related mapping between event-calculus and temperature classification model for alarms. DAGSVM [23] process is in the light of mathematical foundation is formed with NOT (∼) function for individual alarm variables and binary operation (⨂) for separating different level of alarms. The operational flow of DAGSVM begins with the group of alarms indicates as: AL ∈ DAP (A1, A2, A3,
A4) = {∼A1}⨂{∼A2}⨂{∼A3}⨂{∼A4}, where functional
technique of DAGSVM is denoted as, DAP which
The alarm sequence would be generated in chronological order according temperature increasing pattern indicated as: Ti ⟶ alarm (Ai) | i∊[1,2,3,4]. To entangle from event-calculus to DAGSVM classification with respective pseudo-code for corresponding alarms, a new convolutive function gen()is introduced to mapping the interface between event calculus and DAGSVM process indicated as: gen[initiate(temperature, DAGSVM-code, time)]. DAP
= classification alarms series with respect to temperature by DAGSVM mechanism. The gen() function which is convoluted of detection of events by event-calculus and DAGSVM classification based alarm-code technique is defined according to the development of time (dt) in mathematical structure indicated as below:
𝑔𝑔𝑔𝑔𝑔𝑔[𝑖𝑖𝑔𝑔𝑖𝑖𝑖𝑖𝑖𝑖𝑖𝑖𝑖𝑖𝑔𝑔(𝑇𝑇,𝐶𝐶𝑑𝑑𝑆𝑆,𝑖𝑖)] =
∫ 𝑖𝑖𝑔𝑔𝑖𝑖𝑖𝑖𝑖𝑖𝑖𝑖𝑔𝑔(𝑇𝑇,𝐼𝐼𝑛𝑛𝐹𝐹𝑟𝑟𝑇𝑇𝑇𝑇 𝐴𝐴𝐿𝐿,𝑖𝑖).𝐷𝐷𝐴𝐴𝐴𝐴(𝐴𝐴𝐿𝐿)𝑑𝑑𝑖𝑖 ... (1)
Where, InT = reference temperature and FrT = fire
ignition temperature. The pseudo code for DAGSVM model (CdS) for gen() function for detection of alarms’
temperature is indicated as follows.
The gen() function for red alarm temperature detection code of DAGSVM is denoted as: ReA
// pseudo code for red alarm, 𝑹𝑹𝒆𝒆𝑨𝑨:𝑻𝑻𝟒𝟒⟶ 𝑹𝑹𝟒𝟒
Compare class = R1 and class = R4
If class ≠ R1
Compare class = R2 and class = R4
AND if class ≠ R2
Compare class = R3 and class = R4
AND if class ≠ R3
Class = R4
Alarm: RED alarm
The gen() function for yellow alarm temperature detection code of DAGSVM is denoted as: YlA
// pseudo code for Yellow alarm, 𝑌𝑌𝑙𝑙𝐴𝐴:𝑇𝑇3⟶ 𝑅𝑅3
Compare class = R1 and class =R4
If class ≠ R1
Compare class = R2 and class = R4
AND if class ≠ R4
Compare class = R2 and class = R3
AND if class ≠ R2
Class = R3
Alarm: yellow alarm
The gen() function for critical tolerance temperature detection code of DAGSVM is denoted as: CtA
// pseudo code for critical tolerance 𝐶𝐶𝑡𝑡𝐴𝐴:𝑇𝑇2⟶ 𝑅𝑅2
Compare class = R1 and class = R4
If class ≠ R4
Compare class = R1 and class = R3
AND if class ≠ R1
Compare class = R3 and class = R2
AND if class ≠ R3
Class = R2
Alarm: critical tolerance alarm
The gen() function for primary tolerance temperature detection code of DAGSVM is denoted as: PmA
// pseudo code for primary tolerance 𝑃𝑃𝑚𝑚𝐴𝐴:𝑇𝑇1⟶ 𝑅𝑅1
Compare class = R1 and class = R4
If class ≠ R4
Compare class = R1 and class = R3
AND if class ≠ R3
Compare class = R1 and class = R2
AND if class ≠ R2
Class = R1
Alarm: primary tolerance alarm
So, the gen() function is formulated with respect to abstractive algebra as: gen():event-calculus ⟶ DAP. So, the generation of alarm, gen() is morphism from detection of certain temperature increment occurrence by event-calculus to DAGSVM classification, DAP for respective
alarm generation. So, the classification of the alarms by event-calculus based DAGSVM technique (DAP) is
formulated as: DAP(A1,A2,A3,A4) =
{~gen(initiate(T1,PmA,t1))} ⨂ {~gen(initiate(T2,CtA,t2))}
⨂ {~gen(initiate(T3,YlA,t3))} ⨂
{~gen(initiate(T4,ReA,t4))}.
The pseudo code for each stage of alarm series by DAGSVM classification is defined under a group {CdS}
as indicated below:
{𝑹𝑹𝒆𝒆𝑨𝑨,𝒀𝒀𝒐𝒐𝑨𝑨,𝑪𝑪𝒕𝒕𝑨𝑨,𝑷𝑷𝒎𝒎𝑨𝑨}∊ 𝑪𝑪𝒅𝒅𝑺𝑺
The combination of pseudo code for DAGSVM (CdS)
with event calculus technique (ItF) is morphism from the
temperature increment (∆T) to alarm levels (AL)
formulated according to the mathematical foundation indicated as follows:
(𝑪𝑪𝒅𝒅𝑺𝑺 ⤬ 𝑰𝑰𝒕𝒕𝑭𝑭):𝜟𝜟𝑻𝑻 ⟶ 𝑨𝑨𝑳𝑳
Where, ΔT = indicates the variation of temperature detected by thermal imaging camera.
5. Mathematical Foundation for Image
Area Segmentation
To establish the relationship between temperature increasing based sequential alarm stages and affected thermal region with its boundary in the image, the partial differentiation [24] is implemented as the analyzing factor in this investigation. The total region in the thermal image captured by thermographic camera [25] is denoted as ‘R’ which patterned all information about the temperature of the object in the form of pixel-color. The functionality of the thermal region, R as an image is defined as follows:
𝑅𝑅= � 𝑝𝑝𝑝𝑝𝑝𝑝𝑖𝑖𝑖𝑖[𝑐𝑐ℎ𝑟𝑟𝑝𝑝𝑟𝑟(𝑖𝑖𝑔𝑔𝑟𝑟𝑝𝑝)]
𝐹𝐹𝑟𝑟𝑇𝑇
𝐼𝐼𝑛𝑛𝑇𝑇
𝑑𝑑𝑇𝑇
• chrom(temp) = the artificial coloring of pixels for respective temperature values between 55℃ to 120℃
• posit[chrom(temp)] = coordinate position of that pixel in the image according to the temperature pattern of the object.
• dT = changing of temperature (T)
The partially derivation is applied to segment different level of temperature area in this study. The mathematical model is also formulated to compute the boundary detection technique of the affected areas as well.
So, the thermal areas are differentiated with respect to increasing pattern of temperature calculated by derivative model between the interval of alarms indicated
as: �𝜕𝜕𝜕𝜕
𝜕𝜕𝑇𝑇�𝐼𝐼𝑛𝑛𝑇𝑇 𝐹𝐹𝑟𝑟𝑇𝑇
, So, from reference to fire broke-out
temperature is distinguished into 4 intermediate alarm intervals: T1 = primary tolerance temperature; T2 = critical
tolerance temperature; T3 = yellow alarm temperature; T4
= red alarm temperature. The partial derivative equation of temperature based area segmentation will be
formulated as, X(R)=𝝏𝝏(𝑹𝑹) 𝝏𝝏𝑻𝑻�𝑇𝑇4
𝑭𝑭𝒓𝒓𝑻𝑻 ∪𝝏𝝏𝝏𝝏𝑻𝑻(𝑹𝑹)� 𝑇𝑇3 𝑇𝑇4 ∪𝝏𝝏𝝏𝝏𝑻𝑻(𝑹𝑹)� 𝑇𝑇2 𝑇𝑇3 ∪ 𝝏𝝏(𝑹𝑹)
𝝏𝝏𝑻𝑻�𝑇𝑇1 𝑇𝑇2
∪𝝏𝝏𝝏𝝏𝑻𝑻(𝑹𝑹)�
𝑰𝑰𝒐𝒐𝑻𝑻 𝑇𝑇1
, where InT = T0 as initial reference
temperature and FrT = TF as fire broke out temperature
mentioned in the event-calculus process. The integration of all segmented areas with respect to temperature variation is combined with union operation (⋃) of abstract algebra for mathematical foundation. Segmentation of temperature affected area before reference points (<InT) is
indicated as: 𝝏𝝏(𝑹𝑹)
𝝏𝝏𝑻𝑻�<𝑰𝑰𝒐𝒐𝑻𝑻 𝐼𝐼𝑛𝑛𝑻𝑻
But, segmentation of thermal region according to temperature variation is not possible to calculate by single factor, region (R), of partial differentiation in theory also. Some valuable parameters in image processing e.g. pixel position information in large image-coordinate (Px),
variation of pixel position with respect to its color (Ch)
and variation of color according to temperature (T) etc., are required to be considered for better analyzing of the image processing model. So, the differentiated factor of area segmentation technique is analyzed according to
multiple factors indicated as:�𝜕𝜕𝜕𝜕
𝜕𝜕𝑇𝑇�𝐼𝐼𝑛𝑛𝑇𝑇 𝐹𝐹𝑟𝑟𝑇𝑇 =�𝝏𝝏𝝏𝝏((𝑷𝑷𝑹𝑹) 𝒙𝒙)⤬ 𝝏𝝏(𝑷𝑷𝒙𝒙) 𝝏𝝏(𝑪𝑪𝒕𝒕)⤬ 𝝏𝝏(𝑪𝑪𝒕𝒕) 𝝏𝝏𝑻𝑻 �𝐼𝐼𝑛𝑛𝑇𝑇 𝐹𝐹𝑟𝑟𝑇𝑇
, where 𝝏𝝏(𝑹𝑹)
𝝏𝝏(𝑷𝑷𝒙𝒙) = Certain thermal area, R with
respect to position of pixels (Px) is denoted as: di;
𝝏𝝏(𝑷𝑷𝒙𝒙) 𝝏𝝏(𝑪𝑪𝒕𝒕) = variation of pixel area (Px) with respect to color (Ch) is
denoted as: vi;
𝝏𝝏(𝑪𝑪𝒕𝒕)
𝝏𝝏𝑻𝑻 = chromatics variation (Ch) with
respect to temperature T is denoted as: ci.
So, the complete thermal region {R} in the image differentiated partially with respect to temperature variation intervals between <InT and FrT point and other derivative factors is defined as:
X(R) =�𝝏𝝏(𝑹𝑹) 𝝏𝝏(𝑷𝑷𝒙𝒙)⤬
𝝏𝝏(𝑷𝑷𝒙𝒙) 𝝏𝝏(𝑪𝑪𝒕𝒕)⤬
𝝏𝝏(𝑪𝑪𝒕𝒕) 𝝏𝝏𝑻𝑻 �𝑇𝑇4
𝐹𝐹𝑟𝑟𝑇𝑇 ∪ �𝝏𝝏𝝏𝝏((𝑷𝑷𝑹𝑹) 𝒙𝒙)⤬ 𝝏𝝏(𝑷𝑷𝒙𝒙) 𝝏𝝏(𝑪𝑪𝒕𝒕)⤬ 𝝏𝝏(𝑪𝑪𝒕𝒕)
𝝏𝝏𝑻𝑻 �𝑇𝑇3 𝑇𝑇4 ∪ �𝝏𝝏𝝏𝝏((𝑷𝑷𝑹𝑹) 𝒙𝒙)⤬ 𝝏𝝏(𝑷𝑷𝒙𝒙) 𝝏𝝏(𝑪𝑪𝒕𝒕)⤬ 𝝏𝝏(𝑪𝑪𝒕𝒕) 𝝏𝝏𝑻𝑻 �𝑇𝑇 2 𝑇𝑇3 ∪ �𝝏𝝏𝝏𝝏((𝑷𝑷𝑹𝑹) 𝒙𝒙)⤬ 𝝏𝝏(𝑷𝑷𝒙𝒙) 𝝏𝝏(𝑪𝑪𝒕𝒕)⤬ 𝝏𝝏(𝑪𝑪𝒕𝒕)
𝝏𝝏𝑻𝑻 �𝑇𝑇1 𝑇𝑇2 ∪ �𝝏𝝏𝝏𝝏((𝑷𝑷𝑹𝑹) 𝒙𝒙)⤬ 𝝏𝝏(𝑷𝑷𝒙𝒙) 𝝏𝝏(𝑪𝑪𝒕𝒕)⤬ 𝝏𝝏(𝑪𝑪𝒕𝒕) 𝝏𝝏𝑻𝑻 �𝐼𝐼𝑛𝑛𝑇𝑇 𝑇𝑇1 ∪ �𝝏𝝏𝝏𝝏((𝑷𝑷𝑹𝑹) 𝒙𝒙)⤬ 𝝏𝝏(𝑷𝑷𝒙𝒙) 𝝏𝝏(𝑪𝑪𝒕𝒕)⤬ 𝝏𝝏(𝑪𝑪𝒕𝒕)
𝝏𝝏𝑻𝑻 �<𝐼𝐼𝑛𝑛𝑇𝑇 𝐼𝐼𝑛𝑛𝑇𝑇
… (2)
Now, for detecting the edge of the different level of temperature affected areas according to the compatible region (R) in the image is formulated by boundary
function indicated as:𝐵𝐵𝑛𝑛=𝑔𝑔 ��𝜕𝜕𝜕𝜕
𝜕𝜕𝑇𝑇�<𝐼𝐼𝑛𝑛𝑇𝑇 𝐹𝐹𝑟𝑟𝑇𝑇
�
Where, [e(Z)]𝑇𝑇 1
𝑇𝑇2= boundary of the affected region (Z)
between the temperature interval [T2 ∼ T1]. So, the
complete boundary of the thermal region {R} in the image with respect to temperature intervals between <InT and FrT is indicated as follows:
𝐵𝐵𝑛𝑛=𝑔𝑔 ��𝜕𝜕𝜕𝜕𝜕𝜕𝑇𝑇� 𝑇𝑇4 𝐹𝐹𝑟𝑟𝑇𝑇 � ∪ 𝑔𝑔 ��𝜕𝜕𝜕𝜕𝜕𝜕𝑇𝑇� 𝑇𝑇3 𝑇𝑇4 � ∪ 𝑔𝑔 ��𝜕𝜕𝜕𝜕𝜕𝜕𝑇𝑇� 𝑇𝑇2 𝑇𝑇3 � ∪ 𝑔𝑔 ��𝜕𝜕𝜕𝜕𝜕𝜕𝑇𝑇� 𝑇𝑇1 𝑇𝑇2 � ∪ 𝑔𝑔 ��𝜕𝜕𝜕𝜕𝜕𝜕𝑇𝑇� 𝐼𝐼𝑛𝑛𝑇𝑇 𝑇𝑇1 � ∪ 𝑔𝑔 ��𝜕𝜕𝜕𝜕𝜕𝜕𝑇𝑇�
<𝐼𝐼𝑛𝑛𝑇𝑇 𝐼𝐼𝑛𝑛𝑇𝑇
� … (3)
So, the mapping-flow between recognition of temperature affected area with area segmentation based on thermal-chromatics variation is designed by partial differentiation technique linked together as: differential mathematical process: complete thermal image ⟶ temperature based segmented image
6. Integration Multiple Functions and
Foundation of Inter-Mapping
Mathematical foundation based computational process investigated - event-calculus based DAGSVM classification for alarm generation and partial differentiation based thermal area segmentation with boundary detection in obtained image - are conjugated together in this section with functional assistance of abstract algebraic technique. To design the complete inter-connective architecture of the introduced technique, previous event-calculus based DAGSVM classification for alarms and partial differentiation (PDE) based thermal
area segmentation with boundary detection process are conglomerated each-other by intersection, union (∪, ∩) operation in set theory.
So, the interconnectedness of DAGSVM based alarm classification and thermal area segmentation [27] with edge detection (Bn) at temperature interval between initial
(InT) to primary tolerance point (T1) denotes is indicated
as: 𝒈𝒈𝒆𝒆𝒐𝒐�𝒐𝒐𝒐𝒐𝒐𝒐𝒕𝒕𝒐𝒐𝒊𝒊𝒕𝒕𝒆𝒆(𝑻𝑻𝟏𝟏,𝑃𝑃𝑚𝑚𝐴𝐴,𝒕𝒕𝟏𝟏)� ∩ �𝝏𝝏𝑹𝑹
segmentation at different level of alarm intervals is shown in the formulation below:
𝑻𝑻𝒕𝒕𝑬𝑬= �𝝏𝝏𝜕𝜕𝝏𝝏𝑇𝑇� 𝑻𝑻𝟒𝟒 𝑭𝑭𝒓𝒓𝑻𝑻 ∩ 𝑔𝑔 ��𝜕𝜕𝜕𝜕𝜕𝜕𝑇𝑇� 𝑇𝑇4 𝐹𝐹𝑟𝑟𝑇𝑇 �� ∪ �𝒈𝒈𝒆𝒆𝒐𝒐�𝒐𝒐𝒐𝒐𝒐𝒐𝒕𝒕𝒐𝒐𝒊𝒊𝒕𝒕𝒆𝒆(𝑻𝑻𝟒𝟒,𝑹𝑹𝒆𝒆𝑨𝑨,𝒕𝒕𝟒𝟒)� ∩ 𝝏𝝏𝜕𝜕 𝝏𝝏𝑇𝑇�𝑻𝑻𝟑𝟑 𝑻𝑻𝟒𝟒 ∩ 𝑔𝑔 ��𝜕𝜕𝜕𝜕𝜕𝜕𝑇𝑇� 𝑇𝑇3 𝑇𝑇4 �� ∪ �𝒈𝒈𝒆𝒆𝒐𝒐�𝒐𝒐𝒐𝒐𝒐𝒐𝒕𝒕𝒐𝒐𝒊𝒊𝒕𝒕𝒆𝒆(𝑻𝑻𝟑𝟑,𝒀𝒀𝒐𝒐𝑨𝑨,𝒕𝒕𝟑𝟑)� ∩ 𝝏𝝏𝜕𝜕 𝝏𝝏𝑇𝑇�𝑻𝑻𝟐𝟐 𝑻𝑻𝟑𝟑 ∩ 𝑔𝑔 ��𝜕𝜕𝜕𝜕𝜕𝜕𝑇𝑇� 𝑇𝑇2 𝑇𝑇3 �� ∪ �𝒈𝒈𝒆𝒆𝒐𝒐�𝒐𝒐𝒐𝒐𝒐𝒐𝒕𝒕𝒐𝒐𝒊𝒊𝒕𝒕𝒆𝒆(𝑻𝑻𝟐𝟐,𝑪𝑪𝒕𝒕𝑨𝑨,𝒕𝒕𝟐𝟐)� ∩ 𝝏𝝏𝜕𝜕 𝝏𝝏𝑇𝑇�𝑻𝑻𝟏𝟏 𝑻𝑻𝟐𝟐 ∩ 𝑔𝑔 ��𝜕𝜕𝜕𝜕𝜕𝜕𝑇𝑇� 𝑇𝑇1 𝑇𝑇2 �� ∪ �𝒈𝒈𝒆𝒆𝒐𝒐�𝒐𝒐𝒐𝒐𝒐𝒐𝒕𝒕𝒐𝒐𝒊𝒊𝒕𝒕𝒆𝒆(𝑻𝑻𝟏𝟏,𝑷𝑷𝒎𝒎𝑨𝑨,𝒕𝒕𝟏𝟏)� ∩ 𝝏𝝏𝜕𝜕 𝝏𝝏𝑇𝑇�𝑰𝑰𝒐𝒐𝑻𝑻 𝑻𝑻𝟏𝟏 ∩ 𝑔𝑔 ��𝜕𝜕𝜕𝜕𝜕𝜕𝑇𝑇� 𝐼𝐼𝑛𝑛𝑇𝑇 𝑇𝑇1 �� ∪ �𝝏𝝏𝜕𝜕𝝏𝝏𝑇𝑇�
<𝑰𝑰𝒐𝒐𝑻𝑻 𝑰𝑰𝒐𝒐𝑇𝑇
∩ 𝑔𝑔 ��𝜕𝜕𝜕𝜕𝜕𝜕𝑇𝑇�
<𝐼𝐼𝑛𝑛𝑇𝑇 𝐼𝐼𝑛𝑛𝑇𝑇
��… (4)
For designing a complete interfacing between event-calculus based DAGSVM classification for alarm series and partial differentiation based thermal area segmentation with boundary detection technique at a same level of temperature, intersection operation (⋂) of abstract algebra [28] is implemented to formulate the inter-connectivity equitation of the model.
For designing proper interfacing between DAGSVM classification based thermal area segmentation and boundary detection at a same level of temperature, the intersection operation (⋂) and for integrating the same functional components for different stages of temperature according to alarm intervals, the union operation (⋃) of abstract algebra is implemented to establish the mathematical entanglement model of designed architecture. In the other way, the intersection operation (⋂) is used to represent the interoperability factor between multiple functions at a same level known as horizontal interoperability and the union operation (⋃) is used to represent the interoperability factor between multiple functions at different stages known as vertical interoperability.
Abstract algebraic operations – intersection, union – are implemented as the convolutive function between horizontal and vertical interoperability technique in the proposed model as indicated below:
𝑻𝑻𝒕𝒕𝑬𝑬=∫<𝑰𝑰𝑭𝑭𝒓𝒓𝒐𝒐𝑻𝑻𝑻𝑻𝒈𝒈𝒆𝒆𝒐𝒐(𝑨𝑨𝑳𝑳)⋆ 𝑿𝑿(𝑹𝑹)⋆ 𝑩𝑩𝒐𝒐(𝒆𝒆) …(5)
Where, the inter-dependency between functional elements of gen(AL) – alarm classification, X(R) – area
segmentation, Bn(e) – boundary detection process within
the interval of temperature point (<InT) to (FrT) is
indicated by asterisk (⋆) in this foundation.
Now, the segmentation of a certain temperature (Tx)
affected region with certain chromatics value (mx) in the
thermal image of coal on the basis of partial differentiation technique is defined in the canonical formation indicated as below:
𝐶𝐶𝑥𝑥𝐴𝐴=� 𝑝𝑝𝑝𝑝𝑝𝑝𝑖𝑖𝑖𝑖[𝑐𝑐ℎ𝑟𝑟𝑝𝑝𝑟𝑟(𝑖𝑖𝑔𝑔𝑟𝑟𝑝𝑝)]𝑑𝑑𝑇𝑇 𝑇𝑇𝑥𝑥 𝑝𝑝𝑟𝑟,𝐶𝐶𝑥𝑥𝐴𝐴=𝝏𝝏(𝑹𝑹)𝝏𝝏𝑻𝑻 � 𝑇𝑇𝑥𝑥 𝑝𝑝𝑟𝑟,𝐶𝐶𝑥𝑥𝐴𝐴=𝝏𝝏(𝑨𝑨𝝏𝝏(𝑹𝑹) 𝑺𝑺)⤬ 𝝏𝝏(𝑨𝑨𝑺𝑺) 𝝏𝝏(𝑪𝑪𝒕𝒕)⤬ 𝝏𝝏(𝑪𝑪𝒕𝒕) 𝝏𝝏𝑻𝑻 �𝑇𝑇 𝑥𝑥
The boundary (Bx) of the segmented region at the
certain temperature (Tx) according to the boundary
detection technique is defined as follows:
𝐵𝐵𝑥𝑥= 𝑔𝑔 �� 𝐴𝐴𝑆𝑆(𝑟𝑟𝑥𝑥) 𝑇𝑇𝑥𝑥 � 𝑝𝑝𝑟𝑟,𝐵𝐵𝑥𝑥= 𝑔𝑔 �𝝏𝝏(𝑹𝑹)𝝏𝝏𝑻𝑻 � 𝑇𝑇𝑥𝑥 . 𝑝𝑝𝑟𝑟,𝐵𝐵𝑥𝑥 =𝑔𝑔 �𝝏𝝏(𝑨𝑨𝝏𝝏(𝑹𝑹) 𝑺𝑺)⤬ 𝝏𝝏(𝑨𝑨𝑺𝑺) 𝝏𝝏(𝑪𝑪𝒕𝒕)⤬ 𝝏𝝏(𝑪𝑪𝒕𝒕) 𝝏𝝏𝑻𝑻 �𝑇𝑇 𝑥𝑥
Now, the output image at a certain temperature point (Tx) from the thermal image of coal on the basis of
abstract algebraic approach is defined in the mathematical foundation indicated as below:
𝐶𝐶𝑥𝑥𝑇𝑇=𝝏𝝏(𝑹𝑹)𝝏𝝏𝑻𝑻 � 𝑇𝑇𝑥𝑥 ∩ 𝑔𝑔[𝐴𝐴𝑆𝑆(𝑟𝑟𝑥𝑥)]𝑇𝑇𝑥𝑥 𝐶𝐶𝑥𝑥𝑇𝑇=𝝏𝝏(𝑷𝑷𝝏𝝏(𝑹𝑹) 𝒙𝒙)⤬ 𝝏𝝏(𝑷𝑷𝒙𝒙) 𝝏𝝏(𝑪𝑪𝒕𝒕)⤬ 𝝏𝝏(𝑪𝑪𝒕𝒕) 𝝏𝝏𝑻𝑻 �𝑇𝑇𝑥𝑥∩ 𝑔𝑔[𝐴𝐴𝑆𝑆(𝑟𝑟𝑥𝑥)]𝑇𝑇𝑥𝑥
Where, CxT = segmented area in the thermal image of coal at a certain temperature (Tx) with respect to position
of the pixel in the thermal image= 𝝏𝝏(𝑹𝑹)
𝝏𝝏(𝑷𝑷𝒙𝒙) , variation of pixel area with respect to pixel color =𝝏𝝏(𝑷𝑷𝒙𝒙)
𝝏𝝏(𝑪𝑪𝒕𝒕) , chromatics variation with respect to temperature =𝝏𝝏(𝑪𝑪𝒕𝒕)
𝝏𝝏𝑻𝑻 at that
certain temperature point and boundary detection, Bx:
𝑔𝑔 �𝝏𝝏𝝏𝝏𝑻𝑻(𝑹𝑹)�
𝑇𝑇𝑥𝑥 .
7. Obtained Thermal Images and
Simulation of Results
The variation of pixel color with respect to temperature
differences, implemented in this investigation as: 𝝏𝝏(𝑪𝑪𝒕𝒕)
𝝏𝝏𝑻𝑻 , is
obtained by the self assembled thermal imaging camera “Thermocam V2.0” brought from a German organization entitled “Cheap-Thermocam”. The color-temperature scale for representing various temperature affected areas by different chromatic values is standardized by the software platform provided by the manufacturer of the thermal camera devices downloaded from “http://www.cheap-thermocam.net”. The parts of the camera are brought from foreign organization and assembled & tested in the parent institute. The pixel color
variation with respect to temperature: 𝝏𝝏(𝑪𝑪𝒕𝒕)
𝝏𝝏𝑻𝑻 is scaled by
self-assembled thermal imaging camera and its parts are shown in the Fig. 4 below:
Figure 4. DAGSVM with event-calculus
For obtaining the thermal image of an object, the heated coal is considered as the prime elements in this investigation. The distance between heated coal and thermal imaging camera is 1.65 meter and the size of the object, configured in this experimental setup, is measured according to the characteristics of the infrared sensor with 1.78 ratio scales [29]. The corresponding image of the configured experimental environment is shown in the Fig.5 below:
Figure 5. Experimental setup with distance of 1.65 meter
The detailed connection of wires in the thermal imaging camera is shown in the Fig. 6 below:
Figure 6. Wire diagram of the camera
For controlling of the total mechanism of the thermal imaging camera device, Arduino UNO R3 [30] with 8-bit Atmel AVR microcontroller [31], single-board microcontroller interface is embedded in this circuitry. For detection of thermal signature of any body, MLX90614ESF-BCI model [32] infrared sensor is deployed in the circuit to capture the emitted infrared radiation [33] from the target object. The movement of the infrared device is mounted on a platform supported by two 4.8 Volt servo motors [34] for horizontal and vertical movement of the platform. To locate the position of the infrared sensor form where thermal signature value would be taken is spotted by a 5 mW red dot laser [35].
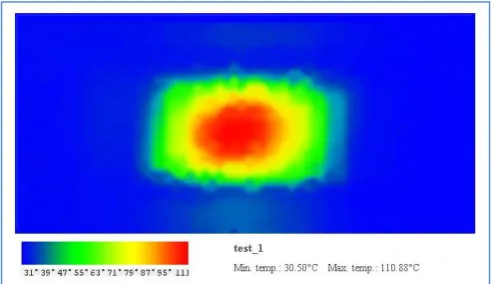
The obtained thermographic image of ignited coal is shown along with the temperature-chromatics scale standardized by the camera manufacturer and coded in 32 bit Java Virtual Machine [36] based .jar file where the minimum temperature and maximum temperature 30.52 °C and the maximum temperature 110.87 °C as indicated in the Fig. 7 below:
Figure 7. Obtained thermal image from camera
thermographic image is represented as “R” as shown in the Fig. 8 below:
Figure 8. Temperature affected area for calculation
The pattern of the temperature distribution and its classification with respect to the interval of alarm-temperature levels is shown in Fig. 9 below:
Figure 9. Segmentation of thermal image into respective temperature affected region
Now, analyzing the region of thermographic image [37] according to the introduced technique between temperature interval of (<InT) and (InT) is simulated in
MATLAB [38] platform. The boundary of the certain temperature affected area with respect to derived equation of boundary detection process is shown in Fig. 10 as follows:
Figure 10. Temperature affected area at the reference point
In the above figure, the consequent equation
𝑔𝑔 ��𝜕𝜕𝜕𝜕𝜕𝜕𝑇𝑇�
<𝐼𝐼𝑛𝑛𝑇𝑇 𝐼𝐼𝑛𝑛𝑇𝑇
� represents the thermal affected area at that certain temperature level. With the combination between the partial deferential equation based area segmentation
method and certain thermal chromatics value, : (0,12,241) shown in the thermographic image is implemented by the mathematical foundation based
Color-Temperature Relationship process:
�𝝏𝝏(𝑪𝑪𝒕𝒕) 𝝏𝝏𝑻𝑻 �<𝑰𝑰𝒐𝒐𝑻𝑻
𝐼𝐼𝑛𝑛𝑻𝑻
combined together at reference temperature
level as shown in Fig 11 below:
Figure 11. Chromatics value for reference temperature level with canonical formation
Analyzing of the region of thermographic image [37] between the temperature interval of initial (InT) and
primary tolerance point (T1), boundary of the certain
Figure 12. Temperature affected area at the primary tolerance level
In the above figure, the consequent equation
𝑔𝑔 ��𝜕𝜕𝜕𝜕𝜕𝜕𝑇𝑇�
𝐼𝐼𝑛𝑛𝑇𝑇 𝑇𝑇1
� represents the thermal affected area at that certain temperature level. With the combination between the partial deferential equation based area segmentation
method and certain thermal chromatics value, : (2,24,221) shown in the thermographic image is implemented by the mathematical foundation based
Color-Temperature Relationship process:
�𝝏𝝏(𝑪𝑪𝒕𝒕) 𝝏𝝏𝑻𝑻 �𝑰𝑰𝒐𝒐𝑻𝑻
𝑇𝑇1
combined with Primary Tolerance Level as
shown together in the Fig. 13 below:
Figure 13. Chromatics value for Primary tolerance temperature level with canonical formation
At this point of temperature, the primary tolerance alarm would be triggered according to the event-calculus based DAGSVM technique. Analyzing of thermal region between the temperature interval of primary (T1) and
Critical tolerance point (T2), boundary of certain
temperature affected area with respect to derived equation of boundary detection process is shown in Fig. 14 as follows:
Figure 14. Temperature affected area at the critical tolerance level
In the above figure, the consequent equation 𝑔𝑔 ��𝜕𝜕𝜕𝜕
𝜕𝜕𝑇𝑇�𝑇𝑇1 𝑇𝑇2 � represents the thermal affected area at that certain temperature level. With the combination between the partial deferential equation based area segmentation method and certain thermal chromatics value, : (0,138,186) shown in the thermographic image is implemented by the mathematical foundation based
Color-Temperature Relationship process: �𝝏𝝏(𝑪𝑪𝒕𝒕)
𝝏𝝏𝑻𝑻 �𝑇𝑇1 𝑇𝑇2
combined with Critical Tolerance Level as shown together in the Fig. 15 below:
Figure 15. Chromatics value for critical tolerance temperature level with canonical formation
At this point of temperature the critical tolerance alarm would be triggered as designed model. Analyzing of thermal region between the temperature interval of critical tolerance (T2) and yellow alarm point (T3), boundary of
certain temperature affected area with respect to the derived equation of boundary detection process is shown in Fig. 16 as follows:
In the above figure, the consequent equation 𝑔𝑔 ��𝜕𝜕𝜕𝜕
𝜕𝜕𝑇𝑇�𝑇𝑇2 𝑇𝑇3 � represents the thermal affected area at that certain temperature level. With the combination between the partial deferential equation based area segmentation method and certain thermal chromatics value, : (0,189,130) shown in the thermographic image is implemented by the mathematical foundation based
Color-Temperature Relationship process: �𝝏𝝏(𝑪𝑪𝒕𝒕)
𝝏𝝏𝑻𝑻 �𝑇𝑇2 𝑇𝑇3
combined with Yellow Alarm Level as shown together in the Fig. 17 below:
Figure 17. Chromatics value for yellow alarm temperature level with canonical formation
At this point of temperature the yellow alarm would be triggered according to the designed model. Analyzing of thermal region between the temperature interval of yellow alarm (T3) and red alarm point (T4) is simulated and the
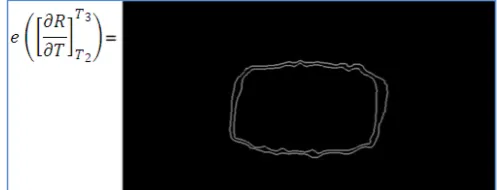
boundary of the temperature affected area with respect to the derived equation of boundary detection process is shown in Fig. 18 as follows:
Figure 18. Temperature affected area at the red alarm level
In the above figure, the consequent equation 𝑔𝑔 ��𝜕𝜕𝜕𝜕
𝜕𝜕𝑇𝑇�𝑇𝑇3 𝑇𝑇4 � represents the thermal affected area at that certain temperature level. With the combination between the partial deferential equation based area segmentation
method and certain thermal chromatics value, : (106,255,2) shown in the thermographic image is implemented by the mathematical foundation based
Color-Temperature Relationship process: �𝝏𝝏(𝑪𝑪𝒕𝒕)
𝝏𝝏𝑻𝑻 �𝑇𝑇3 𝑇𝑇4
combined with Red Alarm Level as shown together in the Fig. 19 below:
Figure 19. Chromatics value for red alarm temperature level with canonical formation
At this point of temperature the red alarm would be triggered and the monitoring sequence would be continuous. Analyzing of thermal region between the temperature interval of red alarm (T4) and fire-break out
point (FrT) is simulated and the boundary of the
temperature affected area with respect to the derived equation of boundary detection process is shown in Fig. 20 as follows:
Figure 20. Temperature affected area at the fire ignition level
In the above figure, the consequent equation
𝑔𝑔 ��𝜕𝜕𝜕𝜕𝜕𝜕𝑇𝑇�
𝑇𝑇4 𝐹𝐹𝑟𝑟𝑇𝑇
� represents the thermal affected area at that certain temperature level. With the combination between the partial deferential equation based area segmentation method and certain thermal chromatics value, : (255,148,4) shown in the thermographic image is implemented by the mathematical foundation based
Color-Temperature Relationship process: �𝝏𝝏(𝑪𝑪𝒕𝒕)
𝝏𝝏𝑻𝑻 �𝑇𝑇4 𝐹𝐹𝑟𝑟𝑻𝑻
combined with Fire Broke-Out Level as shown together in the Fig 21 below:
The certain thermal color value in the thermographic image of coal in simulated in MATLAB defined in
mathematical foundation process: 𝝏𝝏(𝑹𝑹)
𝝏𝝏𝑻𝑻�𝑇𝑇𝑥𝑥 for a certain
point of temperature (Tx = 74℃) obtained from the
thermal-color scale of thermal imaging camera, mx is
independent of chromatics since the image processing is directly interconnected with the temperature value as well.
So, the combined figure between the certain temperature-affected regions of coal and thermal chromatics value at that certain temperature point (Tx) is
shown in the Fig. 22 below:
Figure 22. Certain temperature affected region on the thermal image at (74℃)
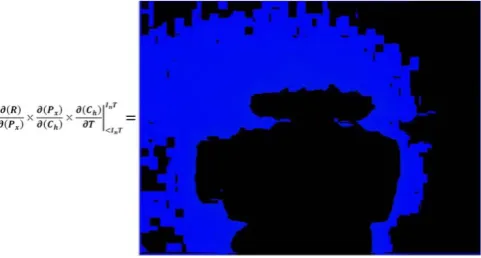
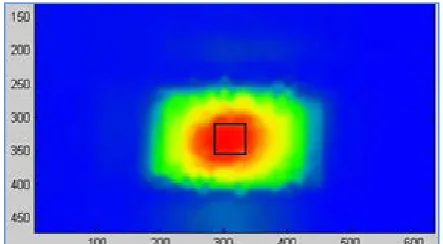
The affected area in the thermal image where the temperature is above fire break out point, known as anomaly point, is formulated by mathematical foundation model as indicated below:
𝑨𝑨𝒐𝒐𝒑𝒑=𝝏𝝏𝝏𝝏((𝑷𝑷𝑹𝑹𝒙𝒙))⤬𝝏𝝏𝝏𝝏((𝑪𝑪𝑷𝑷𝒕𝒕𝒙𝒙))⤬𝝏𝝏(𝝏𝝏𝑻𝑻𝑪𝑪𝒕𝒕)� 𝑭𝑭𝒓𝒓𝑻𝑻 >𝐹𝐹𝒓𝒓𝑻𝑻
… (6)
The location of the thermal anomaly point is indicated in a black square in Fig 23 below:
Figure 23. Anomaly point of coal fire thermal image
The more than 25 sets of physical temperature values with respect to the surface of coal for measuring the
spontaneous combustion effect in side of the coal using HTC, DM – 86 multimeter [40] based the thermocouple device are indicated in the Table 1 below:
Table 1. Comparative temperature reading between thermocouple and camera
Temp at edge Temp at centre
temp in thermocouple (°C)
temp in camera (°C)
temp in thermocouple (°C)
temp in camera (°C)
43 38.7 105 65.5
94 36.2 83 45.1
… … … …
44 38.7 57 48.9
The HTC, multimeter DM – 86 with the thermocouple is used to take the temperature value at the surface of the coal manually. The sets of the temperature values obtained by the both DM – 86 multimeter based thermocouple and “Thermocam V2.0” thermal imaging
camera are compared in MATLAB and the respective result are shown in the Fig. 25 below:
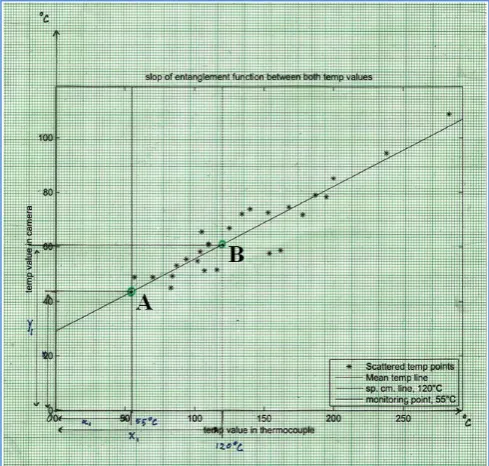
Figure 24. Compared graph of temperature value between camera and thermocouple
Figure 25. Respective temperature points detected by the camera
So, the relation between the function of both temperature values (reference, 55°C and ignition point, 120°C) are calculated by the 2D Euclidean Coordinate geometric method for a straight line passing through two coordinate (A, B) whose coordinate values are {x0 = 55,
y0 = 45} and {x1 = 120, y1 = 61} respectively. So, the
relation between the variables of the both temperature scale are indicated in coordinate geometry based mathematical formation as below:
(𝑦𝑦 − 𝑦𝑦0)(𝑥𝑥1− 𝑥𝑥0) = (𝑦𝑦1− 𝑦𝑦0)(𝑥𝑥 − 𝑥𝑥0)
(𝑦𝑦 −45)(120−55) = (61−45)(𝑥𝑥 −55) 65𝑦𝑦= 16𝑥𝑥+ 2045
𝑦𝑦= 0.2461𝑥𝑥+ 31.4615
So, the slope between the function of both temperature value is, m = 0.2461 and attribute, c = 31.4615. The relation between the function of the both temperature values obtained by the “Thermocam V2.0” and DM – 82,
thermocouple based temperature value is indicated as below:
Thermographic temp value = 0.2461 ⤬ thermocouple temp value + 31.4615 … (7)
8. Conclusion
In this paper, the image processing approach founded on mathematical interpretation bridges a dynamic missing-links between real-life scenario of image segmentation process and logical foundation of image processing technique which is not still investigated yet. The current work explains the implementation of mathematical abbreviations for founding of inter-connected flow between event-calculus based DAGSVM
technique with area segmentation and boundary detection in thermal images of heated object and described its application in temperature monitoring process for detecting fire break out possibility. The flow of mathematical models implemented in each theoretical step of the introduced technique and the applicability of image processing including hardware, software as well as an intelligent alarming system for fire monitoring is considered as the principal research constituent for this investigation. The designed model would be capable to integrate the image segmentation process with intelligent classification techniques by mathematical foundation approach. This methodology is useful to recognize the fire break out condition as well as tracing of the critical temperature point of spontaneous combustion especially in coal seams.
So, the relation between the differently obtained temperature-sets is integrated by 2D Coordinate geometric method in the form of canonical to represent interconnection between them. The slope in the straight-line equation between two temperature measurement functions indicates the increasing pattern of the temperature value detected by thermographic camera with respect to thermocouple based temperature measured value in experiment. The mathematical formulation based 2 dimensional entanglement technique between two or multiple different parameter and their dependable functions is introduced in this investigation.
Appendix.
The determination of temperature values for different alarm intervals are calculated by the PID (proportional – integral – derivative) [39] control technique. The increasing of alarm sequence with respect to increment of temperature is based on derivative approach of PID. However, the complete monitoring technique is computed on the basis of integral approach of PID control model. To determine the various temperature ranges of different alarm intervals, arithmetic functions are implemented in this investigation. The values of different alarm levels temperature are calculated as: primary tolerance temperature, (T1): InT + 1 ⤬ (FrT – InT)/5; critical
tolerance temperature, (T2): InT + 2 ⤬ (FrT – InT)/5;
yellow alarm temperature, (T3): InT + 3 ⤬ (FrT – InT)/5;
and red alarm temperature, (T4): InT + 4 ⤬ (FrT – InT)/5.
Figure 26. Complete sequence of work of the investigation
As well as, the critical situation could also be considered if the temperature measured crosses more than one alarm level in the next phase of monitoring within 1 hour of interval, the situation is considered as critical and triggers the red alarm. The conditions are considered as the threshold parameters for designing the critical response as indicated below:
• Ap = fire broke out condition • Bp = result and anomaly point
• fth = temperature increment based thermal imaging • Initial temperature (InT), t0 – critical tolerance
temperature alarm (CTT), t2
• Primary tolerance temperature alarm (PTT), t1 –
yellow alarm temperature (YT), t3
• Critical tolerance temperature alarm (CTT), t2 – red
alarm temperature (RT), t4
The logic flow diagram for designed the critical response situation is shown as follows:
Figure 27. Logic flow for detection of critical situation
Acknowledgements
We are eternally thankful to the Hon’ble Director of Indian Institute of Institute Information Technology, Allahabad for providing excellent infrastructure as well as valuable guidance for completing this manuscript in time.
References
[1] S.K. Weeratunga, C. Kamath, “An Investigation of Implicit Active Contours for Scientific Image Segmentation”, Visual Communications and Image Processing Conference, IS&T/SPIE Symposium Electronic Imaging, San Jose, CA, January 18-22, 2004.
[2] Rafeef Abu-Gharbieh, Clemens Kaminski, Tomas Gustavsson, Ghassan Hamarneh; “Flame Front Matching and Tracking in PLIF Images Using Geodesic Paths and Level Sets”; IEEE Transaction No. 0-7695-1278-X/01. [3] Tony F. Chan, Luminita A. Vese, “Active Contours
Without Edges”, IEEE Transactions on Image Processing, Vol. 10, No. 2, February 2001.
[4] Piotr Szczypiński, Paweł Strumiłło, “Application of an Active Contour Model for Extraction of Fuzzy and Broken Image Edges”, Institute of Electronics, Technical University of Łódź, Stefanowskiego 18/22, 90-537, 1996.
[5] Santhana Krishnamachari, Rama Chellappa,
“Multiresolution Gauss – Markov Random Field Models for Texture Segmentation”, IEEE Transactions on Image Processing, Vol. 6, No. 2, February 1997, p 251 – 267. [6] Zhuang Wei, Chen Yunhao, Cai Hongchun, Xu Jie,
[7] Xin Zhang, Chenggang Zhen, Pu Han, Fang Gao, “Extraction of Characteristic Parameters of Furnace Flame Based on Markov Model”, IEEE, ISIE – 2006
[8] J. C. Aparicio Femandes, J. A. B. Campos Neves, “Angle Invariance for Distance Measurements Using a Single Camera”, IEEE ISIE – 2006.
[9] Xin Zhang, Pu Han, Bing Wang, “Recognition of Furnace Flame Combustion Condition Based on Stochastic Model”, Fifth International Conference on Machine Learning and Cybernetics, Dalian, 2006.
[10] Sotirios P. Chatzis, Theodora A. Varvarigou, “A Fuzzy Clustering Approach Toward Hidden Markov Random Field Models for Enhanced Spatially Constrained Image Segmentation”, IEEE Transactions on Fuzzy Systems, Vol. 16, No. 5, October 2008, p1351-1361.
[11] Wang Yun-jia, Sheng Yao-bin, Gu Qiang, Sun Yue-yue, Wei Xiu-jun, Zhang Zhi-jie, “Infrared Thermography Monitoring And Early Warning of The Spontaneous Combustion of Coal Gangue Pile”, The International Archives of the Photo-grammetry, Remote Sensing and Spatial Information Sciences. Vol. XXXVII. Part B8. Beijing 2008.
[12] Hui Ren, Wei Jiang, Chaohui Lü, Shilei Bai, “Monitoring and Forecast Method of Mine External Fire”, International Joint Conference on Computational Sciences and Optimization, 2009.
[13] Min Xie, Jianhua Wu, Lin Zhang and Chun Li, “A Novel Boiler Flame Image Segmentation and Tracking Algorithm Based on YCbCr Color Space”, IEEE International Conference on Information and Automation, 2009 [14] Wang Yuanbin, Ma Xianmin, “Research on Fire Detection
in Coalmine Based on Fuzzy Neural Network”, Sixth International Conference on Natural Computation, ICNC – 2010
[15] Yuan Wen-Ju, Xu Kun and Hou A-Lin, “Reconstruction of 3-D Temperature Distribution for Combustion Flame Image”, proceedings of International Conference on Computer, Mechatronics, Control and Electronic Engineering (CMCE), IEEE, 2010.
[16] Zahra Shahvaran, Kamran Kazemi, Mohammad Sadegh Helfroush, Nassim Jafarian, “Region-based Active Contour Model based on Markov Random Field to Segment Images with Intensity Non-Uniformity and Noise”, Journal of Medical Signals & Sensors, Vol 2, Issue 1, Jan-Mar 2012.
[17] Genyun Sun, Xikui Sun, Xujun Han, “A New Method for Edge Detection Based on the Criterion of Separability”, Journal of Multimedia, Academy Publisher, Vol. 6, No. 1, February 2011.
[18] Turgay Celik, “Fast and Efficient Method for Fire Detection Using Image Processing”, ETRI Journal, Volume 32, Number 6, December 2010.
[19] Quang Tung Thieu, Marie Luong, Jean-Marie Rocchisani, Nguyen Linh-Trung, and Emmanuel Viennet, “Novel Active Contour Model for Image Segmentation Based on Local Fuzzy Gaussian Distribution Fitting”, Journal of Electronic Science and Technology, Vol. 10, No. 2, June 2012, p 113 – 118
[20] Sigurd Angenent, Eric Pichon, Allen Tannenbaum, “Mathematical Methods in Medical Image Processing”, Bulletin of The American Mathematical Society (special paper), Volume 00, Number 0, Pages 000 – 000.
[21] Murray Shanahan, “The Event Calculus Explained”, Department of Electrical and Electronic Engineering, Imperial College, London, England.
[22] Sonali Agarwal , Divya, G. N. Pandey, “SVM based context awareness using body area sensor network for pervasive healthcare monitoring”, First International Conference on Intelligent Interactive Technologies and Multimedia, Pages 271-278.
[23] Dr. Sonali Agarwal, Prof. G.N.Pandey, “Data Mining Based Human Computer Interface Design for Prognostic Indexing In Neonatal Intensive Care”, 4th International Conference on Intelligent Human Computer Interaction 2012 (IHCI 2012), Indian Institute of Technology Kharagpur.
[24] Gilbert Strang, Calculus 2nd edition, Massachusetts Institute of Technology, 1991.
[25] Version 2.0, Cheap-Thermocam, sender: Max Ritter, Mindelheim. Germany.
[26] Retrieved from:
http://www.arbiter.com/solutions/frequency-monitoring.php, on September 2013.
[27] Jafri, S.A.R.; Boutin, M.; Delp, E.J., “Automatic text area segmentation in natural images”, 15th IEEE International Conference on Image Processing, 2008. ICIP 2008. [28] Vijay K. Khanna, S. K. Bhambri, A Course in Abstract
Algebra, 2nd edition, Vikas Publishing House Pvt. Limited, 1998.
[29] electronicdesign.com/embedded/temperature-distance, retrieved on July 2013
[30] W. Durfee, “Arduino Microcontroller Guide”, University of Minnesota, USA, 2011.
[31] Prof. Ben Lee, “Atmel’s AVR 8-bit Microcontroller”, School of Electrical Engineering and Computer Science, Oregon State University, USA.
[32] Datasheet, MLX90614 family, Infrared Thermometer, Melexis Microelectronic Integrated System, Belgium. [33] Vasyl Morozhenko, Infrared Radiation, 1st edition, InTech
Publisher, Croatia, 2012.
[34] Datasheet, Servo – Small (ROB-09065), Sparkfun Electronics, Boulder, Colorado.
[35] Datasheet, Card Laser Module (COM-00594), Wenta-Electronic (SHENZHEN) Co., Ltd. Shenzhen City, China. [36] T. Lindholm, F. Yellin, G. Bracha, A. Buckley, The Java
Virtual Machine Specification, 7th edition, Oracle America, Inc., 2013.
[37] Jeff Beard, Introduction to Infrared Thermography, 1st edition, IT-570 IntroIR, 2007.
[38] MATLAB Programming Fundamental, R2013a, MathWorks, Inc., 2013.
[39] K. Ari, F. T. Asal, M. Coşgun, Project Report EE402: PI, PD, PID Controllers, Electrical & Electronics Engineering, Middle East Technical University, Ankara, Turkey. [40] Datasheet, HTC Instrument, DM – 86, multimeter –