© Global Society of Scientific Research and Researchers
http://ijcjournal.org/
A Quality of Experience Hexagram Model for Mobile
Network Operators' Multimedia Services and
Applications
Akpovi Ominike
a*, Jonah Joshua
b, Oludele Awodele
c, Achimba Ogbonna
da,b,c,dBabcock University, Ilishan, Ogun State, Nigeria
aEmail: [email protected]
bEmail: [email protected]
Abstract
Superior network Quality of Experience (QoE) is important for Mobile Network Operators (MNO) as it ensures they increase profit margins, attract new customers and differentiate themselves from the competition by providing better quality guarantees. In this paper, we propose a QoE hexagram model that comprises six Key Quality Indicators (KQI). In this model, we introduced an additional KQI, Terminal Quality. Other new metrics like Packet Corruption Rate and Service Access Time were also incorporated. Furthermore, several experiments were conducted by introducing disturbances using the NetEm tool. The QoE value obtained from our model is an indication of the overall acceptability of the applications and services as perceived subjectively by the end users.
Keywords: Acceptability; Mobile Network Operators (MNO); Quality of Experience (QoE); Terminal Quality.
1. Introduction
Traditionally, the approach for measuring the overall performance and user satisfaction of network services in the telecommunications industry is the objective Quality of Service (QoS) parameters gathered from the system. In this regard, the QoS parameters are checked and controlled keeping in mind the end goal to give an acceptable level of service quality. Distinctive QoS parameters like data transmission, packet loss and delay amongst others are basic measurements for deciding the service quality from a specialized perspective.
---
Be that as it may, QoS parameters alone do not really mirror the end users' fulfillment and emotions towards a specific network service [1]. Consequently, the estimation of how end users realistically discern networked services is moving from the deficient packet level Quality of Service (QoS) to the end user Quality of Experience (QoE) that incorporates content, the setting or context in which the service is used and their desires. The end user Quality of Experience (QoE) is one of the fundamental issues to be considered during the planning and designing of personalized services in mobile networks, in order to entice and retain more subscribers [2]. According to the International Telecommunications Union–Telecommunication Standardization Sector (ITU-T), QoE is “the overall acceptability of an application or service, as perceived subjectively by the end-user” [3]. This definition has two key points to take note of:
(1) QoE affects the complete end-to-end system (which includes the client, terminal, network and services infrastructure amongst others.)
(2) Overall acceptability may be influenced by user expectations and context.
The European Network on Quality of Experience in Multimedia Systems and Services, otherwise referred to as Qualinet, is a body responsible for multidisciplinary QoE research in Europe. According to the Qualinet white paper, QoE was described as "the degree of delight or annoyance of the user of an application or service. It results from the fulfilment of his or her expectations with respect to the utility and/or enjoyment of the application or service in the light of the user’s personality and current state" [4]. The perception of QoE is different from one application to another. For example, in a voice conversation scenario, the QoE is positive if there is the quality of the voice transmission is superb and the end user can communicate effortlessly. Similarly, for web surfing, a positive QoE means the end user should be able to download high resolution images, graphics and videos in good time [5]. Multimedia services and applications are a guaranteed money spinner for service providers and mobile network operators, Thus network operators should ensure a rich QoE for subscribers, which will translate to prominent market share and profits. Most Internet Service Providers (ISP’s) and Telecommunications companies (Telco's) have been focusing their attention on the improvement of QoS with the ultimate aim of improving user satisfaction. As a result of saturation in the telecoms and multimedia services industry, it is important that service providers have satisfied customers and are able to maintain and improve their subscriber base. Telcos today must not wait for customers and end-users to complain about the service quality before they react because it is very easy for customers to change network providers when they experience low service quality, due to the ease associated with changing service providers. Thus, it is imperative that service providers are able to continually monitor and improve QoE when necessary [6]. As shown in [7,8] most end users are prepared to pay more money to enjoy a superior quality of experience and they will just as well move to other service providers if their needs are not adequately fulfilled.
2. Review of Related Works
In their research, they used exploratory qualitative techniques involving focus group discussions/ interview to carry out the experiment. The data obtained was recorded, analyzed and discussed. A novel model that is suitable for managing QoE of Web Services was proposed by [20]. This model was developed by iterating certain QoE activities: QoE modeling, (which was achieved by integrating the Key Performance Indicators and Key Quality Indicators) QoE monitoring, measurements, forecast, and optimisation. In [21], the authors carried out a survey of recently proposed QoE frameworks based on certain defined features such as data analysis, and parameters for data collection and monitoring. A comparative analysis of existing QoE frameworks were reviewed in terms of some predefined qualities and characteristics. It was observed that most of the frameworks reviewed did not support both subjective and objective QoE assessment and policy change on degradation of users’ QoE. The authors in [22] focused on a Software Defined Network (SDN)-based framework QoE management. In their research work, the authors analyzed the framework and its three layers and thereafter, they connected the component parts of the framework to develop a SDN-based system, by utilizing the Opendaylight platform and Mininet emulator. From the reviewed literature, it was observed that most researchers focused on implementing QoE models that could evaluate the QoE for one particular service only (e.g. Voice over IP or Video on Demand only). The models developed lack widespread applicability in other services. In this research work, a QoE hexagram model was developed that would evaluate the QoE for multiple services.
3. Proposed Hexagram Model
The proposed QoE hexagram model is an enhancement of the pentagram model proposed by [12]. The hexagram model consists of certain Key Quality Indicators (KQI) and Key Performance Indicators (KPI). KPIs are "a set of quantifiable measures that are defined according to the key performance objectives" [23]. The Key Quality Indicators (KQI) values are obtained by evaluating the KPI's of a particular area of a service and are directly used to evaluate the QoE. As a rule of thumb, various KPI's have been defined by different standards' bodies. In this hexagram model, a new Key Quality Indicator (KQI), Terminal Quality was introduced with the associated Key Performance Indicators (KPI)- Terminal CPU Performance and Memory Consumption. This addition is important because irrespective of the values obtained for all the other mentioned KQI's, if the terminal quality is poor, it ultimately affects the overall QoE. Furthermore, a new KPI for usability, which takes care of the environment in context was introduced. In addition, two new KPIs, Packet corruption ratio and service access time were introduced for the Integrality and Retainability KQIs respectively. Table 1 shows the Quality of Experience Key Quality Indicators (KQI) and their associated measures.
Table 1: Quality of Experience KQI's and their associated measures. (Adapted from [12])
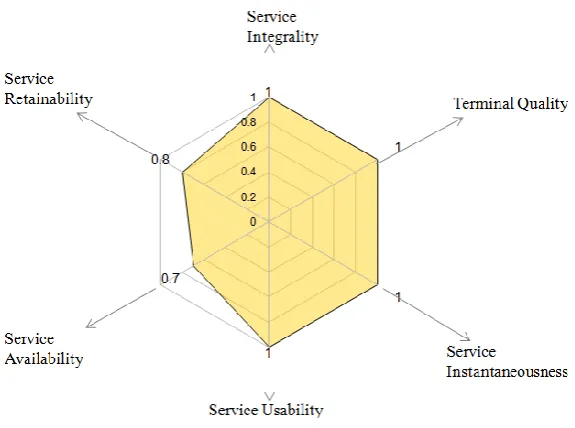
Figure 1: QoE Hexagram
In the QoE Hexagram model as illustrated in the hexagram in Figure 1, the QoE will be defined based on the evaluation and measurement of six QoE Key Quality Indicators (KQI) presented in Table 1. The value of the individual KQI's is obtained from the results of the KPI's established. We assume that the maximum and minimum values for each factor is 1 and 0 respectively. The area of the hexagram represents the QoE. The minimum QoE value is 0 and the maximum QoE value is approximately 2.58.
The hexagram comprises six triangles and the area of each triangle is computed as:
0.5 * L1 * L2 * Sin Ө, where L1, L2 represents the sides of the triangles and Ө represents the 600 angle between the two sides. The letters' a, b, c, d, e and f represent the six QoE Key Quality Indicators KQI's. The QoE is computed as:
QoE = 12 Sin 600 [ ab + bc + cd + de + ef + fa]
QoE = 1
2 * 0.8660 * [ ab + bc + cd + de + ef + fa]
QoE = 0.43 * [ ab + bc + cd + de + ef + fa]
3.1 Definition of Key Quality Indicators (KQI) and Their Associated Measures
In this section, we define the Key Quality Indicators (KQI) and the associated quality metrics that are used in the QoE Hexagram model.
3.1.1 Service Integrality
QoE metrics with service integrality: Packet Corruption, Delay, Jitter and Packet Loss Ratio.
Packet loss can be defined as the failure of IP packets travelling across a network to reach their destination. This could be as a result of transmission issues, congestion or limited memory. Packet Loss Ratio is defined as PLR = (No of Packets Lost / No of Packets Sent).
Delay, also referred to as latency, is the time involved in sending a packet from host to destination or vice versa.
Jitter can be defined as variation in delay and it usually caused by network congestion. If packets take the same time to move from one point to another in a network, there is no jitter.
"Packet corruption occurs when the receiver cannot correctly decode transmitted bits. Such decoding errors cause the cyclic redundancy check in the Ethernet frame to fail and force the receiver to drop the packet." [24]
The sum of the QoE of the Service Integrality is given by
a = β1 X Delay + β 2 X Jitter + β 3 X Packet Loss Ratio (PLR) + β 4 X Packet Corruption
Where β1, β2, β3 and β4 represent the weighting of Delay, Jitter, Packet Loss Ratio and Packet Corruption respectively.
3.1.2 Service Retainability
Service retainability defines the continuity of service connection under given times for a given duration. This is defined by the service interruption ratio and the service access time, and is given as b = ά1 X Service Access Time + ά 2 X Service Interruption Ratio.
Where ά1 and ά2 represent the weighting of Service Access Time and Service Interruption Ratio respectively.
3.1.3 Service Availability
This defines success ratio of user access service. Service availability is given as
c = (Uptime) / (Uptime + Downtime)
3.1.4 Service Usability
This is "the extent to which a product can be used by specified users to achieve specified goals with effectiveness, efficiency and satisfaction in a specified context of use." [25]. In this model, Quality of usability is defined as
Where ϓ 1, ϓ 2, ϓ 3 and ϓ 4 represent the weighting of Efficiency, Service Completion, Satisfaction and Environment respectively.
3.1.5 Service Instantaneousness
This defines the time it took to establish and access a particular service without perceptible delay. Instantaneousness, e, is defined as a subjective weighted metric based on the end user feedback.
e = f (response time)
3.1.6 Terminal Quality
This defines the quality of the end user device used in accessing the service. In this model, the performance of the central processing unit (CPU) of the device and the memory consumption of the device are used to establish the quality of the terminal.
f = λ1 X CPU Performance + λ2 X Memory Consumption
Where λ1 and λ2 represent the weighting of CPU performance and Memory Consumption respectively.
4. QoE Experiment and Analysis
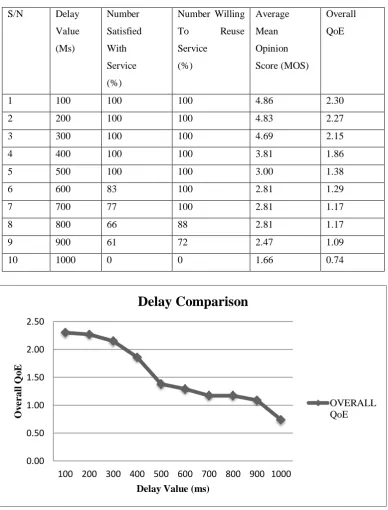
Table 2: Delay Comparison
S/N Delay
Value (Ms) Number Satisfied With Service (%)
Number Willing
To Reuse
Service (%) Average Mean Opinion Score (MOS) Overall QoE
1 100 100 100 4.86 2.30
2 200 100 100 4.83 2.27
3 300 100 100 4.69 2.15
4 400 100 100 3.81 1.86
5 500 100 100 3.00 1.38
6 600 83 100 2.81 1.29
7 700 77 100 2.81 1.17
8 800 66 88 2.81 1.17
9 900 61 72 2.47 1.09
10 1000 0 0 1.66 0.74
Figure 2: Overall QoE vs. Delay
5. Discussion
This study investigated the effect of delay on the overall QoE using the proposed model. The delay value was specified in milliseconds and it caused netem to delay all packets by this amount of time. The overall QoE of all subjects in the study for each delay level was averaged and the results obtained as shown in Table 2. This study revealed that users began to feel dissatisfied with the service when delay values rose to 600ms. The threshold for acceptability of the service was found to be 900ms as users were not willing to reuse the service at delay values
0.00 0.50 1.00 1.50 2.00 2.50
100 200 300 400 500 600 700 800 900 1000
O v e r al l Q o E
Delay Value (ms)
Delay Comparison
exceeding 900ms. The QoE at this point was 1.09. It was observed that a negative correlation existed between the delay value and the overall QoE.
6. Recommendations
The benefits of superior network QoE in present and future multimedia communications cannot be over-emphasized. In this study, a model which directly reflects the end user's perspective of the overall end-to-end performance of the network services was developed. Mobile network operators can use the obtained results to develop and create user focused strategies and implement network services that will ensure end user acceptance and satisfaction. In addition, researchers in the network performance and quality of experience domain and professionals in the telecommunications industry can also leverage on the findings of this study. Furthermore, it is recommended that QoE should be incorporated in network design and not retrofitted.
7. Conclusion
Today's market for mobile network operators and service providers is unpredictable, fast-paced and very competitive. End users now have more options when choosing service providers, so the challenge now for service providers is to keep users happy and prevent churn. In this paper, we developed a QoE model for Mobile Network Operators Applications and Services and we also conducted several experiments on web and video content to obtain the QoE and acceptable threshold for users using the developed model. To calculate the QoE value, according to our model, the values for the KPIs are computed along with their associated weights and the total sum is the QoE. With our QoE model, MNO's can ensure superior network QoE for end users, attract new customers and reduce churn rate. MNO's can also increase profit margins by charging more for better quality. The study was limited to evaluating the QoE using the KPIs earlier discussed. In future, we plan to examine the effect of other metrics on the QoE as the more the metrics involved, the higher the accuracy of the QoE value. In addition, the subject diversity was limited as the experiments were conducted in a laboratory setting and most of the test subjects were members of the academia. In future, field trials could be carried out or crowdsourcing approaches employed.
References
[1] A. Reis, J. Chakareski, A. Kassler, and S. Sargento, “Quality Of Experience Optimized Scheduling In Multi-Service Wireless Mesh Networks,” IEEE, vol. 1, no. 1, pp. 2109–2112, 2010.
[2] Y. Wang, W. Zhou, and P. Zhang, QoE Management in Wireless Networks. Springer, 2017.
[3] International Telecommunication Union, “ITU-T Recommendation FG IPTV-IL-0050: Definition of Quality of Experience (QoE),” Int. Telecommun. Union, vol. 12, no. January 2007, 2008.
[5] S. Jelassi, G. Rubino, H. Melvin, H. Youssef, and G. Pujolle, “Quality of experience of VoIP service: A survey of assessment approaches and open issues,” IEEE Commun. Surv. Tutorials, vol. 14, no. 2, pp. 491–513, 2012.
[6] T. Spetebroot, S. Afra, N. Aguilera, D. Saucez, C. Barakat, and I. S. Antipolis-Mediterranee, “From network-level measurements to expected Quality of Experience : the Skype use case,” IEEE, 2014.
[7] F. Venturini, C. Marshall, and E. Alberto Di, “Hearts, Minds and Wallets Winning the Battle for Consumer Trust,” pp. 1–16, 2012.
[8] Accenture, “Digital video and the connected consumer,” 2014.
[9] A. Perkis, S. Munkeby, and O. Hillestad, “A model for measuring Quality of Experience,” Proc. 7th Nord. Signal Process. Symp. - NORSIG 2006, pp. 198–201, 2006.
[10] F. Agboma and A. Liotta, “QoE-aware QoS Management,” ACM Int. Conf. Adv. Mob. Comput. Multimed., pp. 111–116, 2008.
[11] K. T. Chen, C. C. Tu, and W. C. Xiao, “OneClick: A framework for measuring network quality of experience,” Proc. - IEEE INFOCOM, pp. 702–710, 2009.
[12] Y. G. Y. Gong, F. Y. F. Yang, L. H. L. Huang, and S. S. Sen Su, “Model-Based Approach to Measuring Quality of Experience,” 2009 First Int. Conf. Emerg. Netw. Intell., pp. 1–4, 2009.
[13] D. Geerts et al., “Linking an integrated framework with appropriate methods for measuring QoE,” 2010 2nd Int. Work. Qual. Multimed. Exp. QoMEX 2010 - Proc., pp. 158–163, 2010.
[14] K. Rehman Laghari, K. Connelly, and N. Crespi, “Toward total quality of experience: A QoE model in a communication ecosystem,” IEEE Commun. Mag., vol. 50, no. 4, pp. 58–65, 2012.
[15] S. Khorsandroo, R. M. Noor, and S. Khorsandroo, “A mobility framework to enhance quality of experience through quality of service,” ICIMTR 2012 - 2012 Int. Conf. Innov. Manag. Technol. Res., pp. 630–634, 2012.
[16] Z. Jie and H.-J. Kim, “User feedback oriented quality of experience management framework,” China Commun., vol. 10, no. 1, pp. 72–80, 2013.
[17] W. H. Hsu, S. C. Yeh, Y. P. Shieh, and C. H. Hsieh, “Web-based QoE measurement framework,” Proc. - 2013 Int. Conf. Signal-Image Technol. Internet-Based Syst. SITIS 2013, pp. 265–272, 2013.
[19] M. Oubrich and A. Amine, “Exploratory study of QoE from mobile services users perspective: Case of Moroccan telecom industry,” 2016 Int. Conf. Inf. Technol. Organ. Dev., pp. 1–5, 2016.
[20] O. Radwan, “An Architectural Model for Managing Quality of Experience of Web Services,” pp. 513– 518, 2017.
[21] A. A. Laghari, H. He, S. Zardari, and M. Shafiq, “Systematic Analysis of Quality of Experience ( QoE ) Frameworks for Multimedia Services,” vol. 17, no. 5, pp. 121–124, 2017.
[22] E. Grigoriou, L. Atzori, and V. Pilloni, “A Novel Strategy for Quality of Experience Monitoring and Management,” 2017 IEEE Glob. Commun. Conf. GLOBECOM 2017 - Proc., vol. 2018-Janua, 2018.
[23] M. D. Stojanovic, M. M. Vukasinovic, and V. M. R. Djogatovic, “Approaches to Quality of Experience Management in the Future Internet,” Telecommun. Mod. Satell. Cable Broadcast. Serv. (TELSIKS), 2015 12th Int. Conf., pp. 281–288, 2015.
[24] D. Zhuo, M. Ghobadi, R. Mahajan, K.-T. Förster, A. Krishnamurthy, and T. Anderson, “Understanding and Mitigating Packet Corruption in Data Center Networks,” Proc. Conf. ACM Spec. Interes. Gr. Data Commun. - SIGCOMM ’17, pp. 362–375, 2017.
[25] ANSI, “ANSI/NCITS 354-2001: Common Industry Format for Usability Test Reports,” pp. 1–29, 2001.
![Table 1: Quality of Experience KQI's and their associated measures. (Adapted from [12])](https://thumb-us.123doks.com/thumbv2/123dok_us/8398083.1685425/4.595.83.506.644.762/table-quality-experience-kqi-s-associated-measures-adapted.webp)