(UDC: 004.921 ; 616.13-004.6-073)
Plaque formation and stent deployment with heating thermal effects in
arteries
N. Filipovic1,2, M. Radovic2,V. Isailovic2, Z. Milosevic2, D. Nikolic2, I. Saveljic2, M. Milosevic2, D. Petrovic2, M. Obradovic1, D. Krsmanovic1, E. Themis3, A. Sakellarios3, P. Siogkas3, P. Marraccini6, F. Vozzi6, N. Meunier4, Z. Teng5, D. Fotiadis3, O. Parodi6, M. Kojic2,7
1
University of Kragujevac, Kragujevac, Serbia, [email protected]
2
Bioengineering R&D Center, BioIRC, Serbia
3
University of Ioannina, Ioannina, Greece
4
University Paris Descartes, Paris, France
5
University of Cambridge, Cambridge, Great Britain
6
National Research Council Pisa, Italy
7
The Methodist Hospital Research Institute, Houston, USA
Abstract
Atherosclerosis is the number one cause of death worldwide. A three-dimensional computer model of plaque formation and development for artery is described. Stent deployment procedure for a specific patient is adopted and simulation of the temperature distribution for heating stent in the final position is analysed.
The three-dimensional blood flow is described by the Navier-Stokes equations, together with the continuity equation. Mass transfer within the blood lumen and through the arterial wall is coupled with the blood flow and is modeled by a convection- diffusion equations. The low density lipoproteins (LDL) transports in lumen of the vessel and through the vessel tissue are coupled by Kedem-Katchalsky equations. The inflammatory process is modeled using three additional reaction-diffusion partial differential equations. A fluid-structure interaction methodology is used to estimate effective wall stress distribution. Plaque growth functions for volume progression are correlated with shear stress and effective wall stress distributions.
We choose two patients from the MRI recording with significant plaque progression. Plaque volume progression is fitted using three time points for baseline, three and twelve months follow up. Our results for plaque localization correspond to low shear stress zone and we fitted parameters from our model using a nonlinear least square method.
In the arterial wall the maximal effective stress are found behind the stent and in the regions where the arterial wall was thinner. It was derermined that maximal stent temperature around 60ºC could give optimal temperature distribution between 45 ºC and 48 ºC for surrounding tissue and SMCs. These results suggest that heating of the implanted stent can be employed to prevent restenosis.
1 Introduction
Atherosclerosis is an inflammatory disease. A prominent role of LDL for inflammation in atherosclerosis is well known [Libby, 2012]. The process of inflammation starts with penetration of low density lipoproteins (LDL) in the intima. This penetration is followed by leucocyte recruitment in the intima. It may participate in formation of the fatty streak, the initial lesion of atherosclerosis and then in formation of a plaque [Loscalzo and Schafer 2002].
The blood flow and its influence to arterial wall behavior have been studied for decades. Computational techniques and simulations have been developed to understand the blood flow dynamics and the mechanical response of the arterial wall. Several mathematical models have recently been set up for the transport of macromolecules, such as low-density lipoproteins, from the arterial lumen to the arterial wall and inside the wall (e.g. [Tarbell 2003]-[ Quarteroni et al 2002]).
Serious problem of tissue ischemia is caused with narrowing and hardening of arteries. Today, treatments for blocked coronary arteries include bypass surgery, angioplasty, and stenting. Vascular stent is a small metal tube, which is inserted inside the artery with a role to change narrowing of the artery. The process of restenosis which is not desirable is caused by neointimal hyperplasia where an inflammatory phase, a granulation or cellular proliferation phase, and a phase of extracellular matrix protein synthesis are included [Edelman and Rogers 1998].
The effect of hyperthermia therapy is well-known in curing some diseases, such as liver tumours and prostate hyperplasia [Burd et al 1998- Yonezawa 1996]. About 30% restenosis rate for clinical cases limits the application of bare metallic stent. The idea is to make desirable temperature distribution inside the arterial wall around the stent in order to induce the vascular SMC apoptosis. Electromagnetic field can be used for significantly heating NiTi stent and the heating temperature can be adjusted by changing the voltage and heating time [Li et al 2005].
There are studies for modeling and design of stents computationally, since the stent design affects restenosis [Kastrati et al 2001, Rogers and Edelman 1995, Rogers et al 1999]. For modeling of balloon expansion with stent and artery contact, linear elastic models were implemented using a two- dimensional model (Rogers et al. 1999).
Lally and colleagues [Lally et al 2005] calculated the stent-artery interaction of commercially available stents on an idealized stenosed artery. Holzapfel et al. [Holzapfel et al 2004] modeled the balloon expansion of a full three-dimensional anisotropic diseased artery.
2 Materials and methods
Fifty patients with carotid atherosclerotic disease underwent high resolution MRI of their carotid arteries in a 1.5Tesla MRI system (Signa HDx GE Healthcare, Waukesha, WI) with a 4-channel phased array neck coil (PACC, Machnet BV, Elde, The Netherlands) [Sadat et al 2010]. The study protocol was reviewed and approved by the regional research ethics committee and all patients gave written informed consent. Two patients, with high plaque progression, were chosen. We did manual segmentation of plaque components, such as fibrous cap and chronic haemorrhage tissue, calcium and PH, using carotid MR images.
2.1 Basic equations
We here first summarize the fundamental equations for the LDL transport through blood vessel lumen and vessel wall, and for plaque development.. Also, we give a procedure for estimation of plaque growth function. The three-dimensional blood flow in lumen domain is modeled by the Navier-Stokes equations, together with the continuity equation of incompressible fluid:
2
0 t l l l l pl
u u u u
(1)
0
l
u
(2)
where ul is blood velocity in the lumen, pl is pressure, μ is the dynamic viscosity of blood, and ρ is blood density [Kojic et al 2008].
Mass transfer in the blood lumen is coupled with the blood flow by a convection-diffusion equation,
D c
l lc
l l
0
u
(3)
in the fluid domain, where cl is the solute concentration in the blood lumen, and Dl is the solute diffusivity in the lumen. Mass transfer in the arterial wall is coupled to the transmural flow and modeled by a convection-diffusion-reaction equation as follows
D
wc
wkc
w w
r c
w w
u
(4)
where cw is the solute concentration and Dw is the solute diffusivity in the arterial wall; uw is blood velocity in the wall, k is the solute lag coefficient, and rw is the consumption rate constant. The LDL transports in lumen and in the vessel wall are coupled by the Kedem-Katchalsky equations:
p dv
L
p
J
(5)
J
c
c
P
J
s
1
f v(6)
from solute dynamics. We assume that term P is a function of the wall shear stress (WSS),
describing higher permeability to areas with low shear stress 1 0
2
log(1
a
)
P
a
WSS
a
,where a0, a1 and a2 are positive parameters.
The above governing equations are transformed into a finite element system of incremental-iterative equations and solved over time steps.
The atherosclerotic process starts with the accumulation of LDL in the intima, where part of the LDL is oxidized and becomes pathological. In order to remove the oxidized particles, circulating immune cells (e.g. monocytes) are recruited. Once in the intima, the monocytes differentiate and become macrophages that phagocyte the oxidized LDL. Fatty macrophages then transform into foam cells. Foam cells are responsible for the growth of a subendothelial plaque which eventually emerges in the artery lumen.
The inflammatory process is modeled using three additional reaction-diffusion partial differential equations [Filipovic et al 2011],[ Filipovic et al 2010]:
1 1
2 1
3 1
(
)
/ (1
)
(
)
t
t w
thr t
O
d O k O M
M
div
M
d
M
k O M
S
S
S
d
S
S
k O M
O O
v
(7)
where O is the oxidized LDL in the wall, M and S are concentrations in the intima of macrophages and cytokines, respectively; d1,d2,d3 are the corresponding diffusion coefficients;
and are degradation and LDL oxidized detection coefficients; and vw is the inflammatory velocity of plaque growth, which satisfies Darcy‘s law and incompressibility continuity equation [Filipovic et al 2006]:
1w
p
w
k O M
v
(8)
0
w v
(9)
in the wall domain. Here, pw is the pressure in the arterial wall.
In order to follow change of the vessel wall geometry during plaque growth, a 3D mesh moving algorithm ALE (Arbitrary Lagrangian Eulerian) is applied [Filipovic et al 2006].
2.2 Fitting procedure for plaque volume growing function
For plaque volume growing a fitting procedure for growth function which takes into account change of the coordinates, shear stress as well as effective wall stress data from fluid-structure interaction calculation, is developed.
In this methodology we used three known times T1, T2 and T3 [Yang et al 2010] for estimation of plaque volume growth.
Starting from the plaque geometry at T1, we used three different growth functions to simulate plaque progression and tried to reach best agreement with plaque geometry obtained from image reconstruction at T2 and T3:
GF1-growth function which uses nodal coordinates data only,
GF3- growth function which uses nodal coordinates, shear stress and solid stress data.
These growth functions as well as the fitting procedure are described in detail in the appendix section.
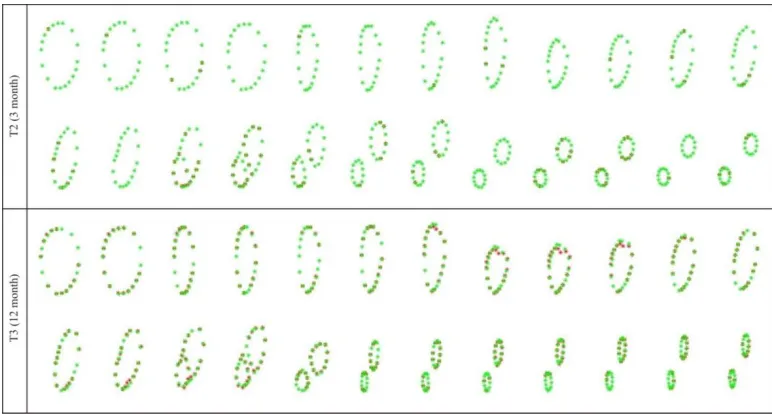
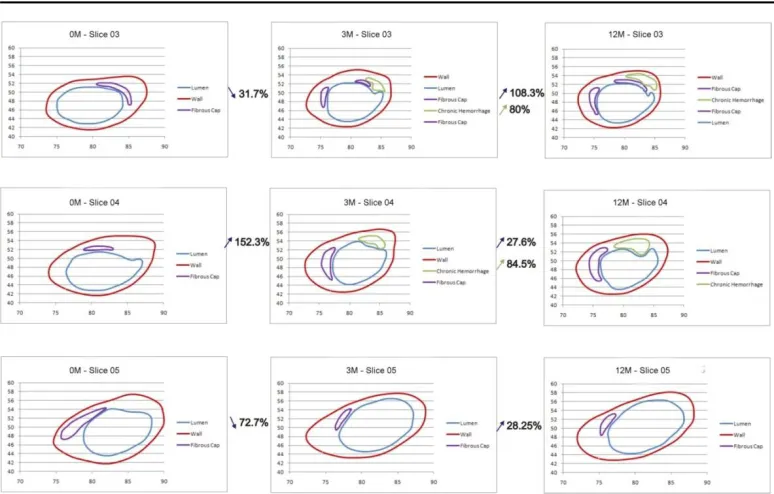
Overlapping contour plots of the target and simulated results for time steps T2 and T3 are presented in Fig. 1.
Fig. 1. Simulated contour plots compared with target contours at time steps T2 (3 months) and T3 (12 months). Green: simulated contours; Red: target contours.
3. Results
3.1 Basic data and results
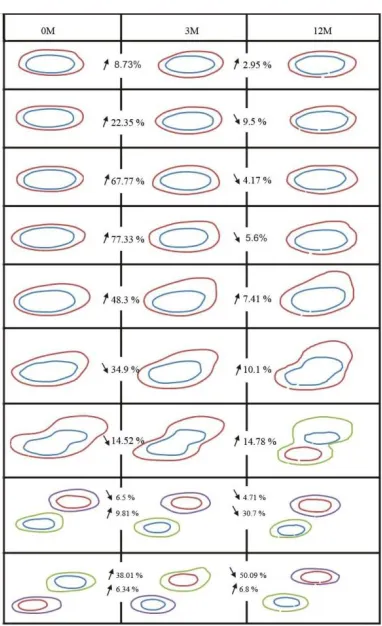
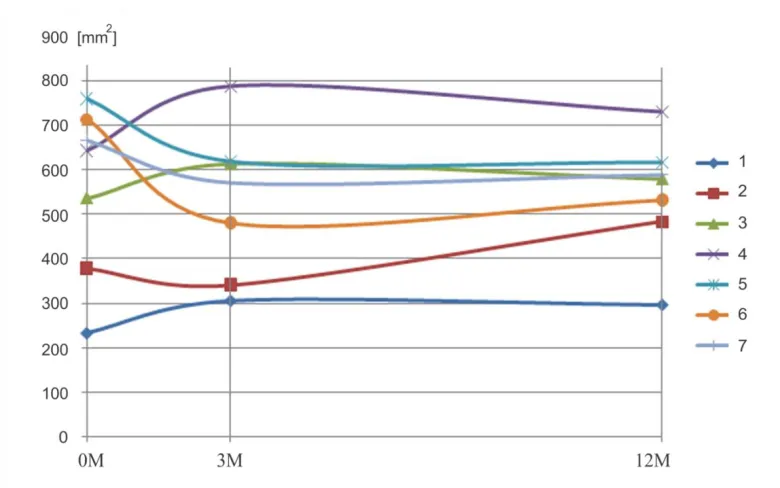
Fig. 2a. Cross-section areas changes for patient #1 (area between the inner and the outer wall)
Fig. 2c. Correlation of cross-sections changes with wall shear stress for patient #1
Fig. 3b. Correlation of cross-section areas changes with wall shear stress for patient #2
Different material properties for patient #1 are shown in Figs. 4a,b. There are three different parts in the carotid arterial wall with Young‘s elasticity modules: artery tissue E=3.0e6 Pa, fibrous cap E=6.0e6 Pa, subacute hemorrage E=4.5e6 Pa.
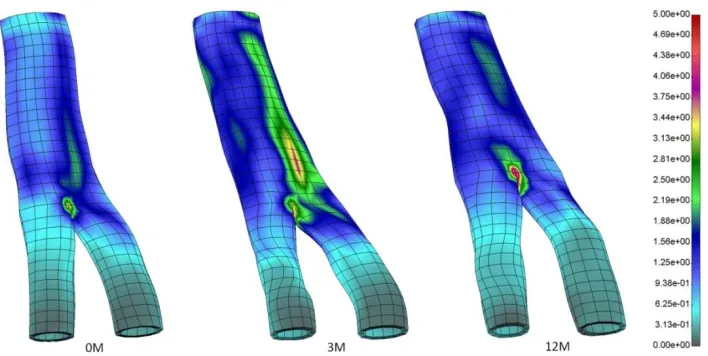
Effective wall stress for three diferent times (0,3, and 12 months) at maximum peak systole is presented in Fig. 5.
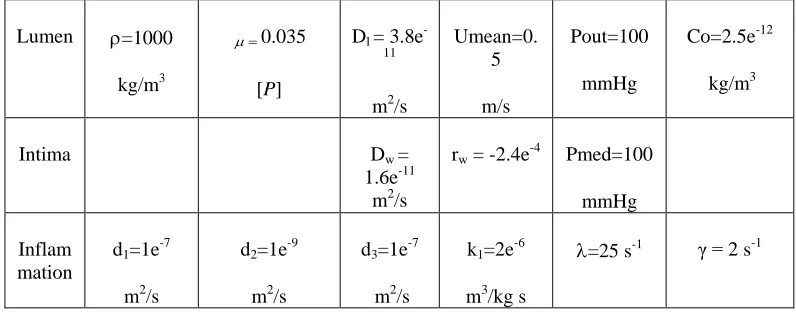
Volume of the plaque progression obtained from MRI system was fitted by employing a nonlinear least square analysis [Chavent 2002], in order to determine material parameters in equations of section 2. The fitted numerical parameters are given in Table 1.
Lumen =1000
kg/m3
0.035
[P]
Dl = 3.8e -11
m2/s
Umean=0. 5
m/s
Pout=100
mmHg
Co=2.5e-12
kg/m3
Intima Dw =
1.6e-11 m2/s
rw = -2.4e-4 Pmed=100
mmHg
Inflam mation
d1=1e-7
m2/s
d2=1e-9
m2/s
d3=1e-7
m2/s
k1=2e-6
m3/kg s
=25 s-1 γ = 2 s-1
Fig. 4a. Different material properties for patient #1 for follow-up study
Fig. 5. Effective wall stress calculated for follow-up time baseline, three and six month for patient #1 (units 1 = 1e5 Pa)
3.1 Growth functions and the fitting procedure
For simulation of the plaque growth, the following procedure was used:
Step 1: Start from the original in geometry at T1;
Step 2: Set
( ) ( )
( ) ( ) ( ( ) ( ))
( ) ( )
( ) ( ) ( ( ) ( ))
( ) ( )
( ) ( ) ( ( ) ( ))
Step 3: We use m time steps to go from T1 to T2 and n time steps to go from T2 to T3. This means that we use total time steps to go from T1 to T3.
For
do the following: GF1:
( )( ) ( ) ( ) ( ( ) ( ) ( ( )) ( )) ( )
| ( )
GF2:
( )( ) ( ) ( ) ( ( ) ( ) ( ( )) ( )) ( )
| ( ) ( ) ( ) ( )
| ( )
( )( ) ( ) ( ) ( ( ) ( ) ( ( )) ( )) ( ) | ( ) ( ) ( ) ( ) | ( ) ( ) ( ) ( ) | ( )
where |
( ) ( ) ( )( ) , | ( ) ( ) ( )( )
, and
| ( ) ( ) ( )( )
are derivatives of displacement, shear stress and solid stress respectively ,
is a time step, are and coordinates, are wall shear stress values
, are solid stress values at nodal points; is the slice number and is the index for the points on each slice. ( ) ( ) ( ) ( ) ( ) ( ) ( ) and ( ) are coefficients of growth functions GF1, GF2 and GF3 to be determined in such a way to obtain the best match of calculated geometries and experimental geometries at times T2 and T3. Since we use time steps from T1 to T2 and time steps from T2 to T3, we compared with experimental
geometry at time T2 and ( ) with experimental geometry at time T3. The previous
formulas of growth functions are very similar to formulas that Yang used in his paper [Yang 2010].
Coefficients of the plaque volume growth functions (GF1, GF2 and GF3) and are calculated, independently for all 24 slices by using simplex optimization method, which does not involve derivative calculations (developed by John Nelder and Roger Mead [Nelder and Mead 1965]). We minimized sum of the squared errors between calculated and real geometry at times T2 and T3 for each of 24 slices.
( ) ∑ (( ( ) ̅ ( )) ( ( ) ̅ ( )) ) ∑ (( ( )
̅ ( )) ( ( ) ̅ ( )) )
where is the number of nodes for slice ; ( ), ( ), ( ), and ( ) are real x
and y coordinates at time steps T2 and T3 for slice ; ̅ ( ), ̅ ( ), ̅ ( ) and ̅ ( ) are
calculated x and y coordinates at time steps T2 and T3 for slice .
The best results are obtained by using the growth function GF3 which takes into account both wall shear and solid stress. Total squared error is calculated as:
∑ ( )
Total squared errors for all growth functions are GF1=36.02, GF2=29.98, GF3=26.31.
The total squared error does not give a picture of how our model is really accurate, it only serves to compare results obtained by different growth functions. Because of that we calculated a mean relative percent error:
( ) (∑ ( ) ( ) ∑ ( ) ( ) ) ∑ ( )
where ( ) and ( ) are distances between real and predicted position of i-th point of
j-th slice at times T2 and T3. ( ) and ( ) are distances between real position of
The mean relative percent errors for all growth functions are GF1=2.7%, GF2=2.62%, GF3=2.51%.It can be observed that model which uses growth function GF3 is the most accurate. The mean relative percent errors for GF3 is 2.51%, which means that the distance between predicted position of point and real position of point is in average only 2.51% of the distance between real position of a point and the slice center of gravity. This seems to be a very good result.
3.2 Stent deployment and heating effects
In order to perform computer modeling of the combined effects of the surrounding arterial wall and inner forces of blood and stent deployment against the arterial wall, a 3D reconstruction for coronary artery was performed for a selected patient using IVUS and angiography recordings.
The FE model consists of the solid domain and the fluid domain. The solid domain consists ofstent and arterial wall. Fluid and solid domains are modeled using 3D-8-node finite elements.
Boundary conditions for the solid surrounding the artery are as follows. It is assumed that the starting and ending cross-sections do not move axially, hence all FE element nodes in these cross-sections are axially restrained.
According to the boundary conditions and loads mentioned above, the numerical analysis of the material behavior of this complex model is performed. To examine different loading conditions, we apply hemodynamic flow and include the stent deployment conditions at the arterial wall.
The stent is loaded by an internal uniform radial pressure which linearly varies from 0 to 1 MPa. Due to the artery incompressibility requirement and to avoid locking-problems, 8-node brick elements are used in all the analyses [Kojic et al 2008]. To properly accont the real conditions, we used up to 340330 elements and 313040 nodes.
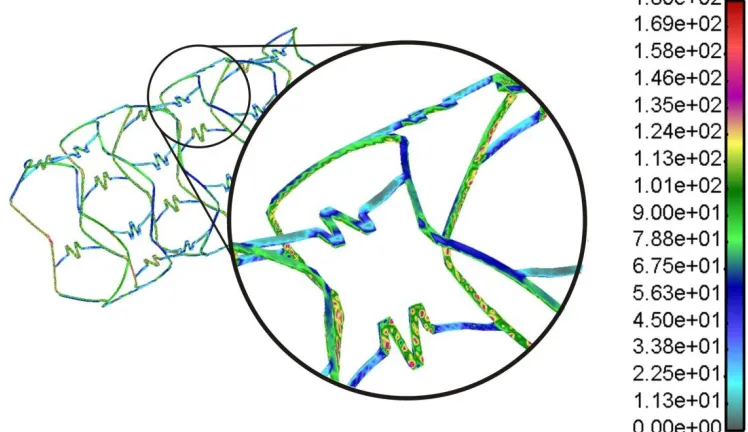
The effective (von Mises) stress distribution in the stent is presented in Fig. 6. It can be observed that high stresses zones are located near the connectors between the stent struts. These parts are subjected maximal stress around 180 MPa, which can produce plastic deformation
.
Fig. 7. Effective stress distribution in the two different cross-section locations inside the arterial wall at the end of stent deployment. The units are in MPa.
The effective stress distribution in the arterial wall at the two different cross-section locations at the end of stent deployment with maximum deployment pressure of 1MPa is shown in Fig. 7. It can be observed that higher stress exists when wall thickness is reduced during deployment procedure.
Fig. 8. Temperature distribution inside the arterial wall after stent deployment and heating. Left panel is outer arterial wall, middle section presents axial cross-section and right panel are two
The problem of occlusion can be solved with heating up the stent with an outer electromagnetic field [Floren et al 2004, Levitt et al 2003]. Temperature of the stent and the close surrounding cellular proliferation can reach the critical temperature where cells start deceasing. It is very important that the cells near the stent and the blood-vessel cannot be burned. The shape and living status of SMCs were influenced by the heat treatment procedures. [Li et al 2005] found three stages of SMCs reaction to heat: (1) when the temperature below is 45ºC, the living status was not changed; (2) between 45ºC to 50ºC, the cells shrinked and were less dyed with trypan blue, which indicated that they were still alive; (3) when the temperature was above the 50ºC, all the cells died. Also it was found that from 45ºC to 50ºC, the SMCs died in apoptosis. We optimized simulation of flux temperature through the stent in order to achieve approximately temperature between 45 ºC and 50 ºC for arterial wall. The results for temperature distribution after stent deployment and stent heating are shown in Fig. 8. The left panel is outer arterial wall temperature distribution, middle section presents axial cross-section and right panel are two radial cross-sections. We found that maximal stent temperature around 60ºC could give optimal temperature distribution between 45 ºC and 48 ºC for surrounding tissue and SMCs.
4 Discussion and conclusions
A three-dimensional computer model for plaque formation coupled with the the LDL transport within artery and through the vessel wall, and stent deployment with heating effects, are presented. The governing partial differential equations for plaque formation rely on the mass balance and Darcy‘s law in the domain of plaque development; the Navier-Stokes equations and diffusion equations are used for the LDL transport within the arterial lumen; and the transport-diffusion-reaction equations are employed for the transmural mass transport, including the Kedem-Katchalsky equations to couple the transmural and transport within the lumen. The wall permeability was assumed to be a function of the wall shear stress with lower permeability at low and oscillatory shear stress.
We described inflammatory process with a reaction-diffusion PDE system. Our model starts with passive penetration of LDL in particular areas of the intima. We assumed that once in the intima the part of LDL is immediately oxidized. When the oxidized LDL exceeds a threshold, recruitment of monocytes occurs. The incoming monocytes immediately differentiate into macrophages. Transformation of macrophages into foam cells contribute to the recruitment of new monocytes. It yields the secretion of a pro-inflammatory signal (cytokines), a self-support inflammatory reaction. Newly formed foam cells are responsible for the local volume increase. Under a local incompressibility assumption, when foam cells are created, the intima volume is locally increasing. Volume changing of the wall has influence on the fluid lumen domain which means that fully coupling is achieved. A specific numerical procedures with the ALE formulation were developed for this purpose. Our current approach is concentrated more on the process on plaque initiation and intimal thickening rather than a huge plaque progression and rupture. We did not take into account smooth muscle cells proliferation in this model and this will be investigated in our future study.
structure for human data and additional different mechanisms for plaque progression, and new concept to use exact geometrical model as in the isogeometric analysis [Hughes et al 2005].
Matching computed plaque location, composition and volume progression over time with clinical observations demonstrates a potential benefit for future prediction of this vascular decease by using computer simulation.
Stress distribution of the artery wall and stent during expansion of occluded zones is analyzed. Further research will go into direction to examine whether stent deployment leads to reduction in atheroma progression downstream. Also shear stress distribution after stent deployment is presented. Optimized simulation for virtual temperature distribution for stent heating is also analyzed. It was found that maximal stent temperature around 60ºC could give the optimal temperature distribution between 44 ºC and 48 ºC for surrounding tissue. This finding is in a good agreement with experimental results [Li et al., 2005] where in this temperature range the SMCs died in apoptosis.
Извод
Формирање плака и уградња стента са утицајима загревања у
артеријама
N. Filipovic1,2, M. Radovic2,V. Isailovic2, Z. Milosevic2, D. Nikolic2, I. Saveljic2, M. Milosevic2, D. Petrovic2, M. Obradovic1, D. Krsmanovic1, E. Themis3, A. Sakellarios3, P. Siogkas3, P. Marraccini6, F. Vozzi6, N. Meunier4, Z. Teng5, D. Fotiadis3, O. Parodi6, M. Kojic2,7
1
University of Kragujevac, Kragujevac, Serbia, [email protected]
2
Bioengineering R&D Center, BioIRC, Serbia
3
University of Ioannina, Ioannina, Greece
4
University Paris Descartes, Paris, France
5
University of Cambridge, Cambridge, Great Britain
6
National Research Council Pisa, Italy
7
The Methodist Hospital Research Institute, Houston, USA
Резиме
Атеросклероза је узрок број један смртности у свету. У овом раду је описан настанак тродимензионалног компјутерског модела плака у артерији. Такође је анализирана и уградња стента и утицај расподеле температуре приликом загревања стента у крајњем положају у уградњи.
Тродимензионално струјање флуида је описано Навијер-Стоксовим једначинама и једначином континуитета. Пренос масе унутар лумена и кроз артеријски зид је спрегнуто са струјањем крви и моделирано конвективно-дифузним једначинама. Транспорт липопротеина мале густине (low density lipoproteins, LDL) у лумену крвног суда и кроз артеријски зид је спрегнуто са Кедем-Качалски једначинама. Инфламаторни процес је моделиран са три додатне реакционо-дифузне парцијално-диференцијалне једначине.Коришћена је интеракција солид-флуид за процену распореда ефективног напона. Направљена је корелација између функција раста запремине плака и смичућег напона флуида и ефективног напона у артеријском зиду.
Одабрана су два пацијента са резултатима значајног развоја плака мерених магнетном резонанцнијом. Прогресија развоја запремине плака је фитована са три различита времена, почетно стање, после три и дванаест месеци. Резултати које смо добили показују да локација плака одговара зонама малог смичућег напона. Фитовање параметера је урађено коришћењем нелинеарне методе најмањих квадрата.
Резултати показују да је максимални ефективни напон у артеријском зиду непосредно на местима где је најмања дебљина артеријског зида. Максимална температура стента приликом загревања даје оптималну температуру од 45 ºC и 48 ºC за околно ткиво и ћелије глатких мишића. Ови резултати показују да технологија загревања уграженог стента може утицати на спречавање рестенозе.
References
Burd R., Dziedzic Y.S., Xu Y., Caligiuri M.A. 1998. J. Cell Physiol., Vol.177, 137.
Chavent G (2002) Nonlinear Least Squares for Inverse Problems, Nonlinear Least Squares for Inverse Problems Theoretical Foundations and Step-by-Step Guide for Applications, Springer, second print, New York
Edelman E.R., 1998. Rogers C: Pathobiologic responses to stenting. Am J Cardiol, 81(7A), 4E-6E.
Filipovic N, Meunier N, Boynard M, Kojic M, Fotiadis D (2010) A 3D computer simulation of plaque formation and development in coronary artery. Proceedings of ASME 2010 First Global Congress on NanoEngineering for Medicine and Biology, NEMB2010, February 7-10, 2010 Houston, TX, USA
Filipovic N, Mijailovic S, Tsuda A, Kojic M (2006) An implicit algorithm within the Arbitrary Lagrangian-Eulerian formulation for solving incompressible fluid flow with large boundary motions. Comp. Meth. Appl. Mech. Eng. 195:6347-6361
Filipovic N, Rosic M, Tanaskovic I, Milosevic Z, Nikolic D, Zdravkovic N, Peulic A. Fotiadis D, Parodi O (2011) ARTreat project: Three-dimensional Numerical Simulation of Plaque Formation and Development in the Arteries. IEEE Trans Inf Technol Biomed. PMID: 21937352
Floren M.G., Gunther, R.W., Schmitz-Rode T., 2004. Noninvasive Inductive Stent heating: Alternative Approach to Prevent Instent Restenosis? Investigative Radiology, 39(5), 264-270.
Holzapfel, G. A., Sommer, G., Regitnig, P., 2004. Anisotropic mechanical properties of tissue components in human atherosclerotic plaques. Journal of Biomechanical Engineering 126, 657-665.
Hughes TJR, Cottrell JA, Bazilevs Y (2005) Isogeometric analysis: CAD, finite elements, NURBS, exact geometry and mesh refinement. Comput. Methods Appl. Mech. Engrg. 194: 4135–4195
Kastrati, A., Mehilli, J., Dirschinger, J., Pache, J., Ulm, K., Schuhlen, H., Seyfarth, M., Schmitt, C., Blasini, R., Neumann, F.J., Schomig, A., 2001. Restenosis after coronary placement of various stent types. The American Journal of Cardiology, 87, 34-39.
Kedem O, Katchalsky A (1958) Thermodynamic analysis of the permeability of biological membranes to non-electrolytes. Biochim. Biophys 27:229–246
Kedem O, Katchalsky A (1961) A physical interpretation of the phenomenological coefficients of membrane permeability. The Journal of General Physiology 45:143–179
Kojic M, Filipovic N, Stojanovic B, Kojic N (2008) Computer Modeling in Bioengineering: Thеoretical Background, Examples and Software. John Wiley and Sons, Chichester, England
Lally, C., Dolan, F., Prendergast, P.J., 2005. Cardiovascular stent design and vessel stresses: a finite element analysis. Journal of Biomechanics 38, 1574-1581.
Levitt A. B., Robinson K., Chronos N.A.F., Daum W., 2003. External heating of stents by radio waves. Pilot studies in rabbit aorta, Cardiovascular Radiation Medicine, 1, 133-138. Li C., Zheng Y. Zhao L., 2005. Heating NiTi Stent in magnetic fields and the thermal effect on
smooth muscle cells, Key Engineering Materials 288-289, 579-582. Libby P (2002) Inflammation in atherosclerosis. Nature 868–874
Loscalzo J, Schafer AI (2003) Thrombosis and Hemorrhage. Third edition. Lippincott Williams & Wilkins, Philadelphia
Nelder J, and Mead R (1965) A simplex method for function minimization. Computer Journal 7:308-313.
Rogers, C., Edelman, E. R., 1995. Endovascular stent design dictates experimental restenosis and thrombosis. Circulation 91, 2995-3001.
Rogers, C., Tseng, D.Y., Squire, J.C., Edelman, E.R., 1999. Balloon-artery interactions during stent placement: a finite element analysis approach to pressure, compliance, and stent design as contributors to vascular injury. Circulation Research 84, 378-383.
Sadat U, Teng Z, Young VE, Zhu C, Tang TY, Graves MJ, Gillard JH (2010) Impact of plaque haemorrhage and its age on structural stresses in atherosclerotic plaques of patients with carotid artery disease: an MR imaging-based finite element simulation study. Int J Cardiovasc Imaging DOI 10.1007/s10554-010-9679-z.
Tarbell JM (2003) Mass transport in arteries and the localization of atherosclerosis. Annual Review of Biomedical Engineering 5:79–118
Yang C, Tang D and Atluri S (2010) Three-Dimensional Carotid Plaque Progression Simulation Using Meshless Generalized Finite Difference Method Based on Multi-Year MRI Patient-Tracking Data, CMES 57: 51-76
Yonezawa W, Otsuka T, Matsui N, 1996. Int. J. Cancer, 66, 347.