Cluster Analysis of Data Points using Partitioning and
Probabilistic Model-based Algorithms
Ajiboye Adeleke R.
Faculty of Computer Systems & Software Engineering Universiti Malaysia Pahang
Isah-Kebbe
Hauwau
Faculty of Computer Systems & Software Engineering Universiti Malaysia Pahang
Oladele Tinuke O
.
Dept. of Computer Science University of Ilorin
Ilorin, Nigeria
.
ABSTRACT
Exploring the dataset features through the application of clustering algorithms is a viable means by which the conceptual description of such data can be revealed for better understanding, grouping and decision making. Some clustering algorithms, especially those that are partitioned-based, clusters any data presented to them even if similar features do not present. This study explores the performance accuracies of partitioning-based algorithms and probabilistic model-based algorithm. Experiments were conducted using k-means, k-medoids and EM-algorithm. The study implements each algorithm using RapidMiner Software and the results generated was validated for correctness in accordance to the concept of external criteria method. The clusters formed revealed the capability and drawbacks of each algorithm on the data points.
General Terms
Algorithm, Clustering, Data mining
Keywords
Clustering, Algorithm, K-means, EM-clustering, K-medoids
1.
INTRODUCTION
Clustering is an important exploratory technique commonly used in descriptive data mining to unveil some hidden features embedded in the dataset. Clustering is described in [1] as an automated search for group of related observations in a data set. The concept involves the division of data into groups, also known as clusters. Although, it is well established that the similarity of objects is used for clustering, the definitions of similarity and the method employed to obtain similarity are varied [2]. The object of the same cluster shares some features, and from a machine learning perspective, clusters correspond to hidden patterns [3]. The clustering algorithm automatically supplies clusters found in data with a conceptual description and according to [4], a good conceptual description can be used for better understanding and better decision. K-means and k-medoids are the most widely used clustering algorithms for selecting group of objects from data sets [5].
Traditionally, clustering techniques are broadly divided into hierarchical and partitioning [3], the notion used in both techniques to cluster data defers. Clustering may also be density or grid-based, while hierarchical algorithm does its grouping as crystals grows, partitioning algorithms learn
Clustering is an unsupervised learning technique and unlike classification and regression, which analyse class-labelled data sets, clusteringanalyses data objects without consulting class labels [6]. It can therefore be used to generate class labels for a group of data. Many similarities exist between data mining and machine learning, but while machine learning research often focuses on the accuracy of the model, data mining research in addition to accuracy places strong emphasis on the efficiency and scalability of mining methods for large data sets; and ways to handle complex types of data and to explore new, alternative methods [6].
This study focuses on comparing the performance accuracies of partitioning-based clustering algorithms and probabilistic model-based clustering of the dataset being explored. The paper is organized as follows: In the next section, some related works reported in the literature on the implementation of these partitioning algorithms and probabilistic model-based clustering is discussed. In section 3, the basic concepts of each algorithm is briefly discussed; while the processes involved in experimenting with the data is reported in section 4. The experimental results is represented and discussed in section 5 and the study is concluded in section 6.
2.
RELATED WORK
A partitioning-based algorithm such as k-means has been widely reported in the literature for the clustering of data. Specifically, the algorithm is well known for clustering of data such as images [7], video object segmentation [8], document clustering [9] etc. However, one of the drawbacks of the algorithm is its challenges of grouping categorical variables; k-means can only cluster numeric values. The algorithm is sensitive to outliers because such objects are far away from the majority of the data, and thus, when assigned to a cluster, they can dramatically distort the mean value of the cluster [6]. To overcome this challenge, algorithm to address the shortcomings is proposed in [8]. Although, several existing algorithms can handle both numeric and categorical data, Huang[8], opined that most of them are not efficient when dealing with large datasets. In a study proposed in [10], k-means is used to generate class labels; the algorithm was combined with linear discriminant analysis approach to adaptively select the most discriminating subspace.
such as the problem of finding natural clusters, the dependency of output on the order of input data, etc. Due to too much time consumed while k-medoids is dealing with very large dataset, the algorithm was scaled in [13] to enhance its performance.
In order to improve the quality of solutions and speed, EM algorithm was enhanced in a study proposed in [14] to cluster large data sets having high dimension. The algorithm is also proposed in [15] for clustering of spatial data. In segmentation of images proposed in [16], the EM algorithm estimates the parameters of the model which provide segmentation of the image into regions, the resulting output produces a description of each region’s colour and texture characteristics.
3.
PARTITIONING AND
PROBABILISTIC MODEL-BASED
ALGORITHMS
Descriptive algorithms describe features in the dataset based on certain notions. Typical algorithms in this category include: partitioning-based, density-based, grid-based, hierarchical etc. Generally, partitioning-based algorithm finds the partitions or the resulting clusters that minimize either intra-cluster distances or inter-cluster distances. Given a set of
n objects, a partitioning method constructs k partitions of the data, where each partition represents a cluster and k ≤ n; and most partitioning methods are distance-based [6].
3.1
k-Means
Suppose a data set, D, contains n objects in Euclidean space, partitioning methods distribute the objects in D into k clusters, C1…, Ck, Ci
D and Ci
Cj =
for (1
i, j
k).K-means method can only be applied when the mean of a set of objects is defined [6]. A centroid-based partitioning technique uses the centroid of a cluster, Ci to represent that cluster. The
centroid can be defined in various ways, such as by the mean or method of the objects assigned to the cluster. The difference between an object p
Ci
and ci, the representativeof the cluster, is measured by dist(p, ci), where dist(x, y) is the
Euclidean distance between two points x and y. The sum of squared error that measures the quality of cluster between all objects in Ci and centroid ci, can be defined as:
E
=
21
)
,
(
k i n C p i ic
p
dist
(
1)
where E is the sum of squared error for all objects in the data set; p is the point in space representing a given object; and ci is
the centroid of cluster Ci . The time complexity of the
k-means algorithm is O(nkt), where n is the total number of objects, k is the number of clusters, and t is the number of iterations [6].
3.2
EM-algorithm
In many applications, probabilistic model-based clustering has been shown to be effective, this learning algorithm starts with an initial set of parameters and iterates until the clustering cannot be improved. Generally, the EM- algorithm may not
converge to the optimal solution [6]. However, many heuristics have been explored to this situation, most especially by running EM process multiple times using different random initial values. The EM algorithm has two steps: an expectation step and a maximization step; the initial expectation step guesses what the parameters are using pseudo-random numbers. In the maximization step, the mean and variance is used to re-estimate the parameters continually until they converge to a local maximum [17]. Expectation step assigns objects according to the parameters of probabilistic clusters, while maximization step finds the new clustering or expected likelihood in probabilistic model-based clustering [6].
3.3
k-Medoids
This algorithm is an extension of k-means paradigm; it clusters categorical data as it uses a simple matching dissimilarity measure for categorical objects [18]. Instead of taking the mean value of the objects in a cluster as a reference point, the actual objects can be picked to represent the clusters, using one representative object per cluster. Each remaining object is assigned to the cluster of which the representative object is the most similar. The partitioning method is then performed based on the principle of minimizing the sum of dissimilarities between each object p
and its corresponding representative object. This is the basis for the k-medoids method, which groups n objects into k
clusters by minimizing the absolute error criterion[6], which can be defined as:
E
=
(
,
)
1
k
i p c
i i
o
p
dist
(
2)
where E is the sum of the absolute error for all objects p in the dataset, and oi is the representative object of ci.
4.
EXPERIMENTATIONS
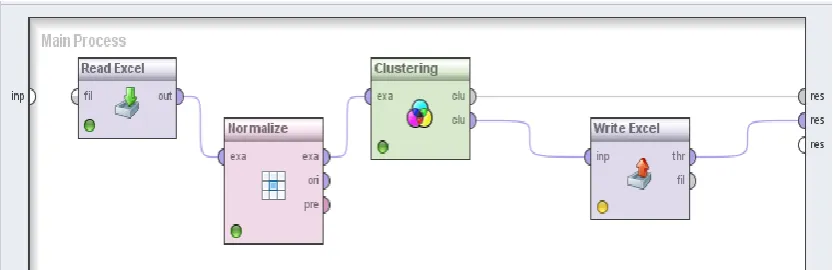
This study experiments on excerpts of the dataset retrieved from an open repository of the World Bank [21]. The data reflect the cross-country information for Sector Investment and Capital in the year 2000. Experiment in the proposed study is carried out in the RapidMiner Software environment to describe the features in the data that form the basis for the grouping. The data has three attributes: GDP per capital, urban population and surface area. The target grouping is Income (low, medium, high).
The three partition algorithms used in this study are represented in Table 1. While k-means measures the Euclidean distance of the data points, k-medoids measures the mixed Euclidean distance of the data points in order to handle string values and with EM-algorithm, data points are
Fig. 1 Experimental setup
Table 1: Parameter settings for the algorithms
Algorithms Number of
clusters
Max. runs Dataset
Normalization
Numerical measure
Max optimization
K-means 3 10 z-transform Euclidean
distance
100
EM-Clustering 3 10 z-transform Assign values
randomly
100
K-medoids 3 10 z-transform Mixed
Euclidean
100
The dataset is normalized in order to express the attributes in smaller units and according to [6], normalized data give attribute greater effect. Normalized and standardized involves transforming the data to fall within small or common range such as [-1, 1] or [0.0, 1.0]. Z-score normalization is a data standardization method that normalized attribute values based on the mean and standard deviation of the attributes values. A value,
x
i of A isnormalized to
x
i 1by computing:
A i i
A X X
1
(3)
A variation of z-score normalization replaces the standard deviation in (3) by the mean absolute deviation of A. Thus, z-score normalization using the mean absolute deviation is:
A i i
S
A X X
1
(4)
where A and
Aare the mean and standard deviation, respectively, of attribute A.The mean absolute deviation, SA, is more robust to outliers
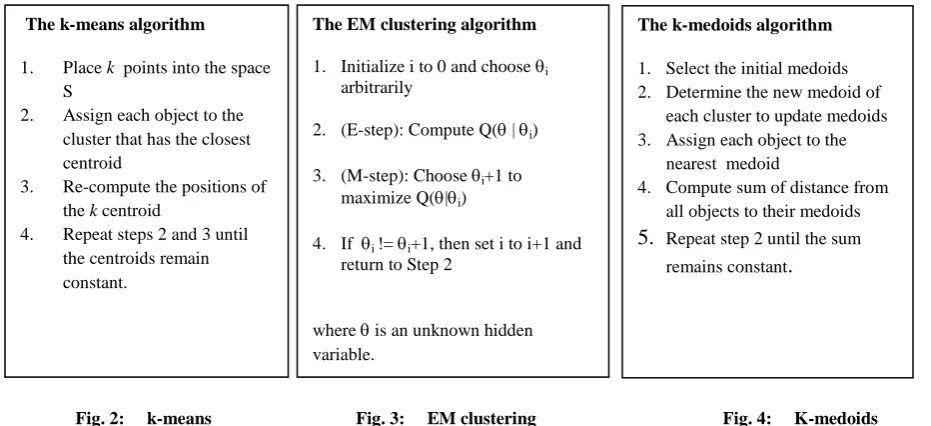
The clustering of data using k-means, EM-algorithm and K-medoids conforms to figures 1, 2 and 3 respectively:
Fig. 2: k-means Fig. 3: EM clustering Fig. 4: K-medoids
Input: k: the number of clusters; S: a data set containing n objects
Output: A set of k clusters
5.
EXPERIMENTAL RESULTS AND
DISCUSSION
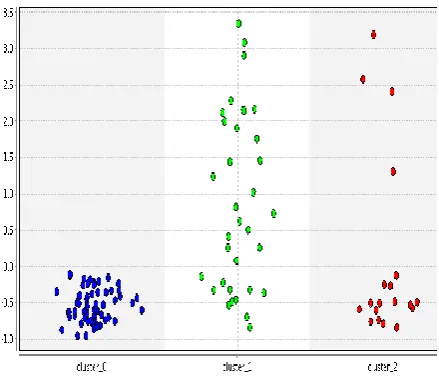
This study experiment with two partitioning-based algorithms and a probabilistic model-based algorithm, the clusters formed are shown in Figures 5, 6, and 7. The algorithms operate under similar parameter settings as represented in Table 1. For the purpose of validation of the formed clusters, the results were exported to excel file as shown in the experimental setup in Figure 1 for further computations. The scatter plots of k-means and k-medoids looks much alike and comparing their results to the class-label of the original data being analysed, each has 61% and 62% accuracy respectively as displayed in Table 2. The EM-algorithm shows a different result entirely and the comparisons show that it is 51.8% accurate. In general, the three algorithms are very fast, while k-means remain the fastest among them.
Fig. 6: Scatter plot using k-Medoids algorithm
Table 2: Performance accuracy of each algorithm on the dataset
Algorithm Accuracy
k-means 61%
k-medoids 62%
EM-clustering 51.8%
The k-means algorithm
1. Place k points into the space S
2. Assign each object to the cluster that has the closest centroid
3. Re-compute the positions of the k centroid
4. Repeat steps 2 and 3 until the centroids remain constant.
The EM clustering algorithm
1. Initialize i to 0 and choose i
arbitrarily
2. (E-step): Compute Q( | i)
3. (M-step): Choose i+1 to
maximize Q(|i)
4. If i != i+1, then set i to i+1 and
return to Step 2
where is an unknown hidden variable.
The k-medoids algorithm
1. Select the initial medoids 2. Determine the new medoid of
each cluster to update medoids 3. Assign each object to the
nearest medoid
4. Compute sum of distance from all objects to their medoids
5.
Repeat step 2 until the sum remains constant.
Fig. 7: Scatter plot using EM algorithm
Given a set X, the true representative of the set X [19], is a representative set of clustering Centroids C1, ..., Ck if |X|
.
C
i As reported in [20], the class of an object cannot be predicted by a clustering algorithm, but it may be estimated by examining the clustering result for the class-label data. In order to determine the accuracy of the clusters formed, the class-label of the original data set is mapped to each cluster and the percentage accuracy is determined based on (5).S = Sample correctly mapped to the class-label in each cluster
ST =Total number of sample data in each cluster
Accuracy =
k
n
S
TS
1
x 100 (5)
where k = 3
6.
CONCLUSION
In this paper, the performance of some partitioning-based clustering algorithms and probabilistic model-based algorithm, namely: k-means, k-medoids and EM-algorithm on structured data are explored with a view to revealing how accurate each algorithm could perform in grouping the dataset. The experimental results are compared to the class-label of the original data and the performance accuracy of each algorithm displayed in table 2 shows that, k-means and k-medoids are more efficient than EM-algorithm in the clustering of data points. While k-means appear to be the fastest among the three algorithms and is known for its excellent performance on large data, the algorithm however requires that, the value of k be continuously varied to get a cluster of good quality.
REFERENCES
[1] D. Napoleon and P. G. Lakshmi, "An efficient K-Means clustering algorithm for reducing time complexity using
Information Sciences & Computing (TISC), 2010, pp. 42-45.
[2] S. C. Suh, Practical Applications of Data Mining: Jones & Barlett Learning, LLC 2012.
[3] P. Berkhin, "A survey of clustering data mining techniques," in Grouping multidimensional data, ed: Springer, 2006, pp. 25-71.
[4] B. Mirkin, Clustering: A Data Recovery Approach: CRC Press, 2012.
[5] G. M. Daiyan, F. Abid, M. Khan, and A. H. Tareq, "An efficient grid algorithm for faster clustering using K medoids approach," in Computer and Information Technology (ICCIT), 2012 15th International Conference on, 2012, pp. 1-3.
[6] J. Han, M. Kamber, and J. Pei, DATA MINING Concepts and Techniques: Morgan Kaufmann, 3rd Edition, 2012. [7] C.-H. Lin, C.-C. Chen, H.-L. Lee, and J.-R. Liao, "Fast
K-means algorithm based on a level histogram for image retrieval," Expert Systems with Applications, vol. 41, pp. 3276-3283, 2014.
[8] Z. Huang, "Extensions to the k-means algorithm for clustering large data sets with categorical values," Data Mining and Knowledge Discovery, vol. 2, pp. 283-304, 1998.
[9] R. Forsati, M. Mahdavi, M. Shamsfard, and M. Reza Meybodi, "Efficient stochastic algorithms for document clustering," Information Sciences, vol. 220, pp. 269-291, 2013.
[10] C. Ding and T. Li, "Adaptive dimension reduction using discriminant analysis and k-means clustering," in
Proceedings of the 24th international conference on Machine learning, 2007, pp. 521-528.
[11] A. P. Reynolds, G. Richards, and V. J. Rayward-Smith, "The application of k-medoids and pam to the clustering of rules," in Intelligent Data Engineering and Automated Learning–IDEAL 2004, ed: Springer, 2004, pp. 173-178. [12] S. M. Razavi Zadegan, M. Mirzaie, and F. Sadoughi,
"Ranked< i> k</i>-medoids: A fast and accurate rank-based partitioning algorithm for clustering large datasets," Knowledge-Based Systems, vol. 39, pp. 133-143, 2013.
[13] R. Joshi, A. Patidar, and S. Mishra, "Scaling k-medoid algorithm for clustering large categorical dataset and its performance analysis," in Electronics Computer Technology (ICECT), 2011 3rd International Conference on, 2011, pp. 117-121.
[14] C. Ordonez and E. Omiecinski, "FREM: fast and robust EM clustering for large data sets," in Proceedings of the eleventh international conference on Information and knowledge management, 2002, pp. 590-599.
[15] C. Ambroise, M. Dang, and G. Govaert, "Clustering of spatial data by the EM algorithm," in geoENV I— Geostatistics for environmental applications, ed: Springer, 1997, pp. 493-504.
Pattern Analysis and Machine Intelligence, IEEE Transactions on, vol. 24, pp. 1026-1038, 2002.
[17] J. Erman, M. Arlitt, and A. Mahanti, "Traffic classification using clustering algorithms," in
Proceedings of the 2006 SIGCOMM workshop on Mining network data, 2006, pp. 281-286.
[18] L. R. Kaufman and P. Rousseeuw, "Finding groups in data: An introduction to cluster analysis," Hoboken NJ John Wiley & Sons Inc, 1990.
[19] S. Ben-David and M. Ackerman, "Measures of clustering quality: A working set of axioms for clustering," in
Advances in neural information processing systems, 2009, pp. 121-128.
[20] H.-S. Park and C.-H. Jun, "A simple and fast algorithm for K-medoids clustering," Expert Systems with Applications, vol. 36, pp. 3336-3341, 2009.
[21] A Cross-country Database for Sector Investment and Capital – An open repository of the World Bank: