*Corresponding author’s e-mail: [email protected]
Statistical Analysis of Graphene Layer on Gold-based
Surface Plasmon Resonance-Kretschmann
Configuration using FDTD and Taguchi Method
Nur Akmar Jamil1, P. Susthitha Menon1∗, Z.A. Noor Faizah1 and P.R. Apte2
1Institute of Microengineering and Nanoelectronics (IMEN),
Universiti Kebangsaan Malaysia (UKM) 43600 Bangi, Selangor, Malaysia
2Indian Institute of Technology(IIT), Powai, Mumbai, India
Accurate screening methods have significant implications for kidney health. While the existing methods for identifying specifics samples are often inaccurate and time-consuming, the need for sensitive and precise biosensor is highly demanded. The development of sensors for commonly clinical biomarkers, if properly optimized, can help to address the problem. Here, the optimum design of surface plasmon resonance (SPR) which is recommended by the L9 Taguchi method was reported. In order to achieve the smallest possible full-width-at-half- maximum (FWHM) and the reflectance intensity (Rmin), four input parameters which include the wavelength (λ) and the thickness of three other parameters; Chromium (Cr), Gold (Au) and graphene were varied for the optimization purposes. The SPR biosensor was designed using the Kretschmann configuration through the Lumerical Finite-Difference-Time-Domain (FDTD) simulator. Taguchi method reveals that wavelength parameter holds a significant effect on the device performance. Upon optimization, the FWHM and Rmin show an improvement to the device's sensitivity as much as 5.37% and 38.93% respectively.
Keywords: ANOVA, FDTD, Kretschmann Configuration, L9 Taguchi, Surface Plasmon Resonance
I. INTRODUCTION
Technological advances are growing rapidly but dragging human life towards destruction. Increased youth generation with chronic illness proves that a healthy lifestyle is no longer a priority. Chronic kidney disease (CKD) which is caused by the scarce albumin is one of the major contributors to health problems with global prevalence around 10-26% (Chaudhari,
et al., 2017; Menon et al., 2018; Menon et al., 2019a). In 2014,
Malaysia has shown a growth rate as much as 56.4% patients that are diagnosed with CKD where the data gathered are within the 10 years of period (Bujang et al., 2017; Rizal et al., 2017). The number of patients with CKD is also forecasted to be increased by twofold in 2040 if it is not properly controlled. This disquieting phenomenon has made Malaysia now as the top seventh country with the highest number of dialysis
11 compulsory and hence spike the total cost of the biosensor (Swati et al., 2010; Chaudhari et al., 2017). For that reason, a precise and cost-effective urea biosensor is very critical to make medical costs affordable to every community.
The surface plasmon resonance (SPR) was introduced and recent studies focus on various types of surface plasmon resonance (SPR) biosensor design for sensing purposes like hazardous gaseous (Prabhash et al., 2017), heavy metal ions (Wu & Lin, 2005), drug molecules (Pernites et al., 2011), and immune-sensing (Ashley et al., 2017). Urea sensing also was extensively explored in various technological topologies using SPR-based sensor (Dindar et al., 2011; Verma & Gupta, 2014). Compared to other methods, the SPR biosensor has exceptional capabilities where it is a fast-optical and label-free detection tool for refractive index deviations at a very close area of a thin metal layer (Nguyen et al., 2015; Gan et al., 2019). Kretschmann configuration has been utilized preeminently in the SPR system, which principally includes an analyte sensing surface, a prism and a glass slide with a thin metal film where the plasmon filed is excited (Jamil et al., 2017a). Technically, when a plane‐polarized light beam passes through the prism, total internal reflection (TIR) will occur and an evanescent wave (EW) is formed at a certain critical angle of incident angle (Tarumaraja et al., 2016; Said et al., 2015a). This happens due to the energy from the incident light being transfer onto the surface plasmons (Menon et al., 2019b). A significant decline in the reflectivity and a sharp dip was forms in the SPR response curves demonstrate the minimum reflectivity based on the TIR at the metal-dielectric interface (Said et al., 2016). The existence of the analyte in the sample can be seen through the shifting mode in the incident angle or through the optical wavelength since the SPR are sensitive to the variations of the refractive index on the sensing surface layer (Jamil et al., 2017b). The performance of SPR biosensor is at optimum when it has the highest sensitivity, selectivity and long-term stability of metal and sensing (Jamil
et al., 2018a).
These works are the extension studies from our previous work in (Jamil et al., 2018b). Here, we optimize the Kretschmann SPR-based sensor using the L9 orthogonal array (OA) of the Taguchi method (Siew Mei et al., 2018). The numerical simulation was initially designed using the Lumerical finite-domain-time-domain analysis (FDTD)-based simulators (FDTD Solutions | Lumerical’s Nanophotonic
FDTD Simulation Software). Numerous works prove that the
optimizations using Taguchi in designing the experiments are cost-effective which agrees with the purpose of these works to
find the best recipe of process parameters in achieving the smallest possible full-width-at-half- maximum (FWHM) and reflectance intensity (Rmin) at a lower cost without scarifying the accuracy of the device (A et al., 2016; Mitra
et al., 2016). Taguchi effectively concludes the best
combination of control factors through the analysis of variance (ANOVA) and Signal-to-Noise ratio (SNR) analysis (Lee, Lin & Yen, 2017; Tarumaraja et al., 2019). In order to attain the smallest possible FWHM and Rmin, Smaller-the-Better (STB) of Taguchi’s quality characteristic was utilized so that the sensitivity and accuracy of the device can be increased. In this work, four critical parameters were selected to be varied at three levels. The parameters include the wavelengths (λ), the thickness of chromium (TCr), the thickness of the gold layer (TAu), and the thickness of graphene layers (TGraphene). The efficacy of the Taguchi method can be seen through the increased percentage of device performance after the optimization process takes place.
II. MATERIALS AND METHOD
The design and analysis phases of a virtual SPR-based
biosensor using the Lumerical’s FDTD Solutions software
follows as in (Jamil et al., 2018b; Jamil et al., 2018c)
except the utilization of different analyte and variations in
input parameters for device optimization. Initially, the
biosensor is formed in the high optical solver environment
for capturing light interaction with the anticipated
wavelength scale. Accurate setting and conformal
meshing using a mesh override region are essential to
simulate the plasmonic structures of metal geometries
(Said et al., 2017). Then, the optical parameter is
established to design the biosensor. Here, the plane-wave
source is set as a Bloch (periodic type) at a desired optical
wavelength (Jamil et al., 2018a). In order to find the
source angle (θ) which is capable to excite the SPR mode,
a parameter is engulfed within 36 to 80 of the incident
angle (Said et al., 2015b).
A. Numerical Modeling
12 the development of SPR biosensor includes four main components; BK7 glass, chromium layer (Cr), gold layer (Au) and the graphene layer. Note that, all related values of the refractive index and the extinction coefficient for the glass and chromium layer are obtained from the Bionavis Navi SPR database (Mohamad et al., 2019). The complex refractive index of the gold layer is listed in Table 1. The data are measured at three optical wavelengths that excite the SPR mode; 632.8 nm, 670 nm and 785 nm. The thickness of the graphene in this work is determined by the formula L × 0.34 nm, where L is the number of graphene layers. The complex refractive index of graphene in visible light is given by:
𝑛 = 3 + 𝑖
𝐶
3
(1)
where C is the value of the constant implied by the opacity
measurement (C = 5.446 µm-1) and 𝜆 is the optical wavelength.
Figure 1. The XY, XZ and YZ view of simulated FDTD
diagrams for SPR biosensor-based graphene using
Kretschmann (Said et al., 2015c)
Table 1. The complex refractive index of a gold layer
B. Taguchi Orthogonal L9 Array Method
In L9 Taguchi method, the variations of process parameters in
findings the best combination of factors level are used to
achieve the optimal device performance at a smaller number of
experiments. A total of nine experiments each for Rmin and
FWHM were simulated in this work considering of four process
factors known as factor A (wavelength, λ), factor B
(chromium thickness, TCr), factor C (gold thickness, TAu)
and factor D (graphene layer thickness, TGraphene). These
factors are varied at three levels in order to find the
optimum value that can reduce the Rmin and FWHM. The
process factors and their respective level values are listed in
Table 2.
Table 2. Factors and levels
Since the aim of the experiments is to have the lowest
output of Rmin and FWHM, the device is optimized using
the Taguchi’s Smaller-the-Better (STB) quality
characteristics. The layout of the experiment can be seen in
previous works (Jamil et al., 2019). The Signal-to-Noise
ratio (SNR) of STB characteristic (𝜂STB) and the analysis of
variance (ANOVA) for Rmin and FWHM are calculated
once the simulations are completed. The 𝜂STB is defined as
in equation (2) where n is the number of experiment and yi
is the simulation result for Rmin and FWHM (Tseng et al., 2013).
𝜂
𝑆𝑇𝐵= −10 log
(
1
𝑛
∑
𝑦
𝑖2 𝑛
𝑖=1
)
(2)
III. RESULTS AND
DISCUSSION
The analysis of the virtual graphene-based SPR using the Lumerical FDTD software was first benchmarked with the
experimental result. This is to confirm the efficacy of the
virtual device before it is optimized. From the result, the
virtual device demonstrates a good agreement with the
experimental output data. This can be seen in Figure 2
13 incident angle of ≈45° can be seen at both numerical and
experimental reflectance curve in the same simulation
environment; 50 nm Au/Graphene on BK7 at 670 nm
wavelength in the dielectric medium air. The reflectance
intensity difference between the curves was less than 5%. The
red colour curve represents the experimental result and the
blue curve represent the numerical result.
Figure 2. SPR curve of 50nm Au-Graphene based SPR
biosensor at wavelength 670 nm
A. Analysis of Graphene-based Surface Plasmon Resonance Sensor
The signal-to-noise ratio (SNR) of smaller-the-better (STB) L9
Taguchi quality characteristic was utilized to improve the
sensitivity of the biosensor by reducing the FWHM and Rmin value. Four process factors which include the wavelength (λ),
chromium thickness (TCr), gold thickness (TAu) and graphene
layer thickness (TGraphene) were varied at three levels making the
total of nine experiments required to find the best combination
of process factor's level for optimum device performance.
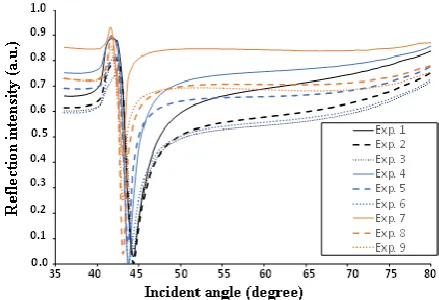
Figure 3 shows the reflectance curves of nine experiments
established by L9 Taguchi method while the simulation results
of Rmin and FWHM are listed in Table 3. From the figure, it
can be seen that the wavelength escalates as the slopes of
reflectivity shifted to a lower angle. The narrowest curves
happen at experiment number 7, 8 and 9 when the wavelength
is set constant at 785 nm. This explains that the results of
FWHM were also the lowest at these levels. The result of
FHWM at experiment number 7, 8 and 9 is 1.254°, 1.4746°, and
1.4076° respectively. Rmin, on the other hand, has the lowest
result at experiment number 1, 2 and 4 with the value of
0.0131, 0.0122 and 0.0047 respectively.
Figure 3. Reflectance curve of SPR biosensor-based
graphene for Taguchi analysis
Table 3. FWHM and Rmin results
B.Signal-to-Noise Ratio (SNR) and ANOVA Results
The SNR was measured right after the simulations of the
nine experiments were completed. The SNR is obtained to
study the most influence level parameters to the device
performance. Hence, the performance characteristics of the
graphene-based biosensor are at the optimum level when
the SNR value is at the highest level (Afifah Maheran et al.
2014; Yorek et al. 2018). The results of SNR for FWHM and
Rmin at each level of the experiment are tabulated in Table
4. From the table, experiment results at set number 4 and 7
give the highest SNR value for Rmin and FWHM analysis
correspondingly. Since the Taguchi method is orthogonal,
the SNR results of each level can be separated and studied.
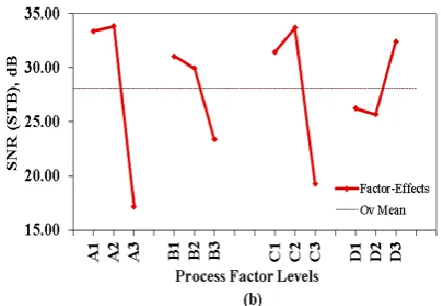
The SNR contribution at each level of process factor can be seen clearly in Table 5 and plotted as in Figure 4. The SNR
14 factors are A at level 3, B at level 2, C at level 3 and D at level 1
while the best combination factors for optimum Rmin are A at
level 2, B at level 1, C at level 2 and D at level 3. Note that the
selection of levels was based on the highest SNR value. The
greater the SNR contribution, the better the quality
characteristic of the graphene-based SPR biosensor.
Table 4. SNR analysis for FWHM and Rmin
Table 5. SNR analysis for FWHM and Rmin
Figure 4. SNR (STB) graph for a) FWHM and b)
Rmin
1. Confirmation Test
The confirmation tests were done to verify the suggested
process factors give better result after the optimization took
place. The suggested level of each factor is tabulated in
Table 6. The percentage of factor effect shown in Table 6
specified that factor A is the dominant factor for both
FWHM and Rmin. This means that any changes made to
factor A will affect the device performance significantly.
Therefore, selection of a proper optical wavelength to excite
the device is vital for designing a sensitive SPR-based
biosensor as compared to other process factors. Final
results of FWHM and Rmin are shown in Table 7. The
FWHM was improved by 5.37% after the optimization while
Rmin was improved by almost 40%. However, both output
parameters did not share the same combination of the
optimum factor's level. This means that the finest
combination of factors for the lowest possible FWHM does
not signify the lowest Rmin and vice versa. Hence, an
additional simulation was done to find the trade-off
between the FWHM and Rmin. Both factor effects were
then compared and the new level of factors was selected
based on the highest percentage of factor effect.
Consequently, both performance parameters are reduced
and identified using the same optimized process factors.
The final results of combined factors (FWHM x Rmin),
A3B1C2D3 gives the FWHM value of 0.8602° which is
further reduced as compared to the individual optimization.
However, the result of the combined factor for Rmin
15 Table 6. Optimum factor combination for FWHM and
Rmin
Table 7. Predicted and confirmation results of FWHM
and Rmin
IV. CONCLUSION
The optimization of process factors for the lowest possible
FWHM and Rmin was successfully completed. This work
proves that proper selection of the design factors is very
crucial in designing the finest SPR biosensor. The lowest
possible FWHM and the bigger reflection spectra are desired
in the SPR biosensor because a narrower and deeper
resonance peak allows detecting the resonance shift
effectively. We found that the optical wavelength has the most
substantial effect to both FWHM and Rmin which also justify
that the prediction made by the Taguchi method is
indisputable. The optimization using Taguchi method prior
to fabrication delivers a methodology with lessening time and
cost besides providing an understanding of the effect of
process factors on the device performance.
V. ACKNOWLEDGMENT
This work was funded by Universiti Kebangsaan Malaysia
(UKM) with Grant no. DIP-2016-022 and GUP-2016-062.
The use of computational and experimental sources was
supported by the Institute of Microengineering and
Nanoelectronics (IMEN), UKM, Kulim Hi-Tech Sdn Bhd and
Bionavis Ltd.
VI. REFERENCES
A, NFZ, Ahmad, I, Ker, PJ, Y, SM, R, MF, Mah, SK &
Menon, PS 2016, ‘Statistical modelling of 14nm
N-Types MOSFET’, Journal of Telecommunication,
Electronic and Computer Engineering, vol. 8, no. 4, pp. 91–95.
Ashley, J, Piekarska, M, Segers, C, Trinh, L, Rodgers, T,
Willey, R & Tothill, IE 2017, ‘An SPR based sensor for
allergens detection’, Biosensors and Bioelectronics,
vol. 88, pp. 109–113.
Bujang, MA, Adnan, TH, Hashim, NH, Mohan, K, Liong, AK, Ahmad, G, Leong, GB, Bavanandan, S & Haniff, J
2017, ‘Forecasting the incidence and prevalence of
patients with end-stage renal disease in malaysia up to the year 2040’, International Journal of Nephrology, vol. 2017.
Chaudhari, R, Joshi, A & Srivastava, R 2017, ‘pH and
Urea Estimation in Urine Samples using Single Fluorophore and Ratiometric Fluorescent
Biosensors’, Scientific Reports , pp. 1–9.
Dindar, B, Karaku, E & Abas, F 2011, ‘New urea
biosensor based on urease enzyme obtained from helycobacter pylori’, Applied Biochemistry and Biotechnology, vol. 165, no. 5–6, pp. 1308–1321.
‘FDTD Solutions | Lumerical’s Nanophotonic FDTD
Simulation Software’, accessed February 26, 2018. Gan, SM, Menon, PS, Mohamad, NR, Jamil, NA &
Majlis, BY 2019, ‘FDTD simulation of Kretschmann
based Cr-Ag-ITO SPR for refractive index sensor’,
16 Mei, GS & Majlis, BY 2017a, ‘Graphene-based surface plasmon resonance urea biosensor using Kretschmann
configuration’, in Proceedings of the 2017 IEEE
Regional Symposium on Micro and Nanoelectronics, RSM 2017, pp. 112-115.
Jamil, NAB, Menon, PS, Mei, GS, Shaari, S & Majlis, BY
2017b, ‘Urea biosensor utilizing graphene-MoS2 and
Kretschmann-based SPR’, in IEEE Region 10 Annual Proceedings/TENCON, pp. 1973-1977.
Jamil, NA, Menon, PS, Shaari, S, Mohamed, MA & Majils, BY 2018a, ‘Taguchi optimization of surface
plasmon resonance-kretschmann biosensor using
FDTD’, in IEEE International Conference on
Semiconductor Electronics, Proceedings, ICSE, pp. 65-68
Jamil, NA, Mei, GS, Khairulazdan, NB, Thiagarajah, SP, Hamzah, AA, Majlis, BY & Menon, PS 2018b,
‘Detection of Uric Acid Using Kretschmann-based SPR
Biosensor with MoS2-Graphene’, in 2018 IEEE Student Conference on Research and Development (SCOReD), IEEE, pp. 1–4.
Jamil, NA, Susthitha Menon, P, Mei, GS & Majlis, BY 2018c, ‘Sensitivity enhancement of urea biosensor
based on surface plasmon resonance and kretschmann configuration with graphene-MoS2 hybrid structure’,
Sains Malaysiana, vol. 47, no. 5, pp. 1033–1038 Jamil, NA, Khairulazdan, NB, Menon, PS, Md Zain, AR,
Hamzah, AA & Majlis, BY 2019, “Graphene-MoS2
SPR-based biosensor for urea detection,” ISESD 2018 -
International Symposium on Electronics and Smart Devices: Smart Devices for Big Data Analytic and Machine Learning, art. no. 8605491.
Kaushik, A, Solanki, PR, Ansari, AA, Sumana, G, Ahmad,
S & Malhotra, BD 2009, ‘Iron oxide-chitosan
nanobiocomposite for urea sensor’, Sensors and
Actuators B: Chemical, vol. 138, pp. 572–580.
Lee, BS, Lin, DZ & Yen, TJ 2017, ‘A low-cost,
highly-stable surface enhanced raman scattering substrate by si nanowire arrays decorated with au nanoparticles and
Au backplate’, Scientific Reports, vol. 7, no. 1, pp. 1–7.
Lee, W, Kim, S, Kim, T, Lee, KS, Shin, M & Park, J 2000,
‘Sol – gel-derived thick-film conductometric biosensor
for urea determination in serum’, Analytica
Chimica Acta, vol. 404, pp. 195–203.
Luo, Y & Do, J 2004, ‘Urea biosensor based on PANi
( urease ) -Nafion ® / Au composite electrode’,
Biosensors and Bioelectronic, vol. 20, no. June 2003, pp. 15–23.
Menon, PS, Said, FA, Mei, GS, Berhanuddin, DD,
Umar, AA, Shaari, S & Majlis, BY 2018, ‘Urea and
creatinine detection on nano-laminated gold thin lm using Kretschmann-based surface plasmon
resonance biosensor’, PLOS ONE, pp. 1–9.
Menon, PS, Said, FA, Gan, SM, Mohamed, MA, Zain, ARM, Shaari, S & Majlis, BY 2019a, ‘High Sensitivity
Urea Biosensor using Urease enzyme and Au-based
Kretschmann Surface Plasmon Resonance’, Sains
Malaysiana, vol. 48, no. 6, pp. 1179–1185.
Menon, PS, Mulyanti, B, Jamil, NA, Wulandari, C, Nugruho, HS, Gan, SM, Abidin, NFZ, Hasanah, L, Pawananto, RE & Berhanuddin, DD 2019b,
‘Sensitivity enhancement of urea biosensor based
on surface plasmon resonance and kretschmann configuration with graphene-MoS2 hybrid
structure’, Sains Malaysiana, vol. 48, no. 6, pp.
1259–1265.
Mitra, AC, Jawarkar, M, Soni, T & Kiranchand, GR
2016, ‘Implementation of Taguchi Method for
Robust Suspension Design’, in Procedia
Engineering.
Mohamad, NR, Mei, GS, Jamil, NA, Majlis, B &
Menon, PS 2019, ‘Influence of ultrathin chromium
adhesion layer on different metal thicknesses of
SPR-based sensor using FDTD’, Materials Today:
Proceedings, vol. 7, pp. 732–737.
Nguyen, HH, Park, J, Kang, S & Kim, M 2015, ‘Surface
plasmon resonance: A versatile technique for
biosensor applications’, Sensors (Switzerland), vol.
15, no. 5.
Pernites, R, Ponnapati, R, Felipe, MJ & Advincula, R
2011, ‘Biosensors and Bioelectronics
17
carbazole electroactive monomers’, Biosensors and
Bioelectronics, vol. 26, no. 5, pp. 2766–2771.
Prabhash, PG, Haritha, VS, Nair, SS & Pilankatta, R
2017, ‘Sensors and Actuators B : Chemical localized
surface plasmon resonance based highly sensitive room temperature pH sensor for detection and quantification
of ammonia’, Sensors & Actuators: B. Chemical, vol.
240, pp. 580–585.
Rizal, M, Manaf, A, Surendra, NK, Halim, A, Gafor, A,
Hooi, LS & Bavanandan, S 2017, ‘Dialysis provision and
implications of health economics on peritoneal dialysis utilization : a review from a Malaysian perspective’,
International Journal of Nephrology, vol. 2017, pp. 1–
7.
Said, FA, Menon, PS, Shaari, S & Majlis, BY 2015a,
‘FDTD Analysis on Geometrical Parameters of Bimetallic Localized Surface Plasmon Resonance-Based Sensor’, in 2015 6th International Conference on Intelligent Systems, Modelling and Simulation (ISMS), pp. 242–245.
Said, FA, Menon, PS, Kalaivani, T, Mohamed, MA, Abedini, A, Shaari, S, Majlis, BY & Retnasamy, V 2015b,
‘FDTD analysis of structured metallic nanohole films
for LSPR-based biosensor’, in 2015 IEEE Regional Symposium on Micro and Nanoelectronics (RSM), IEEE, pp. 1–4.
Said, FA, Susthitha Menon, P, Shaari, S & Majlis, BY
2015c, ‘FDTD analysis on geometrical parameters of
bimetallic localized surface plasmon resonance-based
sensor and detection of alcohol in water’, International
Journal of Simulation: Systems, Science and Technology, vol. 16, no. 4, p. 6.1-6.5.
Said, FA, Menon, PS, Nawi, MN, Md Zain, AR, Jalar, A & Majlis, BY 2016, ‘Copper-graphene SPR-based biosensor for urea detection’, in 2016 IEEE International Conference on Semiconductor Electronics (ICSE), pp. 264–267
Said, FA, Menon, PS, Rajendran, V, Shaari, S & Majlis,
BY 2017, ‘Investigation of graphene-on-metal
substrates for SPR-based sensor using finite-difference
time domain’, IET Nanobiotechnology, vol. 11, no. 8,
pp. 981–986.
Siew Mei, G, Radiah Binti Mohamad, N, Akmar Binti Jamil, N, Yeop Majlis, B & Susthitha Menon, P 2018,
‘Pengoptimuman sensor resonans plasmon
permukaan berdasarkan Kretschmann dengan kaedah Taguchi (optimization of Kretschmann based on surface plasmon resonance sensor using Taguchi method)’, Sains Malaysiana, vol. 47, no. 10, pp. 2565–2571.
Soldatkin, AP, Montoriol, J, Sant, W, Martelet, C & Jaffrezic-renault, N 2003, ‘A novel urea sensiti v e
biosensor with extended dynamic range based on recombinant urease and ISFETs’, Biosensors and Bioelectronic, vol. 19, no. 2, pp. 131–135.
Swati, M, Hase, NK & Srivastava, R 2010,
‘Nanoengineered optical urea biosensor for
estimating hemodialysis parameters in spent
dialysate’, Analytica Chimica Acta, vol. 676, no. 1–
2, pp. 68–74.
Tarumaraja, KA, Menon, PS, Said, FA, Jamil, NA, Ehsan, AA, Shaari, S, Majlis, BY & Jalar, A 2016,
‘FDTD numerical analysis of SPR sensing using
graphene-based photonic crystal’, Proceedings of IEEE International Conference on Semiconductor Electronics, pp. 79–81.
Tarumaraja, KA, Susthitha Menon, P, Majlis, Y & Apte, PR 2019, Robust design of Kretschmann plasmonic PCW-based integrated biosensor circuit,
International Journal of Nanoelectronics and Materials, vol. 12, no. 2, pp. 165-174
Tseng, K-H, Shiao, Y-F, Chang, R-F & Yeh, Y-T 2013,
‘Optimization of microwave-based heating of
cellulosic biomass using taguchi method’,
Materials, vol. 6, no. 8, pp. 3404–3419.
Verma, R & Gupta, BD 2014, ‘A novel approach for
simultaneous sensing of urea and glucose by SPR
based optical fiber multianalyte sensor.’, The
Analyst, vol. 139, no. 6, pp. 1449–55.
Wu, C & Lin, L 2005, ‘Utilization of albumin-based
sensor chips for the detection of metal content and
characterization of metal – protein interaction by
18
B: Chemical, vol. 110, no. 2, pp. 231–238.
Yorek, M, Malik, RA, Calcutt, NA & Vinik, A 2018,
‘Editorial diabetic neuropathy : new insights to early
diagnosis and treatments’, Journal of Diabetes