*Corresponding author’s e-mail: [email protected] https://doi.org/10.32802/asmscj.2019.215
Validation of HPLC and Liquid-Liquid Extraction
Methods for Warfarin Detection in Human
Plasma and its Application to a
Pharmacokinetics Study
Yung An Chua1*, Wan Zaidah Abdullah2, Zurkurnai Yusof3 and Siew Hua Gan4 1Department of Pharmacology, School of Medical Science, Universiti Sains Malaysia,
16150 Kubang Kerian, Kelantan, Malaysia
2Department of Hematology, School of Medical Science, Universiti Sains Malaysia,
16150 Kubang Kerian, Kelantan, Malaysia
3
Department of Medicine, School of Medical Science, Universiti Sains Malaysia,
16150 Kubang Kerian, Kelantan, Malaysia
4School of Pharmacy, Monash University Malaysia, 47500 Bandar Sunway,
Selangor Darul Ehsan, Malaysia
A reversed-phase HPLC method to determine total plasma warfarin was developed and validated. Warfarin was extracted from human plasma using a two-step liquid-liquid extraction method. The residue was reconstituted with a phenylbutazone standard solution, which was used as the internal standard. The analytical column was a Purospher STAR RP-18e (4 x 4mm I.D., 5m particle size). The mobile phase consisted of acetonitrile: potassium dihydrogen orthophosphate buffer solution at pH 6.5 [30:70 (v/v)] with a flow rate of 1mL/min. Both warfarin and phenylbutazone were detected using a photodiode array detector. The lower limit of quantification was 100ng/mL, while the limit of detection was 20ng/mL. The linearity of the assay was good (r2=0.992) in the concentration range from 0.1 - 6.0µg/mL. The extraction recovery of warfarin was 93.53 ± 12.40%. Both the intraday and interday quality control assay for warfarin demonstrated good precision and accuracy, with all of the percentage coefficients of variation being less than 15%. Warfarin was stable in human plasma for up to three months of storage. The validated method was successfully applied to four human samples for a pharmacokinetics study.
Keywords: HPLC; liquid-liquid extraction; method validation; pharmacokinetics; warfarin
I. INTRODUCTION
Owing to its cheaper cost, warfarin is by far the most popular oral anticoagulant for treatment of various types of thromboembolism disorders even when compared to other novel oral anticoagulants that has been demonstrated to be noninferior and have less adverse effects than warfarin (Lippi et al., 2017, Lippi and Favaloro, 2015, Looi et al., 2017). However, due to its narrow therapeutic window and significant intra-and inter-individual dosing variabilities, the administration of warfarin requires extensive
2 in the cycling of vitamin K during the coagulation process, respectively.
To correlate warfarin dosing with factors that affect its variability in plasma concentrations, the determination of plasma warfarin levels is important. Some studies utilising gas chromatography (GC) to quantify warfarin levels in biological samples and pharmaceutical products (Pommier
et al., 1994, Abe et al., 2004, Rahman et al., 2018).
However, most GC methods require sample derivatisation processes that can be tedious and may not be suitable for large-scale analysis. For this reason, most plasma warfarin measurements utilizing HPLC coupled with UV detectors (Locatelli et al., 2005; Sun et al., 2006; Regalado et al., 2014). However, the analytical time can be long, and the extraction process tedious. Other researchers use mass spectrometry (MS) (Jin et al., 2006, Li et al., 2018) and fluorescent detectors (Malakova et al., 2009, Lomonaco et al., 2013) to achieve better sensitivity. Nevertheless, these methods again require sophisticated instruments that are not readily available in most laboratories. Chiral HPLC methods have also been employed to determine the levels of specific S- and R-warfarin enantiomers (Osman et al., 2005, Zuo et al., 2010, Ilisz et al., 2013), even though the drug is usually given in a racemic mixture.
In this study, we developed a new HPLC method to measure plasma warfarin levels using a simple UV detector and a simple liquid-liquid extraction (LLE) method. LLE was used because it has been reported to be more reproducible than non-automated solid phase extraction (Shintani, 2013), and in our study, it utilised only small amounts of organic solvents following a post-extraction spiked internal standard method. The method was successfully validated and used in the determination of the pharmacokinetics parameters of healthy volunteers.
II. METHODOLOGY
A. Apparatus and chemicals
Warfarin standard was purchased from US Pharmacopeia (Rockville, MD, USA). Atenolol, digoxin, frusemide and phenylbutazone standards were from Sigma Chemical Company (St Louis, MO, USA), while aspirin tablets were from Y.S.P. Industries (Selangor, Malaysia). Atorvastatin and amlodipine tablets were purchased from Pfizer (Selangor, Malaysia), enalapril tablets were from Biolab
(Selangor, Malaysia), pravastatin tablets were from Apotec Inc. (Toronto, Canada), and propranolol tablets were purchased from UPHA Pharmaceutical (Selangor, Malaysia). Acetonitrile (ACN) and sulfuric acid (H2SO4) were purchased from Merck (Darmstadt, Germany). Diethyl ether was purchased from Fisher Scientific (Leicestershire, UK). Potassium dihydrogen orthophosphate (KH2PO4) was purchased from Ajax Chemicals (Auburn, NSW, Australia). Both ACN and diethyl ether were of HPLC grade, while the other chemicals used were of analytical grade. Deionized water was produced following purification by a Millipore Milli-Q® Integral 3/5/10/15 System (Molsheim, France).
B. Preparation of Standard Solutions
Warfarin working standard solutions at 1, 8, 15, 35, 45 and 60µg/mL were prepared fresh daily by further dilution of their stock solutions (1000g/mL) with ACN. A working standard solution of the internal standard phenylbutazone was prepared fresh daily at 10g/mL by further diluting its stock solution (100g/mL) with ACN. The amlodipine, aspirin, atenolol, atorvastatin, digoxin, enalapril, frusemide, pravastatin and propranolol working standard solutions that were used in the specificity test were prepared separately at 100µg/mL.
C. Sample Preparation and Extraction
Plasma standards were prepared in duplicate by spiking working solutions of the warfarin standards into 1mL of plasma to produce plasma standards with final concentrations of 0.1, 0.8, 1.5, 3.5, 4.5 and 6.0g/mL. For quality control (QC) assays, plasma samples were prepared in duplicate to final concentrations of 0.3, 3.0 and 5.0g/mL.
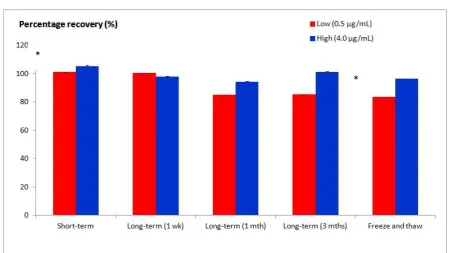
For the stability test, plasma samples were prepared in triplicate at low (0.5µg/mL) and high (4µg/mL) concentrations. Freeze-and-thaw, short-term, long-term, post-preparative and standard stock solution stability tests were performed according to the guidelines established by the FDA (CDER, 2001).
3 mixture was centrifuged at 3500g for 15 min, and the organic layer was transferred into V-bottom tubes. The raffinate was added with 2.5mL of organic solvent and centrifuged again, as described in the previous step. The organic layer was collected into the same V-bottom tube and dried under a nitrogen gas stream at 40C. The dried residual was reconstituted with 100µL of internal standard working solution to 10µg/mL, where 10µL of the solution was finally injected into the HPLC system.
D. Chromatographic Procedure
The Waters 2695 HPLC system (Milford, MA, USA) was integrated with a column, an oven, an autosampler and a vacuum degasser. Empower Pro software version 5.0 (Waters, Milford, MA, USA) was used to control the equipment and data acquisition. The analytical column was a Merck Purospher® STAR (250 x 4.6mm I.D., 5m particle size) end-capped RP-18 column (Darmstadt, Germany) coupled with a Merck Purospher® STAR (4 x 4mm I.D., 5m particle size) end-capped RP-18 guard cartridge (Darmstadt, Germany). The mobile phase was an ACN:KH2PO4 buffer solution at pH 6.5 [30:70 (v/v)] with a flow rate of 1mL/min. The detector was a Waters 2996 PDA detector (Milford, MA, USA) with specific monitoring at 300nm.
E. Pharmacokinetics Parameters
Four randomly selected healthy human volunteers (mean body weight 52.5kg) were administered a single oral dose of warfarin (p.o.) (6mg). Blood samples were collected at 0, 1, 2, 24 and 53 h to determine the warfarin levels and pharmacokinetics parameters. The collected samples were centrifuged (3500g for 15 min) and subjected to extraction within the same day. The samples were then reconstituted with the internal standard before injection into the HPLC system. The pharmacokinetics data were calculated after plotting the warfarin concentration-time profile in a log-linear relationship. The maximum concentration (Cmax) and half-life (t1/2) were determined from the graph, while the other pharmacokinetics data [time to maximum concentration (tmax), absorption rate constant (Ka), elimination rate constant (Kel), total clearance (CL) and area under the curve to infinity (AUC0-∞)] were derived from the formulae. The study was approved by the Human Research Ethics Committee of Universiti Sains Malaysia (USMKK/PPP/JEPeM [197.3(6)]). All volunteers have signed written informed consent before the warfarin administration and blood sampling.
III. RESULT
A. Chromatographic Separation
4 Both warfarin and the internal standard were fully resolved (Resolution above 3.0, which complies with the FDA guideline (CDER, 2001)) and were free of interferences from the plasma peaks (Figure 1).
B. Extraction Recoveries
The percentage recoveries of warfarin by peak area ratio and slope ratio were above 80% when investigated over the range of 0.1 - 6.0µg/mL (Tables 1 and 2), which complies with the FDA guideline (CDER, 2001).
Table 1. Percentage recovery of warfarin by peak area ratio Concentration
(µg/mL)
Recovery
(%)
0.1 118.52
0.8 88.17
1.5 86.71
3.5 87.08
4.5 88.47
6.0 92.25
Mean 93.53 ± 12.40
Table 2. Percentage recovery of warfarin by slope ratio Combined
standard
curve (n=6)
Combined
extraction curve
(n=6)
Correlation
coefficient
(r2)
0.9920 0.9830
y-interception -0.8835 -1.1128
Slope 8.4556 7.6931
Recovery
(%)
7.6931 8.4556× 100
= 90.98
C. Method Performance
The calibration curve of warfarin with six points of concentrations over the range of 0.1 - 6.0µg/mL was linear, with a mean correlation coefficient (r2) of 0.992. The lower limit of quantification, defined as five times the baseline noise of a blank injection, was 100ng/mL, while the limit of detection, defined as the lowest concentration that can be identified and differentiated from the baseline noise, was 20ng/mL (CDER, 2001). The QC assays were conducted on three consecutive days. The assays gave good precision and accuracy for both the intraday and interday determinations (Tables 3 and 4), all of which complied with the FDA requirements.
Table 3. Intraday precision and accuracy of the method for determination of warfarin in human plasma
Actual
concentration
(µg/mL)
Mean assayed
concentration
(µg/mL)
(n=2)
SD Precision
(% CV) Accuracy (%)
0.3 0.35 0.04 11.97 106.23
3.0 2.88 0.03 0.95 96.73
5
Table 4. Interday precisions and accuracies of the method for plasma warfarin determination
Actual
concentration
(µg/mL)
Mean assayed
concentration
(µg/mL)
(n=6)
SD Precision
(% CV) Accuracy (%)
0.3 0.32 0.04 12.45 108.32
3.0 2.99 0.19 6.44 99.83
5.0 5.14 0.49 9.53 102.87
D. Specificity Tests
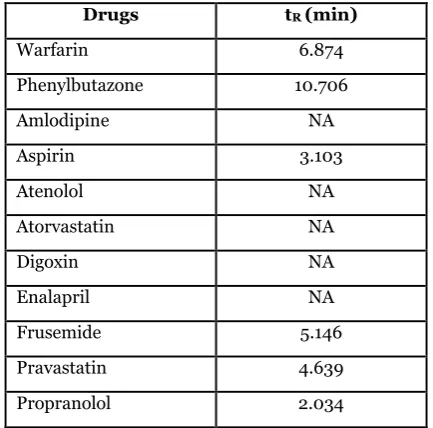
Using the developed LLE method, warfarin was preferentially partitioned from other interfering compounds potentially present in the patients’ plasma. Among all of the tested concomitant drugs, only the aspirin, frusemide, pravastatin and propranolol peaks were eluted within 14 min, while the atenolol, atorvastatin, amlodipine, enalapril and digoxin peaks were not eluted (Table 5). However, all of the eluted peaks were fully resolved from the warfarin and phenylbutazone peaks and did not interfere with warfarin quantification.
Table 5. Retention times (tR) of warfarin, phenylbutazone and other concomitant drugs that may be taken by patients
Drugs tR (min)
Warfarin 6.874
Phenylbutazone 10.706
Amlodipine NA
Aspirin 3.103
Atenolol NA
Atorvastatin NA
Digoxin NA
Enalapril NA
Frusemide 5.146
Pravastatin 4.639
Propranolol 2.034
*NA: not available
E. Stability
6
Figure 2. Percentages of warfarin compared to their respective nominal value (low and high concentrations) during short-term, long-term and freeze-and-thaw stability tests. * p < 0.05 (ANOVA)
F. Application of the Method
The validated HPLC method was successfully applied for
the determination of pharmacokinetics data in four healthy Malaysian subjects (Table 6).
Table 6. Pharmacokinetics parameters of warfarin Healthy subjects
(dose: 6mg)
Uno et al.a(2008)
(dose: 10mg)
Pradhan et al.b (2013)
(dose: 5mg)
Cmax (ng/mL) 112.80 624.00 384.52
tmax (h) 1.73 1.00 1.23
t1/2 (h) 40.47 24.30 49.93
Ka (h-1) 0.74 - -
Kel (h-1) 0.017 0.029 0.020
CL (L/h) 0.12 0.31 -
AUC0-∞ (ng*h/mL) 6043.18 17208.00 12486.00
a. Data obtained from seven healthy Japanese subjects with 'extensive metabolizers' homozygous wild-type CYP2C19 genotypes, 0-120 h post administration of single o.d. S-warfarin (10mg).
b. Data obtained from ten healthy Indian subjects, 0-120 h post administration of single o.d. S-warfarin (5mg).
IV. DISCUSSION
In this study, warfarin was analyze using a 250mm column instead of the shorter columns (Sun et al., 2006, Jin et al., 2006, Regalado et al., 2014). Racemic warfarin has previously been analyzed on a 250mm C18 column (Hadjmohammadi and Ghambari, 2012). Despite producing
longer retention times, longer columns tend to produce better peaks resolution. High-resolution chromatography is especially important in human sample HPLC analysis because the plasma may contain various kinds of exogenous compounds derived from co-administered drugs or supplements that may not entirely be eliminated during sample extraction. If the chromatography resolution is weak,
*
7 the interference peaks that have similar retention times with the intended compound peaks may co-elute and produced inaccurate peak area. Our method’s retention time is significantly faster compared to previously reported methods (Malakova et al., 2009, Hadjmohammadi and Ghambari, 2012, Regalado et al., 2014), with retention times for warfarin and phenylbutazone of approximately 7 and 11 min and a total analytical time of 14 min.
Most investigators have used a pre-extraction spiked internal standard method to quantify warfarin concentrations, in which the internal standard is spiked into the sample prior to sample pretreatment (Locatelli et al., 2005, Sun et al., 2006, Ufer et al., 2004, Henne et al., 1998, Ring and Bostick, 2000). In the pre-extraction spiked internal standard method, the peak area ratios are yielded by dividing the peak area of the extracted intended analyte by the peak area of the extracted internal standard (Poole and Poole, 2012). According to Snyder et al. (1997), an internal standard should have a similar detector response to the intended analyte in a given concentration. A typical calculation method for percentage recovery is as follows:
𝑃𝑒𝑟𝑐𝑒𝑛𝑡𝑎𝑔𝑒 𝑟𝑒𝑐𝑜𝑣𝑒𝑟𝑦
= 𝑝𝑒𝑎𝑘 𝑎𝑟𝑒𝑎 𝑟𝑎𝑡𝑖𝑜 𝑜𝑓 𝑒𝑥𝑡𝑟𝑎𝑐𝑡𝑒𝑑 𝑠𝑎𝑚𝑝𝑙𝑒𝑠 𝑝𝑒𝑎𝑘 𝑎𝑟𝑒𝑎 𝑟𝑎𝑡𝑖𝑜 𝑜𝑓 𝑢𝑛𝑒𝑥𝑡𝑟𝑎𝑐𝑡𝑒𝑑 𝑠𝑎𝑚𝑝𝑙𝑒𝑠× 100
In our investigation, however, the height of the phenylbutazone peak was much lower than that of the warfarin peak, giving a higher peak area ratio of warfarin to phenylbutazone. When the peak area ratio was applied to the percentage recovery formula, a high but false percentage recovery was produced. To avoid incorrect quantification, the peak area ratios were obtained using a post-extraction spiked internal standard method in which the internal warfarin standard was added to the sample only following the extraction procedure. The post-extraction spiked internal standard method has been reported to have a similar analytical bias as the pre-extraction spiked internal standard method (Reagen et al., 2008) and was also successfully employed by Jin et al. (2006) in the measurement of serum warfarin levels.
Our study is the first to report on the pharmacokinetics parameters of warfarin among Malaysian subjects. When the pharmacokinetics parameters were compared with
those reported from previous studies, the Cmax was found to be lower, which could be attributed to the lower dose administered when compared to a study conducted by Uno
et al. (2008). However, the Cmax of warfarin in the study
conducted by Pradhan et al. (2013) was higher than that in this present study, even though the oral warfarin dose used was 1mg lower. The absorption of warfarin is unlikely to be affected by fasting status of patients, diet or genetic variation, therefore probably caused by the different formulation of generic warfarin, which may produce different drug response (Greenblatt and von Moltke, 2005). A retrospective study conducted in Israel reported that 9.6% of patients on warfarin treatment experienced reduced INR from therapeutic to subtherapeutic level following a nationwide change of generic warfarin (Halkin et al., 2003). The CL was also lower, indicating slower metabolism, which could be attributed to genetic variations of CYP2C9 among Asians (Uno et al., 2008) that need further investigation. The AUC, which represents the warfarin bioavailability, was also lower compared to that in Pradhan et al. (2013) that utilised a similar warfarin dose. Similar to Cmax, the possible cause of variability in bioavailability is the variation in absorption, where it could be caused by administration of different generic drugs of warfarin which may contain different formulation (Dentali et al., 2011)..
V. CONCLUSION
8 calculated based on the warfarin concentration analysed by the validated HPLC method. In conclusion, the developed and validated HPLC method for the detection of warfarin is suitable for the routine analysis of warfarin levels.
VI. ACKNOWLEDGEMENT
The authors would like to thank Universiti Sains Malaysia Short Term Grant (304/PPSP/61312019) for providing financial support for this study.
VII.REFERENCES
[1] Abe, I, Nagamatsu, D, Nakahara, T & Fabian, G 2004, ‘Separation of warfarin enantiomers by capillary gas chromatography with chiral stationary phase’, Chemistry Letters, vol. 33, pp. 260-261.
[2]Carlquist, JF, Horne, BD, Muhlestein, JB, Lappe, DL, Whiting, BM, Kolek, MJ, Clarke, JL, James, BC & Anderson, JL 2006, ‘Genotypes of the cytochrome p450 isoform, CYP2C9, and the vitamin K epoxide reductase complex subunit 1 conjointly determine stable warfarin dose: a prospective study’, Journal of Thrombosis and
Thrmbolysis, vol. 22, no. 3, p. 191-7.
[3]Cder 2001, Guidance for Industry, USA.
[4]Chua, YA, Abdullah, WZ, Yusof, Z & Gan, SH 2014, ‘A New Nested Allele-Specific Multiplex Polymerase Chain Reaction Method for Haplotyping of VKORC1 Gene to Predict Warfarin Sensitivity’, BioMed Research International, vol. 2014.
http://dx.doi.org/10.1155/2014/316310.
[5]Dentali, F, Donadini, MP, Clark, N, Crowther, MA, Garcia, D, Hylek, E, Witt, DM, Ageno, W, Projects, WAR & Endeavors, O 2011, ‘Brand name versus generic warfarin: a systematic review of the literature’, Pharmacotherapy: The Journal of
Human Pharmacology and Drug Therapy, vol. 31,
pp. 386-393.
[6]Greenblatt, DJ & Von Moltke, LL 2005, ‘Interaction of warfarin with drugs, natural substances, and foods’, Journal of Clinical
Pharmacology, vol. 45, pp. 127-32.
[7]Hadjmohammadi, M & Ghambari, H 2012, ‘Three-
phase hollow fiber liquid phase microextraction of warfarin from human plasma and its determination by high-performance liquid chromatography’, Journal of Pharmaceutical and Biomedical
Analysis, vol. 61, pp. 44-49.
[8]Halkin, H, Shapiro, J, Kurnik, D, Loebstein, R, Shalev, V & Kokia, E 2003, ‘Increased warfarin doses and decreased international normalized ratio response after nationwide generic switching’,
Clinical Pharmacology and Therapeutics, vol. 74,
pp. 215-21.
[9]Henne, KR, Gaedigk, A, Gupta, G, Leeder, JS & Rettie, AE 1998, ‘Chiral phase analysis of warfarin enantiomers in patient plasma in relation to CYP2C9 genotype’, Journal of Chromatography B:
Biomedical Sciences and Applications, vol. 710, pp.
143-148.
[10] Ilisz, I, Aranyi, A, Pataj, Z & Péter, A 2013, Enantioseparations by high-performance liquid
chromatography using macrocyclic
glycopeptide-based chiral stationary phases: An overview,
Chiral Separations, Springer.
[11] Jin, MC, Chen, XH & Chen, HP 2006, ‘Determination of Warfarin and Coumatetralyl in Serum by HPLC Coupled with Electrospray Ionization Mass Spectrometry’, Journal of Liquid
Chromatography & Related Technologies, vol. 29,
pp. 2641 - 2650.
[12] Li, W, Bu, F, Li, R, Wang, B, Shaikh, AS, Zhang, Y, Guo, R & Zhang, R 2018, ‘Bioequivalence Study of Warfarin in Healthy Chinese Volunteers With a Validated High ‐ Performance Liquid
9
Clinical Pharmacology in Drug Development, vol.
7, pp. 256-262.
[13] Lippi, G & Favaloro, EJ 2015, Laboratory monitoring of warfarin in the era of direct oral anticoagulants’, The Lancet Haematology, vol. 2, pp. e223-e224.
[14] Lippi, G, Mattiuzzi, C, Cervellin, G & Favaloro, EJ 2017, ‘Direct oral anticoagulants: analysis of worldwide use and popularity using Google Trends’, Annals of Translational Medicine, vol. 5. [15] Locatelli, I, Kmetec, V, Mrhar, A & Grabnar, I
2005, ‘Determination of warfarin enantiomers and hydroxylated metabolites in human blood plasma by liquid chromatography with achiral and chiral separation’, Journal of Chromatography B, vol. 818, pp. 191-198.
[16] Lomonaco, T, Ghimenti, S, Piga, I, Onor, M, Melai, B, Fuoco, R & Di Francesco, F 2013, ‘Determination of total and unbound warfarin and warfarin alcohols in human plasma by high performance liquid chromatography with fluorescence detection’, Journal of
Chromatography A, vol. 1314, pp. 54-62.
[17] Looi, W, Tan, S, Yeo, H, Selamat, AA, Hanif, AA & Priyadarshini, C 2017, ‘Comparative Treatment Cost, Effectiveness and Safety of Dabigatran, Rivaroxaban and Warfarin in Atrial Fibrillation (AF) Patients: A Descriptive Study from Penang General Hospital (PGH)’, International Journal of
Cardiology, vol. 249, pp. S23-S24.
[18] Malakova, J, Pavek, P, Svecova, L, Jokesova, I, Zivny, P & Palicka, V 2009, ‘New high-performance liquid chromatography method for the determination of (R)-warfarin and (S)-warfarin using chiral separation on a glycopeptide-based stationary phase’, Journal of
Chromatography B, vol. 877, pp. 3226-3230.
[19] Osman, A, Arbring, K & Lindahl, TL 2005, ‘A new high-performance liquid chromatographic method for determination of warfarin enantiomers’,
Journal of Chromatography B, vol. 826, pp. 75-80.
[20] Pommier, F, Ackermann, R, Sioufi, A & Godbillon, J 1994, ‘Determination of acenocoumarol in
human plasma by capillary gas chromatography with mass-selective detection’, Journal of Chromatography B: Biomedical Sciences and
Applications, vol. 654, pp. 35-41.
[21] Poole, CF & Poole, SK 2012, Chromatography
Today, Elsevier.
[22] Pradhan, VR, Pudage, A, Patankar, S & Rathnam, MV 2013, ‘Simultaneous liquid chromatography tandem mass spectrometric determination of warfarin enantiomers in human plasma and its application to a bio-equivalence study in Indian population’, International Journal of BioAssays, vol. 2.
[23] Rahman, Z, Akhtar, S, Siddiqui, A, Ciavarella, AB, Nguyenpho, A, Faustino, PJ & Khan, MA 2018, ‘A headspace-gas chromatography method for isopropanol determination in warfarin sodium products as a measure of drug crystallinity’, Acta
Pharmaceutica, vol. 68, pp. 31-46.
[24] Reagen, WK, Ellefson, ME, Kannan, K & Giesy, JP 2008, ‘Comparison of extraction and quantification methods of perfluorinated compounds in human plasma, serum, and whole blood’, Analytica
Chimica Acta, vol. 628, pp. 214-221.
[25] Regalado, EL, Schariter, JA & Welch, CJ 2014, ‘Investigation of two-dimensional high performance liquid chromatography approaches for reversed phase resolution of warfarin and hydroxywarfarin isomers’, Journal of
Chromatography A, vol. 1363, pp. 200-206.
[26] Ring, PR & Bostick, JM 2000, ‘Validation of a method for the determination of (R)-warfarin and (S)-warfarin in human plasma using LC with UV detection’, Journal of Pharmaceutical and
Biomedical Analysis, vol. 22, pp. 573-581.
[27] Shintani, H 2013, ‘Liquid-Liquid Extraction vs Solid Phase Extraction in Biological Fluids and Drugs’, International Journal of Clinical
Pharmacology & Toxicology (IJCPT), vol. 2.
dx.doi.org/10.19070/2167-910X-130004e.
[28] Snyder, LR, Kirkland, JJ & Glajch, JL 1997,
Practical HPLC Method Development, New York,
10 [29] Sun, S, Wang, M, Su, L, Li, J, Li, H & Gu, D 2006,
‘Study on warfarin plasma concentration and its correlation with international normalized ratio’, Journal of Pharmaceutical and Biomedical
Analysis, vol. 42, pp. 218-222.
[30] Ufer, M, Kammerer, B, Kirchheiner, J, Rane, A & Svensson, JO 2004, ‘Determination of phenprocoumon, warfarin and their monohydroxylated metabolites in human plasma and urine by liquid chromatography-mass spectrometry after solid-phase extraction’, Journal
of Chromatography B, vol. 809, pp. 217-226.
[31] Uno, T, Sugimoto, K, Sugawara, K & Tateishi, T 2008, ‘The effect of CYP2C19 genotypes on the pharmacokinetics of warfarin enantiomers’,
Journal of Clinical Pharmacy and Therapeutics,
vol. 33, pp. 67-73.
[32] Winkler, AM 2019, Laboratory Support for
Warfarin Monitoring, Transfusion Medicine and
Hemostasis, Elsevier.
[33] Zuo, Z, Wo, SK, Lo, CM, Zhou, L, Cheng, G & You, JH 2010, ‘Simultaneous measurement of S-warfarin, S-warfarin, S-7-hydroxywarfarin and R-7-hydroxywarfarin in human plasma by liquid chromatography–tandem mass spectrometry’, Journal of Pharmaceutical and Biomedical