University of Pennsylvania
ScholarlyCommons
Publicly Accessible Penn Dissertations
Summer 8-13-2010
Using Structural Bioinformatics to Model and
Design Membrane Proteins
Dan Kulp
University of Pennsylvania, [email protected]
Follow this and additional works at:http://repository.upenn.edu/edissertations
Part of theBioinformatics Commons,Biophysics Commons, and theStructural Biology Commons
This paper is posted at ScholarlyCommons.http://repository.upenn.edu/edissertations/233
For more information, please [email protected].
Recommended Citation
Kulp, Dan, "Using Structural Bioinformatics to Model and Design Membrane Proteins" (2010).Publicly Accessible Penn Dissertations. 233.
Using Structural Bioinformatics to Model and Design Membrane Proteins
Abstract
Cells require membrane proteins for a wide spectrum of critical functions. Transmembrane proteins enable cells to communicate with its environment, catalysis, ion transport and scaffolding. The functional roles of membrane proteins are specified by their sequence composition and precise three dimensional folding.
The exact mechanisms driving folding of membrane proteins is still not fully understood. Further, the association between membrane proteins occurs with pinpoint specificity. For example, there exists common sequence features within families of transmembrane receptors, yet there is little cross talk between families. Therefore, we ask how membrane proteins dial in their specificity and what factors are responsible for adoption of native structure.
Advancements in membrane protein structure determination methods has been followed by a sharp increase in three dimensional structures. Structural bioinfomatics has been utilized effectively to study water soluble proteins. The field is now entering an era where structural bioinformatics can be applied to modeling membrane proteins without structure and engineering novel membrane proteins.
The transmembrane domains of membrane proteins were first categorized structurally. From this analysis, we are able to describe the ways in which membrane proteins fold and associate. We further derived sequence profiles for the commonly occurring structural motifs, enabling us to investigate the role of amino acids within the bilayer. Utilizing these tools, a transmembrane structural model was constructed of principle cell surface receptors (integrins). The structural model enabled understanding of possible mechanisms used to signal and to propose a novel membrane protein packing motif.
In addition, novel scoring functions for membrane proteins were developed and applied to modeling membrane proteins. We derived the first all-atom membrane statistical potential and introduced the usage of exposed volume. These potentials
allowed modeling of complex interactions in membrane proteins, such as salt bridges.
To understand the geometric preferences of salt bridges, we surveyed a structural database. We learned about large biases in salt bridge orientations that will be useful in modeling and design. Lastly, we combine these structural bioinformatic efforts, enabling us to model membrane proteins in ways which were previously inaccessible.
Degree Type
Dissertation
Graduate Group
Biochemistry & Molecular Biophysics
First Advisor
Keywords
protein design, membrane proteins, structure prediction, salt bridges, statistical potential
Subject Categories
USING STRUCTURAL BIOINFORMATICS TO MODEL
AND DESIGN MEMBRANE PROTEINS
Daniel W. Kulp
A DISSERTATION
in
Biochemistry and Molecular Biophysics
Presented to the Faculties of the University of Pennsylvania in Partial
Fulfillment of the Requirements for the Degree of Doctor of Philosophy
2010
William F. DeGrado, Professor, Biochemistry and Molecular Biophysics Supervisor of Dissertation
Kathryn M. Ferguson, Associate Professor, Physiology Graduate Group Chairperson
Dissertation Committee
Roland L. Dunbrack, Associate Professor, Biochemistry and Molecular Biophysics
Kim A. Sharp, Associate Professor, Biochemistry and Molecular Biophysics
Joel Bennett, Professor, Biochemistry and Molecular Biophysics
Casim A. Sarkar, Assistant Professor, Bioengineering
Michael L. Klein, Professor, Chemistry
USING STRUCTURAL BIOINFORMATICS TO MODEL
AND DESIGN MEMBRANE PROTEINS
COPYRIGHT
2010
Acknowledgements
For all the fruitful discussions on scientific issues, I’d like to thank the people
in the DeGrado lab and the BMB Department. Without those convserations, my
mind never would have visited the places it needed to go. I enjoyed a short stay in
the wet laboratory, where Ivan, Scott, Dave, Paul, Jade, Yao and John were very
patient and helpful in walking me through the experiments. I am in great debt to
the computational folks, who were forced to sit through many whiteboard scribbling
sessions. Alessandro, Cinque, Brett, Gevorg, Jason, Scott and Ilan - thank you.
The members of my committee have been a great source of guidance, thanks Kim
Sharp, Roland Dunbrack, Mike Klein, Jeff Saven, Joel Bennett and Casim Sarkar.
Lastly, I’d like to thank my mentor Bill DeGrado. Bill has great insight into protein
structure and design. It has been a fun ride and I’ve tried to absorb all that I could
while working with him, not only in his approach to science but also in his open
approach to research and in his ability to constantly see the silver-lining and the big
picture.
Without the support of my family I never would have made it through the
past five years. First, I’d like to thank my late grandfather, John L. Kulp, for setting
a standard of academic excellence, which I strive for. My grandmothers, Adele and
Helen, were very supportive while in graduate school and their generosity was crucial
for my success. Next, I need to thank my mom, Carolyn, for always helping out in
anyway she could, especially in watching my children. With my father, John, I have
shape a lot of my research inquiries. There were two important peices of advice
from my Dad: use the right tool for the job and strive for quality - thanks Dad. I’d
like to thank my in-laws, Megan and Phil, for supporting Sara, the girls and myself,
without hessitation.
My wife, Sara, has supported me through all my graduate years. Suprisingly,
I have sometimes been frustrated over the last 5 years and she has been my best
friend, partner and sounding board. She often helps me see the big picture of life,
over the small daily irritations (no not my children). Sara has shouldered the burden
of my work load by being not only a great wife, but a great mother. I appreciate you
and everything you have done for us, I could not have done it without you. Although
my children do not know it they are my inspiriation and serve as an infinite source
ABSTRACT
USING STRUCTURAL BIOINFORMATICS TO MODEL AND DESIGN
MEMBRANE PROTEINS
Daniel W. Kulp
William F. DeGrado, Professor, Biochemistry and Molecular Biophysics
Cells require membrane proteins for a wide spectrum of critical functions.
Transmembrane proteins enable cells to communicate with its environment,
catal-ysis, ion transport and scaffolding. The functional roles of membrane proteins are
specified by their sequence composition and precise three dimensional folding.
The exact mechanisms driving folding of membrane proteins is still not
fully understood. Further, the association between membrane proteins occurs with
pinpoint specificity. For example, there exists common sequence features within
families of transmebrane receptors, yet there is little cross talk between families.
Therefore, we ask how membrane proteins dial in their specificity and what factors
are responsible for adoption of native structure.
Advancements in membrane protein structure determination methods has
been followed by a sharp increase in three dimensional structures. Structural
bioin-fomatics has been utilized effectively to study water soluble proteins. The field is
now entering an era where structural bioinformatics can be applied to modeling
membrane proteins without structure and engineering novel membrane proteins.
The transmembrane domains of membrane proteins were first catagorized
structrually. From this anaylsis, we are able to describe the ways in which membrane
proteins fold and associate. We further derived sequence profiles for the commonly
occuring structural motifs, enabling us to investigate the role of amino acids within
the bilayer. Utilizing these tools, a transmembrane structural model was constructed
of principle cell surface receptors (integrins). The structural model enabled
under-standing of possible mechanisms used to signal and to propose a novel membrane
In addition, novel scoring functions for membrane proteins were developed
and applied to modeling membrane proteins. We derived the first all-atom membrane
statistical potential and introduced the usage of exposed volume. These potentials
allowed modeling of complex interactions in membrane proteins, such as salt bridges.
To understand the geometric preferences of salt bridges, we surveyed a structural
database. We learned about large biases in salt bridge orienations that will be useful
in modeling and design. Lastly, we combine these structural bioinformatic efforts,
Contents
Acknowledgements iii
1 Introduction 1
2 A Transmembrane Helix Pair Library for Modeling and Design 9
2.1 Introduction . . . 9
2.2 Results and Discussion . . . 11
2.3 Conclusions . . . 34
2.4 Methods . . . 35
3 Modeling Integrin Receptors with Helix Pairs 72 3.1 Abstract . . . 72
3.2 Introduction . . . 74
3.3 Results . . . 75
3.4 Discussion . . . 84
3.5 Materials and Methods . . . 86
3.6 Supplemental Methods . . . 89
4 Evaluation of forces driving transmembrane helix association 108 4.1 Abstract . . . 108
4.2 Introduction . . . 110
4.4 Discussion . . . 119
4.5 Methods . . . 119
5 All-atom membrane potential for modeling complex interactions 134 5.1 Introduction . . . 134
5.2 Results . . . 137
5.3 Discussion . . . 158
5.4 Methods . . . 160
6 Salt Bridges: Designable Interactions Explored In Detail 176 6.1 Introduction . . . 176
6.2 Results . . . 179
6.3 Discussion . . . 197
6.4 Methods . . . 198
List of Tables
2.1 Helix pair homology . . . 12
2.2 Cluster geometries . . . 16
2.3 Reference amino acid distribution . . . 19
2.4 Assignment of cluster and threading by log-odds scoring . . . 31
2.5 Helix pair duplicates for each membrane protein . . . 40
2.6 Sequence biases for interface positions . . . 45
4.1 Association of MS1 variants determined by AUC . . . 112
4.2 Thermodynamic parameters for MS1 variants . . . 115
4.3 Lowest energy models of MS1 . . . 119
4.4 Association of air-oxidized MS1 variants determined by AUC . . . 125
4.5 Crick parameters at the energy minimum . . . 126
5.1 Best free parameter values for statistical potentials . . . 145
5.2 Correlation of GpA and BNIP3 mutants . . . 150
5.3 Transmembrane helix geometry recognition test . . . 152
5.4 Modeling Beta2 Adrenergic Receptor and decoys . . . 155
5.5 M2 modeling: sampling parameters . . . 163
5.6 Atom type reduction . . . 164
List of Figures
2.1 Helix pair definitions . . . 12
2.2 Interhelical crossing angle distribution of interaction windows . . . 13
2.3 SASA of helix windows . . . 14
2.4 Fitting ideal helices toα-helical dimers . . . 15
2.5 Sequence histograms . . . 18
2.6 Amino acid correlations in membrane proteins . . . 20
2.7 Anti-parallel left cluster geometry . . . 22
2.8 Anti-parallel left cluster geometry . . . 23
2.9 Large residues create helix interface . . . 25
2.10 Aromatic residues packing at a parallel left interface . . . 27
2.11 Threading sequences onto discovered interaction windows . . . 29
2.12 Two dimensional scoring of parallel-right sequences . . . 32
2.13 Two dimensional scoring of anti-parallel left sequences . . . 33
3.1 Using DN-ToxRed to measure heteromeric interaction integrins . . . . 77
3.2 Effect of mutations heteromeric association of α and β integrins . . . 78
3.3 Effect of α1,α2, andα5 TM domain mutations on β1 integrin function 80 3.4 Reciprocal ”large-small” motif mediates the heteromeric association of integrin TM domains. . . 83
3.5 A family of helical dimers containing the integrin TM heterodimer structural motif. . . 85
3.7 Characterization of DN-ToxRed mutant expression in E. coli. . . 97
3.8 Homo- and heterooligomerization of integrin α/β TM domains using DNToxRed . . . 98
3.9 Summary of alanine- and leucine-scanning mutagenesis results for het-erooligomerization . . . 99
3.10 2-color FACS assay for α2β1 integrin function. . . 100
3.11 1-color FACS assay for α5β1 integrin function. . . 101
3.12 Membrane protein structures used to generate the helix pair library . 102 4.1 Variants of a designed membrane coiled-coil . . . 111
4.2 Fractions of cross-linked dimer . . . 114
4.3 Oligomeric states of MS1-variant peptides . . . 116
4.4 Energy landscape for MS1-Gly sequence . . . 118
4.5 CD spectra of MS1 variants . . . 121
4.6 Simulation of disulfide exchange equilibrium . . . 123
4.7 Sedimentation equilibrium analysis of reduced MS1 variants in DPC micelles . . . 128
4.8 Sedimentation equilibrium analysis of the MS1 variants in DPC micelles129 5.1 Comparing exposed volume of C-α and side chain atom . . . 140
5.2 Variation in exposed volume atom types . . . 141
5.3 Atom-atom membrane potential curves . . . 149
5.4 Modeling conformational variability in M2 influenza proton channel . 154 5.5 Prediction of stability of coiled coil mutants . . . 157
5.6 Soluble and Membrane models of GpA . . . 158
5.7 Varying α and β near potential minimum . . . 167
5.8 Low count correction . . . 168
5.9 Overall attractiveness of un-equated potentials . . . 169
6.2 Spherical coordinates of Arg . . . 181
6.3 Plane angles of Arg with Asp/Glu . . . 182
6.4 Tetrahedral Geometry of Lys . . . 185
6.5 Geometric bias as a function of sequence separation and distance . . . 187
6.6 Helical and sheet local salt bridges . . . 189
6.7 Local salt bridge motifs . . . 192
6.8 Side chain dihedral angle distribution in salt bridges . . . 194
6.9 Common local networked salt bridges . . . 196
6.10 Local interactions that favor complex salt bridge formation . . . 196
6.11 Cooperativity of salt bridges . . . 202
6.12 Preference for solvent accessibility . . . 204
6.13 Effects of SASA on salt bridge geometry . . . 205
6.14 Effect of B-factor on salt bridge geometry . . . 206
6.15 Side chain confomations for basic residues . . . 207
7.1 Model of the T-Cell Receptor . . . 217
Chapter 1
Introduction
A lipid bilayer surrounds a cell and is host to a special class of proteins,
trans-membrane proteins. Transtrans-membrane receptors, such as the aspartate receptor,1 are
responsible for recognition of ligands outside the cell and triggering an internal
cellu-lar response. Membrane-embedded enzymes are another type of membrane protein,
which can function in a variety of ways, such as modulating the lipid content.2
Aquaporins and ion channels provide the cell mechanisms to maintain the delicate
balance of ion gradients. Understanding the signal transduction process and
molec-ular recognition of membrane proteins require intimate knowledge of protein motion
and flexibility within the lipid bilayer.
Membrane proteins can accomplish their function by a wide variety of
struc-tural solutions. Membrane protein structures are commonly broken into three classes:
peripheral, β-barrel and α-helical. Peripheral membrane proteins sit on the surface
membrane, sometimes anchoring a hydrophobic helix into one leaflet. Their roles
are largely in processing, scaffolding and signal transduction. For example,
Synap-tobrevin homolog 1 protein is a membrane-associated protein involved in membrane
trafficking during cell elongation. One way membrane proteins can fully embed into
the bilayer is by forming a β-barrel. Interestingly, these proteins are only found
protein from this class is the autotransporter which has a transmembrane β-barrel
domain whose purpose is to transport the functional domain across the membrane
through the middle of theβ-barrel.3
The major class of transmembrane proteins and the focus of this disseration,
is the α-helical membrane protein. The reason for this fold being dominant stems
from the need to transition from an unfolded protein in water into a folded
pro-tein in the hydrophobic lipid bilayer. The dehydration of the polar backbone atoms
is partially compensated for by pairing the backbone carbonyls with backbone
ni-trogens in the folded state. The folding process can be thought of as a two-stage
event.4 First, an unfolded protein is inserted into the bilayer, using the translocon
complex.5 Second, independently folded helices associate to form the final three
di-mensional structures. The free energy of this final step can be quite complex, due
to contributions from helix-helix, helix-lipid, lipid-lipid, helix-water, lipid-water and
water-water. The difficulty in modeling membrane proteins requires improvements
in computational techniques.
Modeling and design are effective ways to study membrane proteins. There
are numerous ways in which one may approach modeling membrane proteins.
Molec-ular dynamics can be used to inspect the energetics and forces of membrane
pro-teins in a time-dependent manner. With the advancement in computer power, 100
nanosecond simulations in explicit lipids are common.6 This time range allows for
the simulation of many interesting phenomenan, for instance the complete folding
of the transmembrane helix (M2) of the influenza virus from water into the
mem-brane bilayer.7 Coarse grain models, which can access much longer times, have also
been quite successful in monitoring antimicrobial peptide effects on membrane
bi-layers.8 Despite these successes, convergence of the sampling of membrane proteins
in long atomic simulations has been questioned6 and complementary approaches can
therefore be utilized.
methods. The clustering of membrane proteins, for instance, has been studied using
Monte Carlo sampling algorithms.9 Monte Carlo methods have also been used to
model helix-helix configurations in membrane proteins.10–12 When the sampling
space can be reduced or approximated, exhaustive sampling of a parameter space can
be used. Coiled-coils are an excellent example.13 As shown in Chapter 4, coiled coils
are used to structurally model an oligomeric transmembrane peptide, MS1 and its
sequence variants. The parametrization is an appropriate estimate for MS1 because
it was designed from a soluble coiled coil, GCN4.14 Also, statistcal and probabilistic
methods can be used in protein design to estimate probablities of amino acids at
each position on a target backbone, as was done to solubilize the membrane-spanning
potassium channel KcsA.15
An interesting approach for modeling soluble proteins is structural
bioin-formatics. The conformational freedom of side chains has long been modeled using
bioinformatic approaches.16 Most protein design packages will include some form of
discrete side chain conformation sampling. In soluble proteins, potentials derived
from structural bioinformatics have been used to score properly folded proteins,
protein-DNA interactions and protein-ligand interactions.17–19 For structure
predic-tion and design purposes, backbone fragments from crystal structures have been used
to create models.20 From a more computational geometry viewpoint, a structural
analysis of tunnels and pores has recently been contributed to the understanding of
membrane protein structure.21 In the past limited numbers of membrane proteins
made it difficult to accomplish modeling and design tasks using structural
bioinfor-matics.
The new wealth of information available due to many new membrane protein
crystal structures and the knowledge gained from bioinformatic algorithms applied
to soluble proteins set the stage for the research described within this dissertation.
The approach is three fold. First, we compute distributions of observables which
model and design. Second, we derive statistical scoring functions which enable us to
capture the essence of the observable for use in modeling membrane proteins. Third,
we analyze the statistical data in order to impose design and modeling restrictions,
which enable us to focus our efforts onto areas of dense information.
Before approaching modeling transmembrane proteins, we ascertain the
in-formation content available in crystallographic datasets by understanding the
dis-tributions of observables features. In Chapter 2, we excise pairs of α-helices from
complete membrane proteins and categorize the interactions between them. From a
structural viewpoint, we find a representative set of the common folds which
mem-brane proteins use to achieve their native structures. From a sequence viewpoint,
we analyze the dimeric interactions to discover features at the level of amino acid
that drive folding and specificity for given folds. In Chapter 6, we compute the
geometric distributions of salt bridges in order to understand preferences of
neg-atively charged residues around positively charged residues, enabling modeling of
membrane proteins containing these interactions. In Chapter 5, we look in detail at
atom-atom interactions and find the most critical ones for membrane protein folding
and specificity.
In each case, statistical biases can easily be turned into a scoring function
using a log-odds approach. By construction of a simple scoring function, we are able
to correlate amino acid populations across all positions in the membrane and discover
the pairs of co-populating amino acids (Chapter 2). In addition, using methods from
soluble proteins and deriving some novel approaches we present the first set of
all-atom statistical potentials for membrane proteins (Chapter 5). We then use these
potentials to score membrane proteins of varying sizes and conformations.
Lastly, we show how we can apply our structural bioinformatic knowledge to
model novel membrane proteins. The informatics enables us to focus our modeling
efforts on the ”hot spots” of structure and sequence space. To that end, we model
by correlating our model with experimentally determined values for disruption and
are consistent with an NMR structure determined after our modeling was complete.
Further implications of our structural bioinformatic approach and future directions,
Bibliography
[1] S. A. Chervitz, C. M. Lin, and J. J. Falke. Transmembrane signaling by the
aspartate receptor: engineered disulfides reveal static regions of the subunit
interface. Biochemistry, 34:9722–9733, Aug 1995.
[2] A. M. Stanley, A. M. Treubrodt, P. Chuawong, T. L. Hendrickson, and K. G.
Fleming. Lipid chain selectivity by outer membrane phospholipase A. J. Mol.
Biol., 366:461–468, Feb 2007.
[3] C. J. Oomen, P. van Ulsen, P. van Gelder, M. Feijen, J. Tommassen, and P. Gros.
Structure of the translocator domain of a bacterial autotransporter. EMBO J.,
23:1257–1266, Mar 2004.
[4] J. L. Popot and D. M. Engelman. Membrane protein folding and
oligomeriza-tion: the two-stage model. Biochemistry, 29:4031–4037, May 1990.
[5] S. H. White. Membrane protein insertion: the biology-physics nexus. J. Gen.
Physiol., 129:363–369, May 2007.
[6] A. Grossfield, S. E. Feller, and M. C. Pitman. Convergence of molecular
dy-namics simulations of membrane proteins. Proteins, 67:31–40, Apr 2007.
[7] I. C. Yeh, M. A. Olson, M. S. Lee, and A. Wallqvist. Free-energy profiles of
membrane insertion of the M2 transmembrane peptide from influenza A virus.
[8] C. F. Lopez, S. O. Nielsen, G. Srinivas, W. F. Degrado, and M. L. Klein.
Probing Membrane Insertion Activity of Antimicrobial Polymers via
Coarse-grain Molecular Dynamics. J Chem Theory Comput, 2:649–655, May 2006.
[9] J. Goldman, S. Andrews, and D. Bray. Size and composition of membrane
protein clusters predicted by Monte Carlo analysis. Eur. Biophys. J., 33:506–
512, Oct 2004.
[10] D. G. Metcalf, P. B. Law, and W. F. DeGrado. Mutagenesis data in the
au-tomated prediction of transmembrane helix dimers. Proteins, 67:375–384, May
2007.
[11] H. Kokubo and Y. Okamoto. Prediction of membrane protein structures by
replica-exchange Monte Carlo simulations: case of two helices. J Chem Phys,
120:10837–10847, Jun 2004.
[12] S. Kim, A. K. Chamberlain, and J. U. Bowie. A simple method for modeling
transmembrane helix oligomers. J. Mol. Biol., 329:831–840, Jun 2003.
[13] K. A. McAllister, H. Zou, F. V. Cochran, G. M. Bender, A. Senes, H. C. Fry,
V. Nanda, P. A. Keenan, J. D. Lear, J. G. Saven, M. J. Therien, J. K. Blasie,
and W. F. DeGrado. Using alpha-helical coiled-coils to design nanostructured
metalloporphyrin arrays. J. Am. Chem. Soc., 130:11921–11927, Sep 2008.
[14] E. K. O’Shea, J. D. Klemm, P. S. Kim, and T. Alber. X-ray structure of the
GCN4 leucine zipper, a two-stranded, parallel coiled coil. Science, 254:539–544,
Oct 1991.
[15] A. M. Slovic, H. Kono, J. D. Lear, J. G. Saven, and W. F. DeGrado.
Computa-tional design of water-soluble analogues of the potassium channel KcsA. Proc.
[16] R. L. Dunbrack. Rotamer libraries in the 21st century. Curr. Opin. Struct.
Biol., 12:431–440, Aug 2002.
[17] H. Zhou and Y. Zhou. Distance-scaled, finite ideal-gas reference state improves
structure-derived potentials of mean force for structure selection and stability
prediction. Protein Sci., 11:2714–2726, Nov 2002.
[18] J. E. Donald, W. W. Chen, and E. I. Shakhnovich. Energetics of protein-DNA
interactions. Nucleic Acids Res., 35:1039–1047, 2007.
[19] C. Zhang, S. Liu, Q. Zhu, and Y. Zhou. A knowledge-based energy function for
protein-ligand, protein-protein, and protein-DNA complexes. J. Med. Chem.,
48:2325–2335, Apr 2005.
[20] C. A. Rohl, C. E. Strauss, D. Chivian, and D. Baker. Modeling structurally
variable regions in homologous proteins with rosetta. Proteins, 55:656–677, May
2004.
[21] R. G. Coleman and K. A. Sharp. Finding and characterizing tunnels in
macro-molecules with application to ion channels and pores. Biophys. J., 96:632–645,
Chapter 2
A Transmembrane Helix Pair
Library for Modeling and Design
2.1
Introduction
The combination of matured sequence methods for predicting transmembrane
regions and the limited number membrane proteins structures begs for advancement
in membrane protein structure prediction methods. Membrane proteins are used in
a wide spectrum of functionally important biological processes. Membrane proteins
provide cells an essential mechanism to communicate with their environment, by
receptors modulating signaling cascades. The functional roles of membrane proteins
are specified by their sequence composition and precise three-dimensional folding. By
dissecting membrane proteins into helix pairs, we begin to understand the sequence
and structure factors required for building accurate three-dimensional membrane
protein structures.
The α-helical membrane folding process can be viewed as two independent
events; first insertion into the bilayer and then association of α-helices.1 The
com-plicated insertion process uses the translocon membrane protein to locate regions of
final arrangement of the embedded α-helices placing residues into three-dimensional
localities, enabling proper function.
The association of membrane-embedded α-helices has been studied by a
battery of approaches, including structural, biophysical and computational3–6 . An
early important structural understanding of helix-helix interactions in membrane
proteins was achieved using the structure of the Glycophorin-A (GpA) homodimer.7–9
These studies showed both important structure and sequence features: the GpA
homodimer has an inter-helical crossing angle of -40◦, and two critical glycines are
spaced four residues apart (GxxxG). Other homo-oligomerization motifs were also
found to be mediated by small residues (SxxxSSxxT).6 In addition, polar residues
have been shown to play a role in association of designed membrane peptides.10
The marked increase in membrane proteins structures opens the door for
rigorous structural bioinformatic analysis of membrane protein folding and
func-tion. Previously membrane helix packing had been studied from a bioinformatic
approach.11, 12 These studies explored the universe of packing geometries allowed
for helix dimers. Walters et al.11 clustered and described the four most populated
clusters using 2 geometric parameters (interhelical distance and crossing angle) and
1 sequence metric (glycine-alanine-serine propensities). However, to fully describe
the orientations of two helices more parameters are needed13and there are numerous
sequence features still to be explored.
In the study, we intend to create a large, designable database of membrane
helix dimers and to develop a richer description of structure and sequence factors
involved in membrane protein folding. We first create a non-redundant library of
helix dimers and then investigate the structural motifs therein. We next parametrize
each helix motif by a set of translations and rotations and are able to ascertain the
differences in geometries between well-clustered helix pairs. The sequences of each
cluster are analyzed in turn, for single, double, or triple amino acid biases. After
single amino acid biases, enabling us to effectively score sequences onto their native
structure. Finally, we discuss properties that will be useful for applying the library
to protein modeling and design studies.
2.2
Results and Discussion
Characterization of the pair library
The extent to which a helix pair library is useful in designing and modeling
membrane proteins depends on its size. Here we created a helix pair library with the
goal of maximizing unique pairs. First, individual helices are identified and excised
from their larger structure (see Methods). We generously define an initial helix pair
as two helices where the C-α atoms of closest approach are less than 12˚A. In total,
our library has 2251 transmembrane helix pairs. To avoid duplicate dimers, we define
chaingroups as a set of chains within a protein structure file that are>%99 identical.
There are 3 categories of dimers: inter-chaingroup, intra-chaingroup and inter-chain
(see Methods). In the supplement, Table 2.5 lists each PDB file with the number
of dimers in each category. Overall, we have 1568 inter-chain, 377 inter-group and
306 intra-group dimers. We filtered this complete library by sequence similarity
between chains. Table 2.1 shows the corresponding reduction in size of our library
with various homology cutoffs. For comparison, at 30% homology (where no pair of
chains has more than 30% sequence similarity), the library retains 1083 pairs, twice
the number of a previously constructed library.11
The essential feature of a helix pair library is its geometric coverage.
Pre-vious analysis of helix dimers described highly populated clusters of four different
helix crossing angles.11 Figure 2.1A shows the definition of the four crossing angles
(Anti-parallel Left, Anti-parallel Right, Parallel Left and Parallel Right). Helix
win-dows are defined as two blocks (one from each helix) of length 16, as depicted in
Homology # of Pairs # of interaction windows
30% 1083 58,622
50% 1478 77,414
70% 1687 90,606
90% 1869 97,688
All 2251 116,046
Table 2.1: Number of pairs of helices and windows for each chain homology cutoff. Walters et al. used block sizes of 10, while sometimes extended to 14. Therefore, we use a block size is 12 for defining the interaction window column.
different interaction geometries. The distribution of crossing angles from the helix
windows matches Walters et al.11 and is shown in Figure 2.2, with tight peaks for
anti-parallel left (-155◦), anti-parallel right (150◦), parallel right (-35◦) and a wider
distribution for parallel left (15◦).
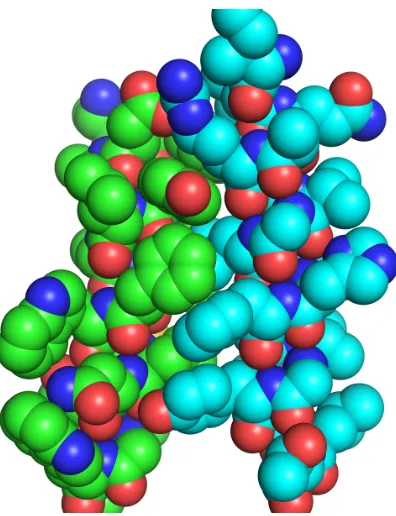
Figure 2.1: Helix pair definitions. Crossing angle quadrants are shown in A. Our definition of a helix window is shown in B (labeled helix interaction motif). Helix parametrization scheme is outlined in C, where the blue helix is transformed onto the red regions of helix A and B independently. We can vary the block size from 10-20, but the results here use block sizes of either 12 or 16.
After bilayer insertion, the formation of a helix pair can be thought of
as the primary membrane protein folding event. One key characteristic in protein
Figure 2.2: Interhelical crossing angle distribution of interaction windows. Each color represents an angle range.
area(SASA) of the helix pairs. This gives us intuition for how surface area is used in
the interaction between transmembrane helices. Over the full helix dimers, the range
of buried area is 0 - 1500˚A2, which is within values reported elsewhere.12 Next we
analyze SASA of each window and Figure 2.3 shows multiple populations of residue
solvent accessibility (see Methods), an exposed population (< 50˚A2), a partially
buried population (between 50˚A2 and 300˚A2) and a more fully buried population
(peak at 500˚A2). We will use these categories to help select out windows that
have significant interaction surfaces, removing the exposed population from further
consideration.
Detailed Structure and Sequence Investigation of Helix Pairs
Engineering novel transmembrane proteins requires a finer investigation of the
distributions of helix pairs. To that end, we structurally cluster the pairs to discover
sub populations that are designable. This approach was successfully used to design
a transmembrane peptide to modulate the function of integrin cell adhesion
recep-tors.14, 15 With a larger structural database, we envision an ability to target wider
ranges of transmembrane receptors, enzymes and transporters.
In order to structurally compare helix pairs, first we clustered all helix
Figure 2.3: Amount of area buried upon dimer formation of the interaction windows. Notice 2 distinct peaks one near 0˚A2 and one centered at 500˚A2.
helix pairs. A cluster is defined by the helix pair (centroid) with the most matched
windows under 1.2˚AC-α RMSD. The helix pairs of the newly formed cluster are
removed and the process is repeated until no more pairs remain (see Methods for
detailed description). After clustering, we have multiple clusters, each containing a
helix pair centroid and structurally similar helix pair members.
The helix pairs within each cluster were next geometrically analyzed. The
helix windows used to define each cluster were then parametrized using the
follow-ing method. As depicted in Figure 2.1C, an ideal z-aligned helix (the blue helix)
is transformed to align on top of each 16-residue block (red squares). We setup
this problem as a sum-of-squares minimization routine, where we continually
trans-formed the ideal helix until we achieved a minimal RMSD value to each block (e.g.
Figure 2.4). The resulting fit defined three rotations, two translations and symmetry
rotation (see methods for more details).
Upon clustering, we have twelve clusters which describe geometries for
transmembrane helix dimerization. Initially, we used small blocks of size 10 and
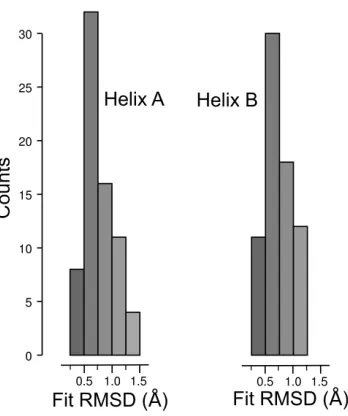
Figure 2.4: Fitting ideal helices to α-helical dimers. For a set of anti-parallel left dimers, helix A and helix B, we show the RMSD between the C-α atoms of a 16-residue block and C-α atoms from an ideal 16-residue helix.
goal is to insure structural homogeneity, which was achieved by increasing the block
size to 16 residues, at the cost of reducing the number of members in each cluster.
Table 2.2, shows the overview of the geometric parameters for each cluster. For the
remainder of the study we will concentrate on clusters with at least ten members.
We have seven anti-parallel left helix dimers, five anti-parallel right, one parallel-left
and one parallel-right cluster.
A pair library can aid the design of membrane proteins by another
mech-anism, structurally specific sequence profiles. A sequence profile is a general term
used to describe the biases for certain types of amino acids at each position along
both helices in the dimer. In the approach similar in spirit to Yin et al,14 a target
membrane protein sequence can be searched across the sequence profiles of the
clus-ters. The helix pairs with matching sequence profiles can be confidently used as a
starting point for design. In addition, the sequence statistics can be used to propose
Cluster Pairs ANGLE DIST MUTDIST MIN RMSD 0 71 -157.55 (6.25) 8.85 (0.91) -5.05 (5.75) 0.52 (0.19) 1 21 177.50 (1.94) 9.82 (0.64) 26.73 (45.44) 0.67 (0.21) 2 18 145.81 (6.68) 8.46 (0.52) -8.12 (1.85) 0.83 (0.32) 3 17 -177.74 (4.61) 11.06 (0.96) 42.71 (53.63) 0.81 (0.37) 4 11 -36.20 (5.07) 7.27 (0.82) -6.99 (1.61) 1.77 (0.29) 5 42 -155.66 (5.15) 8.23 (0.65) -6.81 (3.47) 0.51 (0.17) 6 11 -142.76 (6.98) 9.45 (0.39) -7.68 (2.11) 0.58 (0.17) 7 13 3.08 (8.05) 9.96 (0.75) 99.22 (162.35) 1.50 (0.30) 8 10 -134.12 (6.45) 10.63 (0.90) -7.14 (2.34) 0.91 (0.30) 9 11 151.35 (9.16) 9.08 (0.79) -7.11 (2.08) 0.81 (0.36) 10 20 -157.63 (6.57) 9.63 (0.89) -5.03 (4.54) 0.61 (0.17) 31 11 149.91 (8.15) 8.17 (0.34) -8.68 (1.04) 0.98 (0.37)
Table 2.2: Cluster Geometries. The columns represent the cluster identifier, the number of pairs, the interhelical-crossing angle, the interhelical distance, the distance to the mutual perpendicular of the two helix axis and the minimum RMSD (˚A) of aligning block from helix A onto helix B, while aligning block from helix B onto helix A. The crossing angle and interhelical distance can be computed from the X and Y rotations of our fitted parameters.
within modeling and design algorithms.
The effective use of sequence statistics is dependent on the number of
obser-vations. Here, our structural clustering produced geometrically homogeneous groups
of helix dimers, yet in limited numbers. We addressed this by creating a ”fishing”
algorithm to enlarge the number of aligned dimers per cluster (see Methods). By
greatly growing the number of aligned sequences we increase our signal-to-noise
ra-tio. The sequence statistics have been increased by more than factor of ten in the
most cases. In Figure 2.5A, we see the number of amino acid observations per
po-sition along each helix for two related anti-parallel left clusters. The first feature
to notice is the length of the populated (> 100) positions (x-axis in Figure 2.5),
which is about 16 amino acids long. The populated position length is a conserved
feature over the clusters investigated thus far, which gives intuition of the nature of
more than 100 observations and if we narrow it to 10 residues many clusters have
well over 200, at each position along the helix. Upon ”fishing” clusters increase in
size by at least 3.5 times bigger, in some cases 10 times bigger (Figure 2.5B).
A question we can ask, given rich sequence statistics, is which amino acids
correlate, or tend to be found (or not found) at the same positions, across
multi-ple structural clusters. To answer this question, we developed a sequence scoring
function, built upon the observed amino acids at each position. Structurally specific
amino acid observations can be converted into a scoring function using Equation 2.1,
which scores a given amino acid i at a given position p. The Nobs is the number of
observations of amino acid i at position p andNexp is the number of expected amino
acids (derived from the distribution of amino acids in membrane protein structures,
see Table 2.3). The α parameter is set to 0.5, because this value has been shown to
be work well for this potential form on membrane proteins(Chapter 5). The simplest
Nobs is a single amino acid, however combining residue statistics has been shown to
be useful in identifying cluster characteristics.11
µi,p =−ln( Nobs
i,p +α q
Niexp
Niexp+αqNiexp
) (2.1)
After tabulating the scores using Equation 2.1 of individual amino acids
at each position ( 500 unique positions), a matrix of correlation coefficients can
be produced. Figure 2.6 shows a heat map of the amino acids, where darker colors
correlate more strongly than lighter colors. The heat map can be though of as a
sub-stitution matrix. The correlation coefficient of two amino acids tells us that these
amino acids tend to either co-populate or not populate the same positions. The
strongest correlation is between glycine and serine, which is not surprising given the
large amount of literature on clustering of small residues at specific interface
posi-tions(Moore et al.?? and citations therein). We find that sulfur containing amino acids also tend to cluster. Polar and charged residues can play catalytic or other
Figure 2.5: Sequence Histograms. Panel A shows the #-of aligned residues for the centroid structure of cluster 0 (top left,right) and for cluster 5 (bottom left,right). Panel B shows a table of the number of original dimers matched when building the cluster and the number of dimers resulting from our ”fishing” algorithm.
final folded transmembrane protein structure.10, 17 There are many possible
com-binations of polar amino acids, but we find only a few tend to co-populate (e.g.
glutamine and histidine). The role of beta-branched amino acids, with their reduced
number of available side chain configurations, are known to play important roles in
helix interfaces, due to the minimal entropic cost of fixing a beta-branched side chain
upon dimer formation.8, 9 We see that the beta branched amino acids isoleucine and
valine correlate, and valine and threonine correlate. These correlations can provide
intuition on substitutions when designing membrane proteins.
We now have the sequence tools to investigate biases at individual positions
in each cluster. To that end, we constructed a table for each position, helix and
cluster(Table 2.6). Each position along the interface was inspected for a sequence
bias. First we examined each position for single amino acid bias(SINGLE). From the
correlation matrix from Figure 2.6, we can select pairs of amino acids that correlate
well (non-white squares). These pairs are referred to as DOUBLES in Table 2.6.
Further, we looked at the average correlation of all combinations from the DOUBLES
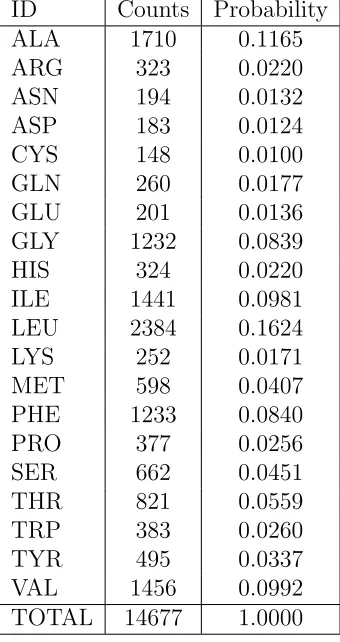
ID Counts Probability
ALA 1710 0.1165
ARG 323 0.0220
ASN 194 0.0132
ASP 183 0.0124
CYS 148 0.0100
GLN 260 0.0177
GLU 201 0.0136
GLY 1232 0.0839
HIS 324 0.0220
ILE 1441 0.0981
LEU 2384 0.1624
LYS 252 0.0171
MET 598 0.0407
PHE 1233 0.0840
PRO 377 0.0256
SER 662 0.0451
THR 821 0.0559
TRP 383 0.0260
TYR 495 0.0337
VAL 1456 0.0992
TOTAL 14677 1.0000
Table 2.3: Amino acid distribution over complete set of membrane proteins with structures
Structural and Sequence Features of Anti-Parallel Helix Dimers
The simplest transmembrane dimers are connected by a short loop and are
anti-parallel.18 By far the largest helix pair cluster is anti-parallel, with 287 members
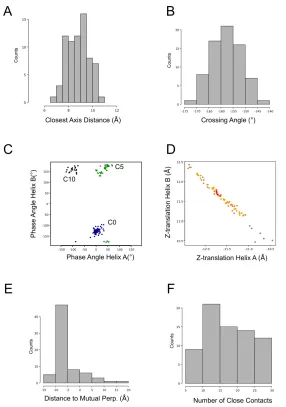
(Cluster 0, Table 2.2, Figure2.5B). The average distance between each helix (as
measured as the axis-to-axis distance) is 8.95 +/- 0.91˚A(Figure 2.7A). The angle
made by the helical axis is considered an anti-parallel left with a average value of
-157.0 +/- 6.25◦ (Figure 2.7B). Since the fitting procedure provides six degrees of
freedom, we can now analyze two other parameters: helix phase and helix shift
Figure 2.6: Amino acid correlation coefficients in membrane proteins. Darker colors represent stronger correlations than lighter colors. The x and y axis are the single letter amino acid code. The values are the correlation coefficients between the two amino acids.
clustered around 0◦ and -125◦ on helix A and helix B (Figure 2.7C, blue dots). The
Z-translation being linear shows that our windows are not offset from one another
along Z and therefore the 16-residue blocks are indeed interacting. We notice that
the point of closest approach lies within the window (values less than 0 are within
the window), as seen in Figure 2.7E, which indicates the lines made by the helix axis
of this window are parallel. In further evidence to a long, tight packing window, we
show the number of close (< 9 ˚A) contacts with in the window is mostly >10.
Upon investigation of the sequence statistics for this cluster, the position
with the highest ratio of observed to expected frequencies is residue 71 on chain
A, with a large bias for aspartates (with a bias of 3.8, Table 2.6). Membrane
pro-teins containing transmembrane aspartates are rare and these residues are usually
important for function.17 Here, these membrane proteins are mostly distally related
rhodopsins from cow to bacteria to haloarchea. However, preprotein translocase SecY
also contain this window, which indicate a wider use of aspartate in anti-parallel left
helix pairs in membrane protein structures. An interesting feature of chain B, at
position 64, is that there are 91 beta-branched (ITV) amino acids. Figure 2.8 shows
how the beta branched amino acid, valine, can serve two purposes. In panel A, it
allows for the close approach and a small residue on the opposite chain. In panel B,
the beta-branched valine packs against an aromatic amino acid.
Anti-parallel transmembrane helices can approach with left handed
cross-ings in additional ways. Two closely geometrically related clusters (see Table 2.2,
clusters 5,10) have crossing angles and axial distances, yet show a different phase
an-gle(Figure 2.7C, green and red dots). For these clusters, we see a different sequence
profile. In cluster 5, chain A, we observe the small amino acid pattern
(Small-x7-Small), followed by a large residue on the next turn up. Table 2.6, also shows
cluster 10 contains a bias on each helix for a polar position, on helix A position
63 (aspartate/asparagine) and on helix B, position 64 (cysteine/threonine/serine).
Interestingly, the cysteines at position 64 are observed 3.6 times more than expected
and are located directly in the center of the interface.
The remaining anti-parallel left clusters all have shallower inter-helical
cross-ing angles (∼ -130, clusters 6,8,11). Two of these clusters have long inter-helical dis-tances and can accommodate larger residues at the interface. Cluster 6 has a
large-xx-polar-xx-large window on both helices. The polar position is enriched in histidine
and serine over the other polar amino acids. Cluster 8 has only two significantly
bi-ased positions, one is for the interesting pair of amino acids, tryptophan/asparagine
The role of small residues in membrane protein helix interactions has been
well studied,5, 19 yet the role of large residues has not. Recently, some selection
experiments have found cation-pi interactions (involving large residues) to enhance
dimerization pointing to the importance of large residues mediating helix-helix
inter-actions.4 Here, we find a cluster that has a anti-parallel left-handed crossing angle,
yet a large inter-helical distance. This last category of anti-parallel left is found in
cluster 3, which has a crossing angle close to -170◦ and a large interhelical-distance
of 11.2˚A. This geometry creates an interface for large amino acids, as reflected by
the series of tyrosine/phenylalanine biased positions. Figure 2.9 shows how this
type of geometry can be stabilized by large residues like phenylalanine and/or other
aromatics in helix interfaces.
As helices pass back through the membrane to form anti-parallel
interac-tions, they can also approach each other with a right-handed crossing (∼150◦). The three clusters that have an anti-parallel right crossing angle (2,9,31), also have
sim-ilar distance distributions(see Table 2.2). However, each has a unique set of phase
angles. Clusters 2 and 9 have one helix containing a strong small-x3-small signature,
while the only common feature of the other helix is a beta-branched bias.
Clus-ter 9 has an enrichment of glutamines (4.0x, chain B, position 63) and other polar
residues. Cluster 31 did produce sequence profiles under the strict cutoffs used to
Structural and Sequence Features of Parallel Helix Dimers
The well studied small-xxx-small window of GpA is known from NMR
exper-iments to have a right-handed parallel crossing angle7 and the geometry has been
identified as a general folding mechanism of membrane proteins.20 The small residues
create a broad surface on the helix enabling the backbones to fit together to both
maximize van der Waals packing and make ideal C-α hydrogen bonds. We indeed
find a cluster consistent with this geometry (Cluster 4). The crossing angle is tightly
clustered near -37◦ and the interhelical distance is focused at about 7.2˚A. There
were 81 dimers that matched this geometry. The positions along the helices in this
geometry are more biased than any other cluster. Both helices contain strong
small-x3-small windows, with position 64 on helix B being particularly strong (72% of the
amino acids are glycine,alanine or serine). Slightly off the interface, bracketing the
interaction are beta-branched amino acids, one on each chain. The residue
follow-ing the second small position has a weaker, but significant bias for small residues,
suggesting the ability of this window to rotate.
The identity of helix dimer as parallel left or parallel right can be ambiguous,
as indicated by the broad, overlapping angular distributions in Figure 2.2. Even
the sequence bias of small-xxx-small is not unique to the parallel-right family, as
evidenced by the Ff bacteriophage major coat protein.21 Interestingly the parallel
left cluster found in this analysis has a long interhelical distance (∼10˚A). Figure 2.10 shows the tight packing of larger aromatic residues betweenα-helices in a membrane
environment. The sequence statistics reflect the observation of larger interhelical
distances. There is a large bias on one helix for
isoleucine-methoinine-aromatic-xx-large, while the other helix has two polar positions with asp/his/asn at 61 and
Sequence Scoring Function Derived From Fishing Data
The ultimate goal in protein folding studies is to reliably predict the
three-dimensional structure of a folded protein, given only the primary sequence.22 Here
we make in-roads into developing such capabilities for membrane proteins using helix
dimers. As discussed earlier, there are notable sequence features present in specific
clusters. For each cluster of helix dimers, we attempt to extract these sequence
features by developing a log-odds scoring system to quantify propensities for each
amino acid to appear at each position along the transmembrane region of the helices,
as described above (Equation 2.1). For any given test sequence, this scoring function
allows us to assign a scalar score for various helix positions in each cluster. Given only
an amino acid sequence, we can understand possible structural details of a helical
dimer by locating the cluster and helix positions such that the scoring function is
minimized.
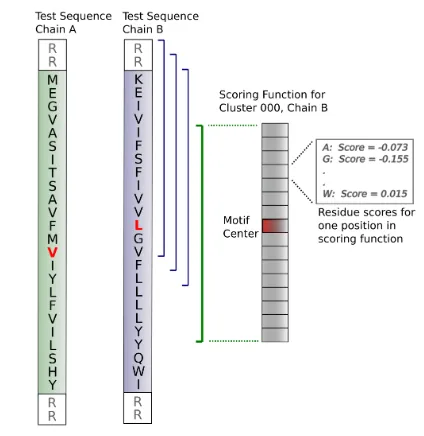
Given amino acid sequences for two transmembrane helices and the scoring
functions defined above, we compute scores for each possible threading on the
clus-ters. This threading process is described pictorially in Figure 2.11. Briefly, scores
are computed by summing the log-odds (Equation 2.1) for the 32 individual amino
acids at their corresponding positions (16 residues for each chain in the dimer). A
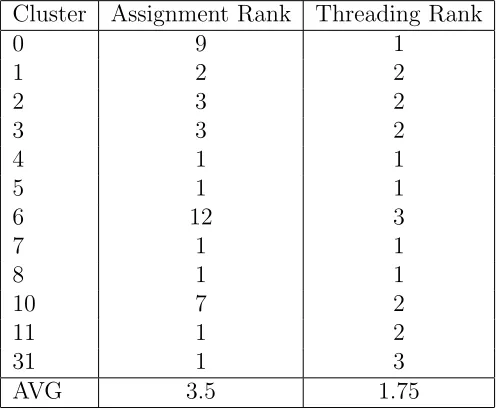
To validate the clustering and scoring systems, we scored the sequence from
a helix dimer of each cluster (the centroid sequence), as described above. Ideally,
each of these sequences would find a minimal score in its ”home” cluster with the
proper threading. The results of these tests are summarized in Table 2.4. The
centroids for four clusters (4, 5, 7, and 8) were assigned to the correct cluster with
the correct threading. Most of the other dimer sequences were threaded correctly on
at least one chain in their ”home” cluster (1 or 2 in Threading Rank, Table 2.4).
As the only parallel-right cluster, Cluster 4 is arguably the most structurally
distinct group. Figure 2.12 shows scores for the centroid sequence with all threadings
in Cluster 4. The minimal score is found at Chain A and Chain B centered at
positions 62 and 63 respectively; these positions correspond the window centers in
the scoring function. In this cluster chain B has a strong propensity for alanine
at position 68. Several positions between 62 and 71 in Chain B of the test dimer
are alanine, allowing multiple threadings to benefit from the strong propensity at
position 68. This is reflected in the low scores for chain B threadings between
positions 64 and 69.
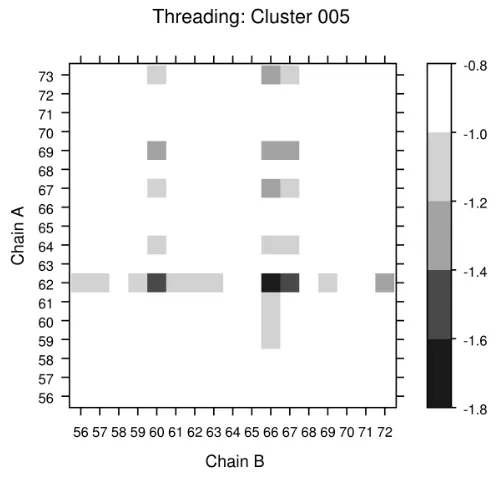
A bit more difficult task is to score a sequence known to form with
anti-parallel left geometry, because we have seven clusters with anti-anti-parallel left crossing
angles. The sequence from cluster 5 was assigned to the correct cluster with the
correct threading. Figure 2.13 shows the scores with the centroid with all threadings
in cluster 5. In addition to minimal score for Chain B at position 66, threadings at
positions 60 and 67 also show low scores. Unlike the position 68 alanine discussed
above for Cluster 4, the scores for Cluster 5 are not dominated by a single strong
propensity at one position. The low scores at these other threadings may instead
Cluster Assignment Rank Threading Rank
0 9 1
1 2 2
2 3 2
3 3 2
4 1 1
5 1 1
6 12 3
7 1 1
8 1 1
10 7 2
11 1 2
31 1 3
AVG 3.5 1.75
The Glycophorin A sequence has been analyzed using TOXCAT libraries23
and bioinformatics.9 The important sequence motif is LIxxGVxAGVxxT.
Interest-ingly, when the GpA sequence is scored with our function, it selects cluster 4, our
parallel right cluster. Further, the reason it scored well there is because each of the
GVxAG amino acids aligns along positions that are highly biased for these types
of amino acids (see Table 2.6, chain B positions 62,64,65. 61 is biased for small
residues, not shown). This is an interesting example of how we can take a sequence
not in our dataset and derive a structural model, while at the same time identifying
the important amino acids.
2.3
Conclusions
Engineering novel transmembrane proteins is one of the most intriguing
av-enues for studying protein structure and modulating function in the membrane. We
provide a computational platform for modeling and designing interfaces between
transmembrane helices. In addition we make observations about the nature of
mem-brane proteins, in terms of sequence and structural features. By constructing the
largest transmembrane pair library to date, we are able to explain in detail what
sequence features are driving the folding for the twelve most common interaction
windows in membrane proteins.
An interesting application of our sequence scoring function, is to predict
structures for unknown sequences. The proof of principle was described here, where
we were able to completely predict structures for four unique helix geometries and
we were able to predict the correct threading for a single helix in 10 out 12 cases.
This capability is good for two reasons; first we can now develop structural models
enabling the pursuit of many avenues of research and secondly, we can understand
2.4
Methods
Dataset selection
In order to create a Membrane protein dataset, the complete set of protein
crystal structures from the PDB24 must be filtered. Here we start with a published
annotated data set of membrane protein, the Orientation of Proteins in Membranes
(OPM25). The reason for using OPM is three-fold: characterization and curation of
structure files make them easier to work with, constant synchronization with PDB
keeps our database up to date and it provides definitions of membrane-spanning
residues.
The proteins in OPM must be further filtered to be fit for our purpose. As
of October 13th 2009, there were 199 proteins characterized as ”helical
transmem-brane proteins”. We obtained the highest quality memtransmem-brane protein structures by
removing structures with greater than 3.2˚A resolution, structures solved by NMR
techniques and theoretical models (a total of 70 structures). There are a
hand-ful of membrane proteins that require large numbers of ligands to function (e.g.
light-harvesting complexes). These ligands commonly interdigitate many, if not all,
helix-helix interactions and therefore should not be used in this type of analysis (5
structures). When all totaled, we have 124 membrane proteins left.
In our selected set of proteins, we have many highly homologous structures
and therefore need to identify them before pursuing any sequence analysis. Upon
applying a homology cutoff, one must select a representative protein out of the set
of homologs. Interesting to note, is that the process of identifying homologous
pro-teins must be done at the chain level, due to incorporation of unrelated subunits in
protein crystal structures. Our first rule is to look for the highest resolution
homol-ogous protein chain. If the two protein chains have comparable resolutions, then the
number of non-protein atoms, the size of the structure and the organism source is
large numbers of non-protein atoms will complicate the analysis. In order to increase
the number of possible dimers, larger proteins are preferred. Many proteins in the
database are from unusual source organisms (e.g thermophiles), in the cases where
there is a choice between mesophile and thermophile, the mesophilic proteins are
selected.
In anticipation of the need to analyze this membrane protein set at different
levels of homology, we created the lists of pdb chains under the following levels of
homology: 30%,50%,70%, 90% and 100%.
Creating the pair library
With the ultimate goal of constructing a helix pair library, we developed
methodology for creating a unique set of transmembrane helix pairs. The starting
point is a full protein structure, which contains numerous chains where each chain
includes multiple helical passes through the membrane as well as varying length loops
or full soluble domains connecting them. Therefore, the first step is to define the
boundaries for the membrane portion of each protein chain. OPM uses a complex
scoring function based on octanol to water transfer energies, to orient each
mem-brane protein in a bilayer. This orientation defines the residues that will locate in
the hydrophobic bilayer environment. We must elaborate on this, because we are
only concerned with helices and further, helices that make a full pass through the
membrane. To insure helicity, we use a generous phi-psi filter of -90◦ phi -35◦;
-70◦ psi 0◦. In order to remove single leaflet helices, we require at least 15 helical
residues. Lastly, we allow for an extra turn in the N- and C- terminal directions on
individual helices.
After defining helices properly, the complete set of pairs can be generated,
but will contain duplicates. The duplicates come from multiple chains with the same
sequence being present in protein structure files. Counting pairs within two of these
accounting for this would bias a helix pair library to those larger structures with
many identical chains. To deal with this source of redundancy, we categorize each
chain of a structure into a sequence chain group, where every chain in the group has
99% sequence identity. Then, we simply have 3 types of dimers: inter-chain(pairs
within a representative chain from each chain group), inter-group(pairs between
distinct chain groups) and intra-group (pairs between chains of the same group).
Structural Clustering
In order to generate clusters, where geometrically identical interactions can
be grouped, we perform an all-on-all structural alignment of helix pairs. First, for
each helix pair, we create a list of all possible windows (two continuous blocks of 16
amino acids, one per helix, see Figure 2.1B). For example, if there are N 16 amino
acid blocks on one helix and M 16 amino acid blocks on another helix, then this
helix pair has N*M possible helix windows. Next, we compare each helix pair to
every other helix pair by structurally aligning the listed windows. We structurally
align the C-α atoms of one window from one helix pair onto another set of C-α
atoms of another window from another helix pair. This process results in a table of
C-α RMSDs from each window on one helix pair to every other window on every
other helix pair. If we had two helix pairs, one with I windows and one with J
windows, then the RMSD table would have 2*(I*J) entries, because each
window-window alignment can be done in two ways (e.g. helixA of helix pair 1 can align
onto helixA of helix pair 2 OR helixA of helix pair 1 can align onto helixB of helix
pair 2)
Using the RMSD table, we group the helix pairs by the windows that match
the most other windows. We find the window (and therefore helix pair) with the
maximal number of windows from other helix pairs that have <= 1.2˚AC-α RMSD.
The helix pair associated with this window is considered the centroid of a new formed
windows that matched the centroid, under the 1.2˚AC-α RMSD threshold. Once the
windows are clustered they are eliminated from further cycles of the algorithm. We
additionally eliminate windows close-by the clustered window in sequence (+/- four
residues). The algorithm then repeats until there are no helix pairs remaining.
Structural Fishing
The clustering algorithm described above produced distinct clusters without
re-lying on any a priori knowledge of the structural features of these clusters. This
pro-duced several dozen clusters. We examined the structural parameters of the largest
twelve clusters and found them to possess distinct structural features. However, the
disadvantage of this approach is that the structural and sequence information in all
dimers in the smaller clusters was essentially discarded.
The goal of the structural fishing experiment was to expand the dataset and
offer more robust statistics by bringing all dimers into one of the top twelve clusters
and to avoid discarding members of the small clusters. For the fishing operation, we
started with 12 bait dimers. Each bait structure was the centroid dimer from one of
the twelve largest original clusters; this assures that the baits for each fishing cluster
are structurally distinct. We extracted a central window of 16 residues from each
chain of the bait dimers. Next, we looped through all the dimers in the dataset.
For each of these test dimers, we superposed a sliding 12-residue window over all
possible 12-residue windows in each 16-residue bait structure. Each test dimer was
assigned to the cluster whose centroid matched most tightly. The result of the fishing
experiment was fewer and larger clusters.
Sequence Analysis
We generated sequence scoring functions from the enhanced statistics yielded
by the fishing operation. First, all the sequence positions were renumbered such
position 60. Given this numbering, all sequences for each chain and cluster were
aligned. The number of observations for each amino acid type was computed for each
position. These were combined with the expected amino acid probabilities according
to Equation 2.1 to generate scores for each amino acid type at all positions of interest
for chains A and B of each cluster. These scoring functions were saved in an XML
file.
To score a single sequence with a given threading, a contiguous block of
residues in the test sequence was scored against a specific window in the scoring
function. The scoring function window was a block of 16 residues centered on the
most populated position for the given chain and cluster. (Histograms of the
popula-tions were various posipopula-tions are shown for two clusters in Figure 5.) Each test dimer
was scored against every cluster using all available threadings on both the A and B
chains. Furthermore, the calculation was expanded to support 2 threadings beyond
the start and end edges of the TM sequence data. Arginines were placed in the edge
positions for purposes of scoring, as shown in Figure 11. The cluster/threading
com-bination producing the lowest score was located; this optimal result is the structural
cluster assignment and threading predicted by the scoring system.
Acknowledgements
Bryan Fry and William F. DeGrado are co-authors of this manuscript. I’d also
Table 2.5:
PDB Inter-chain
Inter-chaingroup
Intra-chaingroup
Sum
1ar1 39 0 5 44
1bcc 12 0 9 21
1dxr 8 0 9 17
1e12 12 4 0 16
1ehk 29 0 7 36
1eys 8 0 9 17
1gzm 17 0 0 17
1h2s 14 2 4 20
1h68 13 0 0 13
1hgz 0 2 0 2
1ifp 0 1 0 1
1j4n 5 11 0 16
1jb0 28 0 13 41
1kb9 12 2 8 22
1kf6 5 0 5 10
1kpl 36 9 0 45
1kqf 4 0 2 6
1l0l 12 0 11 23
1l7v 23 3 0 26
1ldf 9 11 0 20
1m0l 12 3 0 15
1m56 42 0 16 58
PDB Inter-chain
Inter-chaingroup
Intra-chaingroup
Sum
1okc 9 0 0 9
1orq 3 3 0 6
1ors 6 0 0 6
1ots 32 6 0 38
1p49 1 0 0 1
1pp9 13 2 9 24
1py6 12 0 0 12
1q16 5 2 0 7
1q90 6 2 25 33
1qle 36 0 16 52
1r3j 3 4 0 7
1rc2 8 10 0 18
1rh5 21 0 7 28
1rzh 8 0 9 17
1s5h 3 4 0 7
1sor 8 11 0 19
1su4 19 0 0 19
1t5s 19 0 0 19
1u7g 24 9 0 33
1v55 37 0 36 73
1vgo 12 0 0 12
1wpe 20 0 0 20
1wpg 19 0 0 19
1xio 12 0 0 12
PDB Inter-chain
Inter-chaingroup
Intra-chaingroup
Sum
1yce 1 3 0 4
1yew 14 0 8 22
1ymg 5 11 0 16
1yq3 5 0 3 8
1z98 9 11 0 20
1zcd 20 0 0 20
1zoy 5 0 3 8
2a65 37 2 0 39
2a79 4 5 6 15
2agv 19 0 0 19
2ahy 3 3 0 6
2b2f 27 10 0 37
2b6o 7 10 0 17
2b6p 5 11 0 16
2bl2 6 3 0 9
2bs2 6 4 0 10
2bs3 6 4 0 10
2cfq 22 0 0 22
2d57 9 11 0 20
2e74 6 2 25 33
2ei4 12 2 0 14
2f2b 10 12 0 22
2fyn 12 2 7 21
2gif 28 9 0 37