SUPPLEMENT ARTICLE
Infant Feeding Practices Study II: Study Methods
Sara B. Fein, PhDa, Judith Labiner-Wolfe, PhDa, Katherine R. Shealy, MPH, IBCLC, RLCb, Rouwei Li, MD, PhDb, Jian Chen, MScb, Laurence M. Grummer-Strawn, PhDb
aCenter for Food Safety and Applied Nutrition, Food and Drug Administration, College Park, Maryland;bDivision of Nutrition, Physical Activity, and Obesity, Centers for
Disease Control and Prevention, Atlanta, Georgia
The authors have indicated they have no financial relationships relevant to this article to disclose.
ABSTRACT
OBJECTIVE.Our goal is to describe the methods used in the Infant Feeding Practices Study II (IFPS II), a study of infant feeding and care practices throughout the first year of life. Survey topics included breastfeeding, formula and complementary feeding, infant health, breast-pump use, food allergies, sleeping arrangements, moth-er’s employment, and child care arrangements. In addition, mothers’ dietary intake was measured prenatally and postnatally.
PARTICIPANTS AND METHODS.The IFPS II sample was drawn from a nationally distributed consumer opinion panel of 500 000 households. All questionnaires were adminis-tered by mail, 1 prenatally and 10 postpartum. Qualifying criteria were used to achieve the sample goals of mothers of healthy term and late preterm singleton infants. In addition to the questionnaires about the infants, women were sent a
diet-assessment questionnaire prenatally and at ⬃4 months after delivery; this
questionnaire was also sent to members of a comparison group who were neither pregnant nor postpartum.
RESULTS.A sample of 4902 pregnant women began the study, and⬃2000 continued through their infant’s first year. Response rates ranged from 63% to 87% for the different questionnaires. Compared with adult mothers of singletons from the na-tionally representative sample of the National Survey of Family Growth, IFPS II participants had a higher mean education level; were older; were more likely to be middle income, white, and employed; were less likely to smoke; and had fewer other children. Compared with women who participated in the National Immunization Survey who gave birth in 2004, IFPS II mothers were more likely to breastfeed and to breastfeed longer.
CONCLUSIONS.The IFPS II provides a valuable database because of its large sample size, the frequency of its questionnaires, and its wide coverage of issues salient to infant
feeding.Pediatrics2008;122:S28–S35
T
HE INFANT FEEDINGPractices Study II (IFPS II) is a longitudinal study of women from late pregnancy through their infant’s first year of life. It is a follow-up to the IFPS I, conducted by the US Food and Drug Administration (FDA)in 1992–1993, which provided detailed information about general infant feeding patterns and infant health.1–13In the
approximate decade since the original study, there have been significant changes in the products, policies, informa-tion, and education related to infant feeding choices. For example, breast pumps have become more effective and more affordable for individuals, new ingredients have been added to infant formula, changes in state and federal laws have reduced the barriers that women face in choosing to breastfeed, and policies and recommendations about infant feeding have changed. In addition, research has more clearly defined the health benefits of breastfeeding for infants
in developed countries,14and new breastfeeding-promotion campaigns have been conducted.
The IFPS II was conducted to better understand the infant feeding practices used by women in the United States in the context of these changes. The study was designed to obtain detailed information about the feeding patterns of infants during their first year of life, along with information about the infants’ health, factors that may affect the infants’ feeding, and information about the mothers’ health and diet. The study was also designed to serve as a
component in evaluation of the National Breastfeeding Awareness Campaign.15
The IFPS II was conducted by the FDA in collaboration with the Centers for Disease Control and Prevention (CDC). It was guided by a working group with representatives from the funding agencies within the Department of Health and Human Services (FDA, CDC, Office of Women Health [Department of Health and Human Services],
Eunice Kennedy ShriverNational Institute of Child Health and Human Development, Office of Dietary Supplements, and National Cancer Institute [National Institutes of Health], and the Maternal and Child Health Bureau [Health
www.pediatrics.org/cgi/doi/10.1542/ peds.2008-1315c
doi:10.1542/peds.2008-1315c
The findings and conclusions in this report are those of the authors and do not necessarily represent the official position of the Food and Drug Administration or the Centers for Disease Control and Prevention.
Key Words
breastfeeding, bottle feeding, infant nutrition, physiology, infant care
Abbreviations
IFPS—Infant Feeding Practices Study FDA—Food and Drug Administration CDC—Centers for Disease Control and Prevention
WIC—the Special Supplemental Nutrition Program for Women, Infants, and Children DHQ—Diet History Questionnaire NSFG—National Survey of Family Growth NIS—National Immunization Survey
Services and Resources Administration]. In addition, sci-entists from the US Department of Agriculture and from academia served on the working group. The group in-cluded experts in nutrition, general and neonatal pedi-atrics, demography, study design, dietary assessment, food allergies, breast pump regulation, infant formula regulation, infant sleep arrangements, breastfeeding and employment issues, and other topics.
PARTICIPANTS AND METHODS
Longitudinal data were collected with a prenatal ques-tionnaire; a short telephone interview near the time of the infant’s birth; a neonatal questionnaire sent when
the infant was ⬃1 month old; and 9 questionnaires
about infant feeding, health, care, and related issues sent approximately monthly during infant ages 2 to 7 months and then approximately every 7 weeks until the infant was 12 months old. In addition, the study included 2 maternal dietary assessments, one during late pregnancy
and a second one⬃4 months after delivery, and a
sep-arate dietary assessment (for comparative purposes) of a sample of women of childbearing age who were neither pregnant nor postpartum.
Sample
The study sample consisted of⬃4900 pregnant women,
⬃2000 of whom continued with the study through their
infant’s first year. Data were collected from May 2005 through June 2007.
The sampling frame for the IFPS II was a nationally
distributed consumer opinion panel of⬎500 000
house-holds. A panel is the most efficient way to identify a nationally distributed sample of pregnant women who are likely to complete repeated questionnaires. The management of the consumer opinion panel that served as the sampling frame updates information on preg-nancy status of household members, as well as house-hold demographic information, quarterly for approxi-mately one fourth of the total panel. Because of the timing of the pregnancy-update information, current information was not available for all households at the same time. Therefore, questionnaires had to be mailed over a period of 8 months to obtain the desired sample size. All women identified as being in their third trimes-ter of pregnancy were included in the mailings.
Qualifying criteria on the birth screener were that neither the mother nor the infant could have a medical condition at birth that would affect feeding and that the infant had to have been born after at least 35 weeks’ gestation, weigh at least 5 lb, be a singleton, and not
have stayed in intensive care for⬎3 days.
After the birth screener, infant-mother pairs were disqualified if the infant was reported to have a serious, long-term health problem that would affect feeding. Each questionnaire asked about such problems, and the reported problems were evaluated by the same physician who performed this evaluation for the IFPS I and by a pediatrician and a maternal and child health expert. Women were excluded from the sample if 2 of these 3 evaluators thought that their infant had an illness or
condition that would affect their feeding behavior. In addition, respondents were excluded from the sample if they lived in a zip code to which the US Postal Service stopped delivering mail as a result of the 2005 Gulf Coast hurricanes. Exclusions because of this mail disruption affected respondents in the prenatal through month-4 questionnaires.
In our analyses, we included data from respondents who were eventually disqualified from further partici-pation in the study through the questionnaire on which they were disqualified. For example, we included data from the prenatal questionnaire and birth screeners for women who were excluded from responding to the neo-natal questionnaires because they reported having a long-term health problem that would affect feeding. Ex-clusion criteria and the number of women disqualified for each reason are provided in Tables 1 and 2.
Questionnaire Development
All questionnaires were developed by the FDA in collab-oration with the CDC and members of the working group who had specific expertise in each topic. To the extent possible, questions were taken from the IFPS I. The postpartum depression scale, which was not in-cluded in the IFPS I, is a previously validated assessment
for self-completion.16 Before being added to the IFPS II
questionnaires, new questions were tested in a series of cognitive interviews with respondents drawn mostly from the consumer opinion panel. Four pilot tests were mailed to a sample of women in the consumer opinion panel whose infants were prenatal, neonatal, in early infancy, and in late infancy. The use of panel members to test questionnaires was important to ensure that the questions and layout were clear to the women who would compose the study sample. An important charac-teristic of panel members is that they all have at least moderate literacy, and they develop experience com-pleting questionnaires. Therefore, the questions could be written at a higher literacy level than would be appro-priate for a general population sample. All question-naires, other materials sent to respondents, and proce-dures were approved by the FDA’s Research Involving Human Subjects Committee (the institutional review board) and the US Office of Management and Budget.
infants. The neonatal questionnaire was used to collect information about the mothers’ birth experience; breast-feeding practices and problems; breastbreast-feeding support received in the hospital and after discharge; knowledge of, attitudes toward, and confidence in breastfeeding; planned duration of breastfeeding; reasons for not trying to breastfeed; and formula-feeding practices. It also asked about the infants’ dietary consumption through a food-frequency checklist, consumption of dietary sup-plements and herbs, and jaundice and its treatment.
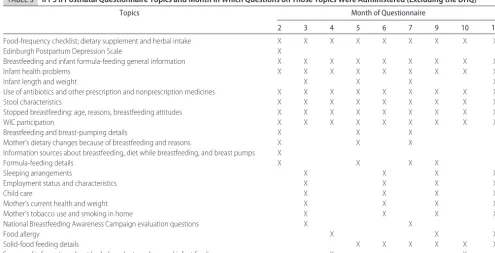
Every postnatal questionnaire included questions about the frequency with which the infants received foods from various food groups (eg, breast milk, formula, fruits, vegetables, cereals); vitamin, mineral, and herbal supplements given to infants; formula feeding and breastfeeding; infant illnesses and health measures; and the mothers’ participation in WIC. Periodically during the infants’ first year, additional details were collected about breastfeeding and formula feeding, maternal em-ployment, child care, sleeping arrangements, food aller-gies, the mothers’ awareness of the National Breastfeed-ing Awareness Campaign, and the mothers’ sources of information about infant feeding. Table 3 lists the topics and indicates when the set of questions about each was administered.
To assess the mothers’ dietary intake, the IFPS II used a modified version of the Diet History Questionnaire (DHQ), a food-frequency measure developed by the
Na-tional Cancer Institute.17–20 Modifications included
changing the time frame of the DHQ from 1 year to 1 month and adding specific foods of interest for pregnant women, including specific types of fish and specific di-etary supplements.
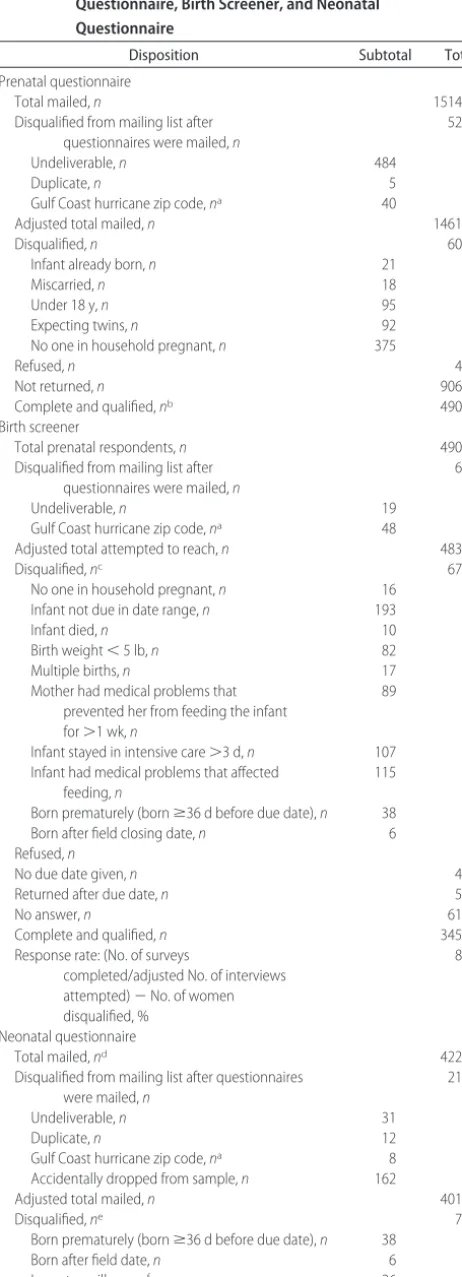
TABLE 1 Disposition of the IFPS II Sample for the Prenatal Questionnaire, Birth Screener, and Neonatal Questionnaire
Disposition Subtotal Total
Prenatal questionnaire
Total mailed,n 15147
Disqualified from mailing list after questionnaires were mailed,n
529
Undeliverable,n 484
Duplicate,n 5
Gulf Coast hurricane zip code,na 40
Adjusted total mailed,n 14618
Disqualified,n 601
Infant already born,n 21
Miscarried,n 18
Under 18 y,n 95
Expecting twins,n 92
No one in household pregnant,n 375
Refused,n 46
Not returned,n 9069
Complete and qualified,nb 4902
Birth screener
Total prenatal respondents,n 4902
Disqualified from mailing list after questionnaires were mailed,n
67
Undeliverable,n 19
Gulf Coast hurricane zip code,na 48
Adjusted total attempted to reach,n 4835
Disqualified,nc 673
No one in household pregnant,n 16 Infant not due in date range,n 193
Infant died,n 10
Birth weight⬍5 lb,n 82
Multiple births,n 17
Mother had medical problems that prevented her from feeding the infant for⬎1 wk,n
89
Infant stayed in intensive care⬎3 d,n 107 Infant had medical problems that affected
feeding,n
115
Born prematurely (bornⱖ36 d before due date),n 38
Born after field closing date,n 6
Refused,n 4
No due date given,n 46
Returned after due date,n 58
No answer,n 618
Complete and qualified,n 3452
Response rate: (No. of surveys
completed/adjusted No. of interviews attempted)⫺No. of women disqualified, %
82.9
Neonatal questionnaire
Total mailed,nd 4226
Disqualified from mailing list after questionnaires were mailed,n
213
Undeliverable,n 31
Duplicate,n 12
Gulf Coast hurricane zip code,na 8
Accidentally dropped from sample,n 162
Adjusted total mailed,n 4013
Disqualified,ne 70
Born prematurely (bornⱖ36 d before due date),n 38
Born after field date,n 6
Long-term illness,nf 26
TABLE 1 Continued
Disposition Subtotal Total
Refused,n 23
Not returned,n 890
Complete and qualified,n 3033
Response rate: (No. of surveys
completed/adjusted No. mailed⫺No. of women disqualified), %
76.9
aSample members were excluded from the remainder of the study if they resided in the zip codes to which the US Postal Service stopped delivery as a result of the 2005 Gulf Coast hurri-canes.
bResponse rates for the prenatal questionnaire could not be calculated because only eligible respondents returned the questionnaire. The likely number ineligible could not be estimated because women could be disqualified for multiple reasons and data showing how these criteria overlap are not available.
cWhen a respondent was disqualified on the birth screener for a specific reason, the remaining potential disqualifying conditions were not assessed. The conditions are listed in the order in which they were asked on the questionnaire, beginning with multiple births. Respondents were not asked whether their infant had died, but they were expected to give this information if their infant had died.
dMothers who could not be reached for the birth screener by telephone or an interactive voice-response interview were mailed a neonatal questionnaire and birth screener at the same time. Therefore, some mothers who did not complete a birth screener were mailed a neonatal questionnaire.
Survey Methods
The prenatal questionnaire was mailed to all women in
the panel database who were⬃7 months pregnant at the
time. It served as the recruitment instrument and was mailed with a brochure explaining the study and a short screening questionnaire, which established that some-one in the household was pregnant, at least 18 years old, and expecting a singleton. Although household
demo-graphic information was available for all households in the panel database, data on race, education, marital sta-tus, and employment status were available only for the person designated as the panel member and that per-son’s spouse. If the mother was not the panel member but was identified because she lived in a panel member’s household, she was sent a short demographic question-naire.
TABLE 2 Disposition of the IFPS II Sample on the Postnatal Questionnaires
Disposition Month Total Birth
Screener-Month 12d
2 3 4 5 6 7 9 10 12
Total mailed,na 3096 3045 3021 3008 2982 2970 2939 2902 2850
Disqualified from mailing list after questionnaires were mailed,n
22 20 25 21 28 37 36 47 48
Undeliverable,n 9 9 17 20 28 36 35 46 48 144
Accidentally dropped from sample,n 2 1 1 0 1 1 1 0 169
Gulf Coast hurricane zip code,nb 11 11 7 0 0 0 0 0 0 81
Adjusted total mailed,n 3074 3025 2996 2987 2954 2933 2903 2855 2802
Disqualified,n 2 0 0 2 0 0 0 0 0 554c
Infant died,n 1 0 0 0 0 0 0 0 0 11
Long-term illness,n 1 0 0 2 0 0 0 0 0 29
Refused,n 1 5 2 4 7 13 11 25 0 94
Not returned,n 519 632 756 798 852 900 948 1022 995
Complete and qualified,n 2552 2388 2238 2183 2095 2020 1944 1808 1807
Response rate: (No. of surveys
completed/adjusted No. mailed⫺No. of women disqualified), %
83.1 78.9 74.7 73.1 70.9 68.9 67.0 63.3 64.5
aThe number of questionnaires mailed decreased slightly across the months because of disqualifications on earlier questionnaires. However, the questionnaires were mailed so close in time to each other that sometimes the subjects who disqualified could not be removed from the sample before the next mailing. Therefore, some subjects who did not qualify were mailed questionnaires each month.
bSample members were excluded from the remainder of the study if they resided in the zip codes to which the US Postal Service stopped delivery as a result of the 2005 Gulf Coast hurricanes. cIncludes all disqualification categories, beginning with the birth screener.
dThe total number includes cases from the Birth Screener and the Neonatal Questionnaire as listed in Table 1.
TABLE 3 IFPS II Postnatal Questionnaire Topics and Month in Which Questions on Those Topics Were Administered (Excluding the DHQ)
Topics Month of Questionnaire
2 3 4 5 6 7 9 10 12
Food-frequency checklist; dietary supplement and herbal intake X X X X X X X X X
Edinburgh Postpartum Depression Scale X
Breastfeeding and infant formula-feeding general information X X X X X X X X X
Infant health problems X X X X X X X X X
Infant length and weight X X X X
Use of antibiotics and other prescription and nonprescription medicines X X X X X X X X X
Stool characteristics X X X X X X X X X
Stopped breastfeeding: age, reasons, breastfeeding attitudes X X X X X X X X X
WIC participation X X X X X X X X X
Breastfeeding and breast-pumping details X X X
Mother’s dietary changes because of breastfeeding and reasons X X X
Information sources about breastfeeding, diet while breastfeeding, and breast pumps X
Formula-feeding details X X X X
Sleeping arrangements X X X X
Employment status and characteristics X X X X
Child care X X X X
Mother’s current health and weight X X X X
Mother’s tobacco use and smoking in home X X X X
National Breastfeeding Awareness Campaign evaluation questions X X
Food allergy X X X
Solid-food feeding details X X X X X X
Sources of information about herbal products and general infant feeding X X
A subsample of ⬃1500 respondents completed a modified DHQ prenatally and again when their infants
were ⬃4 months old. The prenatal DHQ was sent to
women who returned the study-intake questionnaire (the prenatal questionnaire) early enough for them to complete the DHQ before their infants were born; mail-ing dates were between May and August 2005. The postpartum DHQ was mailed to women who returned the month 3 questionnaire promptly, because the moth-ers would also receive another questionnaire when their infants were 4 months old, and we wanted the maxi-mum possible separation between the questionnaires to distribute respondent burden over time. The postpartum DHQ was mailed between September 2005 and February 2006. It was not possible to match season for the preg-nant and postpartum women, because the 2 data collec-tions were only 4 to 5 months apart. A total of 877 women completed both the prenatal and postpartum DHQs.
The DHQ comparison group was drawn from the same consumer opinion panel from which the study sample was drawn. A sample of 7830 women aged 18 to 40 years was sent a screener asking them to verify their age, that they were not pregnant, and that they had not had an infant in the previous 12 months and to respond to 2 questions about food-safety issues. Of 3361 ques-tionnaires returned by the cutoff date, 2070 were from women who met the comparison-group criteria. The DHQ was mailed to all women who qualified for the comparison group. The mailing was timed to correspond with the season of the prenatal DHQ: June and July of 2006.
About the time of their infant’s birth, prenatal re-spondents received a short telephone birth-screener in-terview to establish their infant’s birthday and gather the information needed to determine if they met the quali-fying criteria. If a household could not be reached by telephone, the respondent was sent a postcard asking her to call a telephone number for an interactive voice-response survey that duplicated the telephone birth screener. If a household was not reached by either of these methods, the respondent was sent a printed birth screener along with the neonatal questionnaire at the time (infant age 1 month) she would have been sent this questionnaire if her infant was born on time.
Consistent with panel policy, respondents were given a small gift for completing each questionnaire. For all questionnaires except the DHQ, the gift cost less than $3.00. The gift was sometimes for the mother (eg, a water bottle or picture frame) and sometimes for the infant (eg, a rattle, toy keys, or rubber duck). For the DHQ, respondents received a $10.00 cash incentive.
Response Rates and Age of Infants at Questionnaire Completion
We calculated a response rate for each questionnaire except the prenatal one. A response rate for the prenatal questionnaire could not be calculated because, except in a few instances, only qualifying but not disqualifying house-holds returned it. Women could be disqualified from the study for any of several reasons at this prenatal stage (as
listed in Table 1). Because combinations of the reasons sometimes occur, it was not possible to sum estimates of the occurrences of single conditions to estimate how many nonrespondents did not qualify for the study.
The response rates for the other questionnaires were based on the number of questionnaires mailed (or num-ber of interviews attempted for the birth screener). In addition to meeting the qualifying conditions listed in Tables 1 and 2, women had to have completed a prenatal questionnaire to be in the sample for the birth screener and the neonatal questionnaire, and they had to have completed a neonatal questionnaire to be in the sample for the postnatal questionnaires. Of 4902 women who completed the prenatal questionnaire, 3033 completed the neonatal questionnaire. This latter number, less the number of women lost to follow-up or disqualified later in the study, was the number of women sent postnatal questionnaires for the remainder of the study. Respon-dents were not excluded for failing to respond to 1 or more of the postnatal questionnaires.
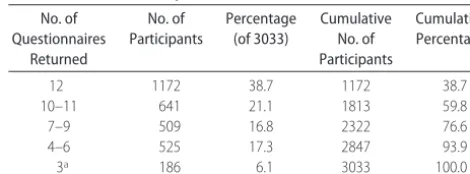
Response rates ranged from 63% to 83% for the various questionnaires, as shown in Table 2. Table 4 shows how many mothers completed each number of questionnaires; for example, it shows that 1813 com-pleted at least 10 of the 12 questionnaires. The response rates for the DHQ are shown in Table 5.
Sample Characteristics
Although each questionnaire targeted women with in-fants of a specific age, the inin-fants’ age when the ques-tionnaire was completed did not always match this age for 3 reasons. First, the procedure of mailing a birth screener along with a neonatal questionnaire to families who could not be reached by telephone resulted in infants being both older and younger than the target age when the neonatal questionnaires were completed. Al-though we attempted to move the infants into the cor-rect age group, our ability to do so was limited, because we were concerned that too close administration of mul-tiple questionnaires would result in dropping out of the study. Second, because the questionnaires were only mailed twice per month, some infants were a little younger and some a little older than the target age at the time of the mailing. Third, the mothers did not always complete the questionnaire as soon as they received them. Table 6 shows the target age of the infants when each questionnaire was mailed and the age distribution
TABLE 4 Distribution of the Number of Questionnaires Returned by IFPS II Participants
No. of Questionnaires
Returned
No. of Participants
Percentage (of 3033)
Cumulative No. of Participants
Cumulative Percentage
12 1172 38.7 1172 38.7
10–11 641 21.1 1813 59.8
7–9 509 16.8 2322 76.6
4–6 525 17.3 2847 93.9
3a 186 6.1 3033 100.0
of the infants when the questionnaires were completed; although the median ages match the target ages well, the 10th and 90th percentiles show that some infants were considerably older or younger than the target age when their mothers returned the questionnaires.
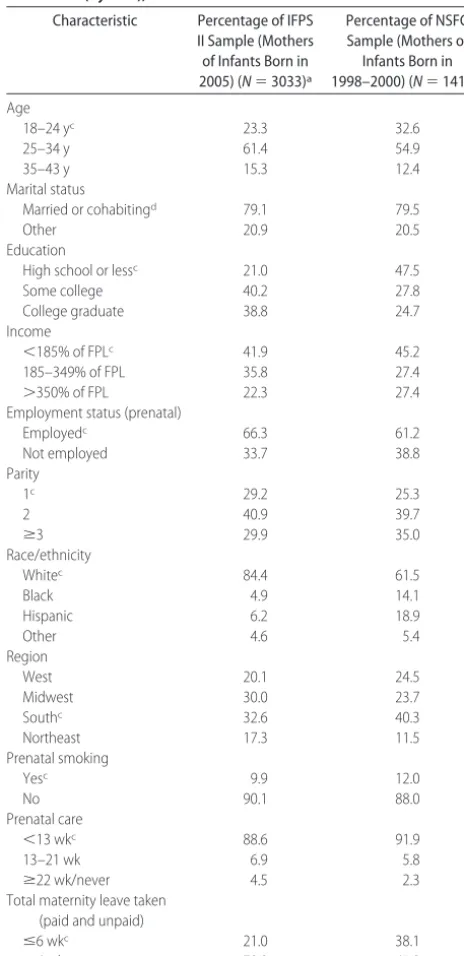
Table 7 compares the distribution of select character-istics among respondents to the neonatal questionnaire and women in the National Survey of Family Growth (NSFG) cycle 6 (1998 –2000) who were aged 18 to 44 years at the time of their most recent singleton delivery. Members of the IFPS II sample were older, more highly educated, and less likely to have low income than those in the random sample. In addition, the IFPS II partici-pants were more likely to be employed and white, had fewer other children, were less likely to be from the South, were less likely to smoke, took longer maternity leave, and received their first prenatal care a little later in pregnancy.
Because breastfeeding rates and duration have changed in recent years, we compared the IFPS II
breast-feeding characteristics with those from a nationally rep-resentative survey more recent than the NSFG: the Na-tional Immunization Survey (NIS) sample of women
TABLE 5 Disposition of IFPS II Sample and Comparison Group on the DHQs Disposition Prenatal DHQ Postnatal DHQ Comparison DHQa
Total mailed,nb 1757 1791 2070
Respondent removed from mailing list after questionnaires were mailed,n
8 6 0
Undeliverable 8 5 0
Gulf Coast hurricane zip codec 0 1 0
Adjusted total mailed,n 1749 1785 2070
Respondent not pregnant (prenatal only),n
3 0 0
Refused,n 0 2 0
Not returned,n 244 300 505
Completed and returned,n 1502 1483 1565
Response rate (No. completed/adjusted total No. mailed), %
85.9 83.1 75.6
aThe comparison sample was drawn from the same consumer opinion panel as that for the IFPS II respondents; sample members were neither pregnant nor postpartum.
bThe DHQs were sent only to a subsample of the IFPS II respondents.
cSample members were excluded from the remainder of the study if they resided in zip codes to which the US Postal Service stopped delivery as a result of the 2005 Gulf Coast hurricanes.
TABLE 6 Infants’ Age (or Gestational Age) When the IFPS II Questionnaires Were Completed
Questionnaire Target Age, wk 50th Percentile 10th Percentile 90th Percentile
Prenatal 28–32 30.4 26.4 33.4
Birth Screener 1.0 2.0 0.3 7.6
Neonatal 4.3 4.6 2.6 8.1
Month 2 8.6 9.1 7.4 13.1
Month 3 12.9 12.9 11.6 16.0
Month 4 17.2 17.4 16.1 19.7
Month 5 21.5 21.4 20.1 23.7
Month 6 25.8 26.3 25.1 28.4
Month 7 30.1 31.4 30.1 34.0
Month 9 38.7 38.4 37.1 41.0
Month 10 45.1 45.6 44.1 48.3
Month 12 53.0 54.3 53.0 57.0
TABLE 7 Distribution of Select Characteristics Among Participants in the IFPS II and Among Participants in the NSFG (Cycle 6), 2002
Characteristic Percentage of IFPS II Sample (Mothers of Infants Born in 2005) (N⫽3033)a
Percentage of NSFG Sample (Mothers of Infants Born in 1998–2000) (N⫽1415)b
Age
18–24 yc 23.3 32.6
25–34 y 61.4 54.9
35–43 y 15.3 12.4
Marital status
Married or cohabitingd 79.1 79.5
Other 20.9 20.5
Education
High school or lessc 21.0 47.5
Some college 40.2 27.8
College graduate 38.8 24.7
Income
⬍185% of FPLc 41.9 45.2
185–349% of FPL 35.8 27.4
⬎350% of FPL 22.3 27.4
Employment status (prenatal)
Employedc 66.3 61.2
Not employed 33.7 38.8
Parity
1c 29.2 25.3
2 40.9 39.7
ⱖ3 29.9 35.0
Race/ethnicity
Whitec 84.4 61.5
Black 4.9 14.1
Hispanic 6.2 18.9
Other 4.6 5.4
Region
West 20.1 24.5
Midwest 30.0 23.7
Southc 32.6 40.3
Northeast 17.3 11.5
Prenatal smoking
Yesc 9.9 12.0
No 90.1 88.0
Prenatal care
⬍13 wkc 88.6 91.9
13–21 wk 6.9 5.8
ⱖ22 wk/never 4.5 2.3
Total maternity leave taken (paid and unpaid)
ⱕ6 wkc 21.0 38.1
⬎6 wk 79.0 61.9
FPL indicates federal poverty level.
aSample sizes vary slightly because of missing data on some variables.
bThe NSFG sample was limited to most recent singleton live births to women 18 to 44 years old at delivery. Weighted percentages are reported.
cttests were conducted to evaluate the differences between NSFG and IFPS characteristics, which required that all variables be dichotomized. Multilevel variables were categorized by keeping 1 category and collapsing all others. Thebfor multilevel variables indicates the cate-gory that was kept and that it was significantly different across the 2 samples atP⬍.05. For dichotomous variables, thebindicates that the variable was significantly different across sam-ples.
who gave birth in 2004.21 The rates were as follows:
never breastfed, 26.2% (NIS) and 14.7% (IFPS II); any breastfeeding at 6 months, 41.5 (NIS) and 49.6% (IFPS II); any breastfeeding at 12 months, 20.9% (NIS) and 25.3% (IFPS II). These differences, all of which were statistically significant, indicate that, on average, IFPS II mothers breastfed longer than mothers in the general population.
Data Preparation
We cleaned the data to adjust for inconsistent, conflict-ing, and implausible responses. For example, if a respon-dent said that she did not use formula but then indicated which brand, type, and number of ounces her infant consumed, we corrected her response to indicate that she used formula. Or, if a respondent said that the in-fant’s father had a certain health condition but also answered that “none” of the infant’s relatives had the health condition, we corrected the “none” from “marked” to “not marked.” If a response was clearly implausible, we changed it to “missing.” Variables exam-ined for implausible responses included mothers’ weight and height, number of teeth infant has, and other bio-logical variables. If a respondent was supposed to skip a set of questions but answered a few of them, we reset the responses to “skipped.” We also sometimes imputed missing data, most frequently the date the questionnaire was completed, by which we calculated infants’ age when the questionnaire was completed and age of the infant when the mother stopped breastfeeding. The data-collec-tion contractor indicated on each quesdata-collec-tionnaire when the questionnaire was mailed and when it was returned to the facility. If a respondent failed to write in the date that she completed a questionnaire, we imputed the date mostly on the basis of the average number of days between completion of the questionnaire and the data contrac-tor’s receipt of the questionnaire among respondents who filled in the completion date. If a previously breast-feeding mother indicated on a food-frequency question that the infant did not receive breast milk but did not report when she stopped breastfeeding, we used the mean infant age between the time the infant was last reported as breastfeeding and the age at which the infant was first reported to not be breastfeeding.
DISCUSSION
The results of the IFPS II provide valuable data on infant feeding because of the frequency of its questionnaires and its wide coverage of salient issues. Other national surveys that have addressed at least some components of
infant feeding include the NIS,21 the NSFG,22 the
Na-tional Health and Nutrition Examination Survey,23 the
Abbott’s Ross Mothers Survey,24and the Feeding Infants
and Toddlers Study.25Although all of these surveys
con-tribute to knowledge about how American infants are fed, each has at least 1 of the following limitations: a focus only on milk feeding; a relatively small sample size; no information on infant feeding during the infants’ first months of life; assessment of infants’ food intake at only 1 point in time; and little information about the deter-minants of feeding choices or about infants’ health.
The main strengths of the study include its prospec-tive design, the extensive testing of survey questions, the detail of the data collected about the infants’ feeding patterns and the frequency with which data were col-lected, the inclusion of questions that address most topic areas likely to affect infant feeding, and the large sample size. In addition, the maternal dietary-intake data were based on an established dietary-intake instrument, and the high response rate for the postnatal questionnaires enabled the analysis of detailed longitudinal data.
The main limitation of the study is that the sample, although well distributed throughout the United States, was not representative of the US population. Although a random sample of pregnant women would have been more representative than a sample drawn from a self-selected consumer panel, identifying women in the third trimester of pregnancy would have entailed enormous screening costs. Moreover, the study required respon-dents to complete a questionnaire nearly each month from late pregnancy through their infants’ first year, and a high response rate was essential to the study’s success. People who choose to participate in a consumer opinion panel are much more likely to answer questionnaires
than a random sample of the population.27 Random
samples of people and samples derived from consumer panels have been shown to have a similar distribution of many characteristics, although the average socioeco-nomic status of consumer-panel members tends to be
higher.26Because the IFPS II used a nonrandom sample
in which white women, women of higher socioeco-nomic status, women who could read English, and women from households with a stable mailing address were overrepresented, its results cannot be generalized to the overall US population of pregnant women and new mothers. Another limitation is that feeding data indicated only the frequency with which infants con-sumed foods from various food groups but did not indi-cate the specific food consumed, portion size, or other information that would enable an analysis of nutrient intake. A third limitation is that all data were based on the reports of study participants and, thus, are subject to possible self-reporting biases.
CONCLUSIONS
The purpose of this supplement toPediatricsis to
docu-ment the methods of the IFPS II and provide the first results on a range of topics. Although the accompanying articles cover only a small number of the research ques-tions that can be addressed through analyses of the IFPS II data, we believe that they demonstrate the value and uniqueness of the IFPS II.
ACKNOWLEDGMENTS
REFERENCES
1. Scariati PD, Grummer-Strawn LM, Fein SB, Yip R. Risk of diarrhea related to iron content of infant formula: lack of evidence to support the use of low-iron formula as a supple-ment for breastfed infants.Pediatrics.1997;99(3). Available at: www.pediatrics.org/cgi/content/full/99/3/e2
2. Scariati PD, Grummer-Strawn LM, Fein SB. A longitudinal analysis of infant morbidity and the extent of breastfeeding in the United States. Pediatrics. 1997;99(6). Available at: www.pediatrics.org/cgi/content/full/99/6/e5
3. Scariati PD, Grummer-Strawn LM, Fein SB. Water supplemen-tation of infants in the first month of life.Arch Pediatr Adolesc Med.1997;151(8):830 – 832
4. Fein SB, Roe BE. The effect of work status on breastfeeding initiation and duration. Am J Public Health. 1998;88(7): 1042–1046
5. Roe BE, Whittington L, Fein SB, Teisl MF. Is there competition between breast-feeding and maternal employment? Demogra-phy.1999;36(2):157–171
6. Fein SB, Falci CD. Infant formula preparation, handling, and related practices in the United States. J Am Diet Assoc.1999; 99(10):1234 –1240
7. Cogswell ME, Scanlon KS, Fein SB, Schieve LA. Medically advised, mother’s personal target, and actual weight gain dur-ing pregnancy.Obstet Gynecol.1999;94(4):616 – 622
8. DiGirolamo AM, Grummer-Strawn LM, Fein SB. Maternity care practices: implications for breastfeeding.Birth.2001;28(2): 94 –100
9. Hung S, Morrison DR, Whittington LA, Fein SB. Prepartum work, job characteristics, and risk of cesarean delivery.Birth. 2002;29(1):10 –17
10. DiGirolamo AM, Grummer-Strawn LM, Fein SB. Do perceived attitudes of physician and hospital staff affect breastfeeding decisions?Birth.2003;30(2):94 –100
11. Kirkland VL, Fein SB. Characterizing reasons for breastfeeding cessation throughout the first year postpartum using the con-struct of thriving.J Hum Lact.2003;19(3):278 –285
12. DiGirolamo AM, Thompson N, Martorell R, Fein SB, Grum-mer-Strawn LM. Intention or experience? Predictors of con-tinued breastfeeding.Health Educ Behav.2005;32(2):208 –226 13. Breslow RA, Falk DE, Fein SB, Grummer-Strawn LM. Alcohol
consumption among breastfeeding women. Breastfeed Med. 2007;2(3):152–157
14. Ip S, Chung M, Raman G, et al.Breastfeeding and Maternal and Infant Health Outcomes in Developed Countries. Rockville, MD: Agency for Healthcare Research and Quality; 2007. Evidence
Report/Technology Assessment 153. Available at: www. AHRQ.gov/downloads/pub/evidence/pdf/brfout/brfout.pdf. 15. Merewood A, Heinig J. Efforts to promote breastfeeding in the
United States: development of a national breastfeeding aware-ness campaign.J Hum Lact.2004;20(2):140 –145
16. Stuart S. The identification of postpartum depression.EPSDT Care Kids Newsl.2000; spr. Available at: www.iowaepsdt.org/ epsdtnews/2000/spr00/mpd-id.htm. Accessed September 5, 2003
17. Subar AF, Thompson FF, Kipnis V, et al. Comparative valida-tion of the Block, Willett, and Navalida-tional Cancer Institute food frequency questionnaires. Am J Epidemiol. 2001;154(12): 1089 –1099
18. Subar AF, Ziegler RG, Thompson FE, et al. Is shorter always better? Relative importance of questionnaire length and cog-nitive ease on response rates and data quality for two dietary questionnaires.Am J Epidemiol.2001;153(4):404 – 409 19. Thompson FE, Subar AF, Brown CC, et al. Cognitive research
enhances accuracy of food frequency questionnaire reports: results of an experimental validation study.J Am Diet Assoc. 2002;102(2):212–225
20. Thompson FE, Subar AF, Smith AF, et al. Fruit and vegetable assessment: performance of two new short instruments and a food frequency questionnaire.J Am Diet Assoc.2002;102(12): 1764 –1772
21. Centers for Disease Control and Prevention. Breastfeeding practices: results from the National Immunization Survey. Avail-able at: www.cdc.gov/breastfeeding/data/nis㛭data/data㛭2004. htm. Accessed August 8, 2007
22. Centers for Disease Control and Prevention. National Survey of Family Growth, cycle 6. Available at: www.cdc.gov/nchs/about/ major/nsfg/nsfgcycle6.htm. Accessed August 8, 2007
23. Centers for Disease Control and Prevention. National Nutrition and Health Examination Survey. Available at: www.cdc.gov/ nchs/nhanes.htm. Accessed August 8, 2007
24. Ryan AS, Wenjun Z, Acosta A. Breastfeeding continues to increase into the new millenium. Pediatrics. 2002;110(6): 1103–1109
25. DeVaney B, Kalb L, Briefel R, Zavitsky-Novak T, Clusen N, Aiegler P. Feeding Infants and Toddlers Study: overview of the study design.J Am Diet Assoc.2004;104(suppl):S8 –S13 26. Fisher L, Kane N. Consumer panelist versus random digit dial
respondent performance revisited: how similar and how dif-ferent?Research on Research Report 64.Chicago, IL: Synovate; 2004
DOI: 10.1542/peds.2008-1315c
2008;122;S28
Pediatrics
Laurence M. Grummer-Strawn
Sara B. Fein, Judith Labiner-Wolfe, Katherine R. Shealy, Rouwei Li, Jian Chen and
Infant Feeding Practices Study II: Study Methods
Services
Updated Information &
http://pediatrics.aappublications.org/content/122/Supplement_2/S28
including high resolution figures, can be found at:
References
BIBL
http://pediatrics.aappublications.org/content/122/Supplement_2/S28#
This article cites 18 articles, 1 of which you can access for free at:
Subspecialty Collections
http://www.aappublications.org/cgi/collection/breastfeeding_sub Breastfeeding
http://www.aappublications.org/cgi/collection/nutrition_sub Nutrition
following collection(s):
This article, along with others on similar topics, appears in the
Permissions & Licensing
http://www.aappublications.org/site/misc/Permissions.xhtml
in its entirety can be found online at:
Information about reproducing this article in parts (figures, tables) or
Reprints
http://www.aappublications.org/site/misc/reprints.xhtml
DOI: 10.1542/peds.2008-1315c
2008;122;S28
Pediatrics
Laurence M. Grummer-Strawn
Sara B. Fein, Judith Labiner-Wolfe, Katherine R. Shealy, Rouwei Li, Jian Chen and
Infant Feeding Practices Study II: Study Methods
http://pediatrics.aappublications.org/content/122/Supplement_2/S28
located on the World Wide Web at:
The online version of this article, along with updated information and services, is
by the American Academy of Pediatrics. All rights reserved. Print ISSN: 1073-0397.