R E S E A R C H
Open Access
Measuring the comprehensive wage effect
of changes in unit labor cost
Hideyuki Mizobuchi
1,2Correspondence:
[email protected] 1Faculty of Economics, Ryukoku University, 67 Fukakusa
Tsukamoto-cho, Fushimi-ku, Kyoto 612-8577, Japan
2School of Economics, University of Queensland, St Lucia, QLD 4072, Australia
Abstract
Unit labor cost (ULC) is defined as labor compensation per value added. It captures the cost competitiveness of industries and countries. As labor compensation is wage multiplied by hours worked or number of people employed, it is easy to show that ULC is wage divided by labor productivity. Thus, changes in ULC are often discussed in the context of wage increases and labor productivity. However, a higher wage induces firms to substitute labor with capital, which affects labor productivity. However, the conventional
decomposition of changes in ULC dismisses this indirect impact of wage on ULC through labor productivity. We propose an alternative decomposition of the change in ULC with a measure of a comprehensive wage effect, which fully captures its direct as well as indirect impact. It allows us to understand more accurately the role of wage changes in enhancing cost competitiveness. Furthermore, we compare measures of the wage effect under two decompositions, using data from 18 OECD
countries over the 1995–2005 period. We find the wage effect to be significantly overestimated under the conventional decomposition. This study looks at ULC for the whole country as well as for two sectors—manufacturing sector and
electricity, gas, and water supply sector. JEL Classification:C43, D24, O47, E31
Keywords:Unit labor cost; Malmquist index; Index number; Manufacturing sector; Energy sector
1 Background
Unit labor cost (ULC) is defined as labor compensation per unit of value added.1As it ctures labor cost required to produce one unit of value added, it is widely accepted as an ap-propriate measure of cost competitiveness for a producer.2 ULC is often computed for industries and countries. Monitoring it over a period or across units helps one to track their cost competitiveness.
While labor compensation is units of labor multiplied by labor compensation per unit of labor (simply wage), the value added divided by units of labor defines labor productivity.3 Thus, ULC can be considered the ratio of wage to labor productivity. A change in the ULC is often attributed to a change in the wage (wage effect) and in labor productivity (labor productivity effect). This suggests that there are two ways of enhancing cost competitiveness: retaining wage or raising labor productivity. This conventional decomposition of the change or difference in ULC into two effects has been applied to investigate the sources of cost com-petitiveness for industries or countries.4 Van Ark et al. (2005) compare the ULC of the
manufacturing sector for OECD member countries. They indicated that even among ad-vanced economies, there are significant differences between countries in terms of the relative contributions of the wage and labor productivity effects.5,6
However, the current decomposition of the changes in ULC has shortcomings. These arise from the fact that wage and labor productivity are not independently determined. Faced with input prices such as user cost of capital and wage, a firm’s demand for cap-ital and labor is such that production cost is minimized. Thus, a rise in wage induces a firm to employ more capital and hire less labor. As Mizobuchi (2014) emphasizes, this is likely to raise labor productivity, holding other factors constant. Thus, the labor productivity effect in a conventional decomposition is partly attributable to wage changes. In other words, this indirect impact of a wage change through labor product-ivity is not captured by the current measure of the wage effect.
This study proposes an alternative decomposition of changes in the ULC into three components; these are two factor-price effects (user cost of capital and wage) and a technical change effect. First, we define each component theoretically using a ULC function. Second, we derive index number formulae that approximate each component. The wage effect in this decomposition captures fully the impact of a change in wages on the ULC. Its direct impact on labor compensation as well as its indirect impact through a change in labor productivity is captured. We show that the bias in the con-ventional measure of wage effect depends on production technology, especially output elasticity or factor shares.
We apply our decomposition to data from 18 OECD countries by employing EU KLEMS. We focus on the period 1995–2006, for which data is available for the largest number of countries. For each country, we decompose the ULC of the whole country, manufacturing sector, and electricity, gas, and water supply sector. This allows us to quantify empirically by how much the conventional measure of wage effect overesti-mates or underestioveresti-mates the comprehensive impact on ULC of wage changes. Since the underlying technology varies across sectors, the magnitude of bias in the conventional wage effect is also likely to vary.
The paper is organized as follows. Section 2 decomposes the change in ULC into three components. Section 3 applies this decomposition to data from OECD countries. Section 4 concludes the paper.
2 Methods
We introduce a simple model of production to incorporate substitution between capital and labor. A firm utilizes capital K and labor L to produce a single output, Y. We assume the firm’s cost-minimizing behavior. Thus, given output Y, a firm chooses K and L to minimize cost based on factor prices r (user cost of capital) and w (wage). Technology at period tis represented by the production function Y=Ft(K, L), which exhibits constant returns to scale. Given factor prices and output, the period t cost function of a firm is as follows:
Ctðr;w;YÞ ¼ maxfrKþwL:Y ¼FtðK;LÞg ð1Þ
Shephard’s lemma (Shephard 1970), we derive the following unit labor cost function as the function of factor prices and time:
ULCtðr;wÞ ¼w⋅∂C
tðr;w;YÞ=∂w
Y ¼w⋅∂Ctðr;w;1Þ=∂w ð2Þ This is the key equation for determining changes in ULC. Let us compare ULC for two periods, 0 and 1. First, we look at the comprehensive impact of the change in wage on the ULC. The wage effect is measured by the ratio ULCt(r,w1)/ULCt(r,w0). It indi-cates the change in ULC induced by the change in wage going from period 0 to 1, using the technology that is available during the reference periodtand facing the refer-ence user cost of capital,r. Since each choice of the reference vector (t,r) might gener-ate a different measure, we calculgener-ate two measures using different reference vectors (0, r0
) and (1,r1) which, in fact, are observed in each period and thus are equally reason-able. Then, following Fisher (1922) and Diewert (1976), we use the geometric mean of these measures as a theoretical measure of the wage effect,Wage, as follows:
Wage¼
ffiffiffiffiffiffiffiffiffiffiffiffiffiffiffiffiffiffiffiffiffiffiffiffiffiffiffiffiffiffiffiffiffiffiffiffiffiffiffiffiffiffiffiffiffiffiffiffiffiffiffiffiffiffiffiffi ULC0ðr0;w1Þ
ULC0ðr0;w0Þ⋅
ULC1ðr1;w1Þ ULC1ðr1;w0Þ s
ð3Þ
Second, we consider the comprehensive impact of the change in user cost of capital on ULC. The user cost effect is measured by the ratio ULCt(r1,w)/ULCt(r0,w). It indi-cates the change in ULC induced by the change in user cost going from period 0 to 1, using the technology that is available during the reference periodtand facing the refer-ence wage, w. As each choice of the reference vector (s,w) might generate a different measure, we calculate two measures using different reference vectors (0,w0) and (1,w1) which, in fact, are observed in each period and thus are equally reasonable. Then, we use the geometric mean of these measures as a theoretical measure of user cost effect, User cost, as follows:
User cost¼
ffiffiffiffiffiffiffiffiffiffiffiffiffiffiffiffiffiffiffiffiffiffiffiffiffiffiffiffiffiffiffiffiffiffiffiffiffiffiffiffiffiffiffiffiffiffiffiffiffiffiffiffiffiffiffiffi ULC0ðr1;w0Þ
ULC0ðr0;w0Þ⋅
ULC1ðr1;w1Þ ULC1ðr0;w1Þ s
ð4Þ
Lastly, we consider the impact of a technical change on the ULC. Technical change is measured by the ratio ULC1(r,w)/ULC0(r,w). It indicates the change in ULC induced by technical change going from period 0 to 1, facing the reference factor pricesrandw. Since each choice of the reference vector (r,w) might generate a different measure, we calculate two measures using different reference vectors (r0
,w0) and (r1,w1) which, in fact, are ob-served in each period and thus are equally reasonable. Then, we use the geometric mean of these measures as a theoretical measure of technical change effect,Technology, as follows:
Technology¼
ffiffiffiffiffiffiffiffiffiffiffiffiffiffiffiffiffiffiffiffiffiffiffiffiffiffiffiffiffiffiffiffiffiffiffiffiffiffiffiffiffiffiffiffiffiffiffiffiffiffiffiffiffiffiffiffi ULC1ðr0;w0Þ
ULC0ðr0;w0Þ⋅
ULC1ðr1;w1Þ ULC0ðr1;w1Þ s
ð5Þ
propose a tractable way of investigating the sources of the change in ULC, replacing the conventional decomposition.7
We implement them by assuming the following production functions fort= 0, 1:
FtðK;LÞ ¼AtKαt
Lð1−αtÞ ð6Þ
It is a variant of the Cobb–Douglas production function allowing output elasticity of capitalα, which is known to be equal to capital share, to vary in each period. Technol-ogy of a firm in periodtis represented by a combination ofAtandαt. Under this speci-fication, the three theoretical measures coincide with a formula for factor input prices and quantities observed at two periods 0 and 1 as follows8:
Wage¼ w
1
w0
1 2ðs0Lþs1LÞ
ð7Þ
User cost¼ r 1
r0
1 2ðs0Kþs1KÞ
ð8Þ
Technology¼ w
1L1
Y1
= wY0L00
= ww10 1 2ðs0Lþs1LÞ
rr10
1
2ðs0Kþs1KÞ!
ð9Þ
wherestK ¼ðrtKrttþKwttLtÞandstL¼ w tLt
rtKtþwtLt
ð Þare the capital and labor compensation share
defined fort= 0, 1.
Our measure of the wage effect is smaller than the conventional measure of wage ef-fect w1/w0. A higher wage directly increases the ULC by raising the labor compensa-tion. However, it induces a firm to substitute labor by employing more capital. Less labor raises labor productivity, lowering the ULC. Thus, the direct impact of a wage in-crease on labor compensation is somewhat mitigated. That is what the measure of wage effect proposed by this study incorporates. Three measures are independently proposed to capture the distinct effect on the ULC. Under the assumption of Eq. (6), the change in ULC is completely decomposed into these factors, as follows:
ULC1ðr1;w1Þ ULC0ðr0;w0Þ¼
w1L1
Y1
= wY0L00
¼WageUser costTechnology ð10Þ
Under this decomposition, labour productivity effect is captured by
User costTechnology¼ w1L1
Y1
= w0L0
Y0
= w1
w0 1 2ðs0Lþs1LÞ
, which contrast the
conven-tional measure of labour productivity effect wY1L11
= w0L0
Y0
= w1
w0 ¼ L 1
Y1 = L 0
Y0 .
3 Results and discussion
The data source of this study is the EU KLEMS database based on ISIC Rev. 3, which was updated in March 2011. It comprehensively covers inputs and outputs for the detailed 72 industries. We use data series of value added, capital services, and labor services for our simple case of two inputs and one output. Nominal values and volume measures of value added, capital services, and labor are available. Volume measures of these series correspond to quantitiesY,K, andL, whereas input pricesrandware implicitly derived from nominal
sectors—manufacturing sector and electricity, gas, and water supply sector among the de-tailed 72 industries. We intend to show empirically the bias in the current measure of wage effect and the biases varying across sectors characterized by different production technolo-gies. We focus on the period 1995–2006, for which data necessary for computing index number formulae is available for the largest number of 18 countries.
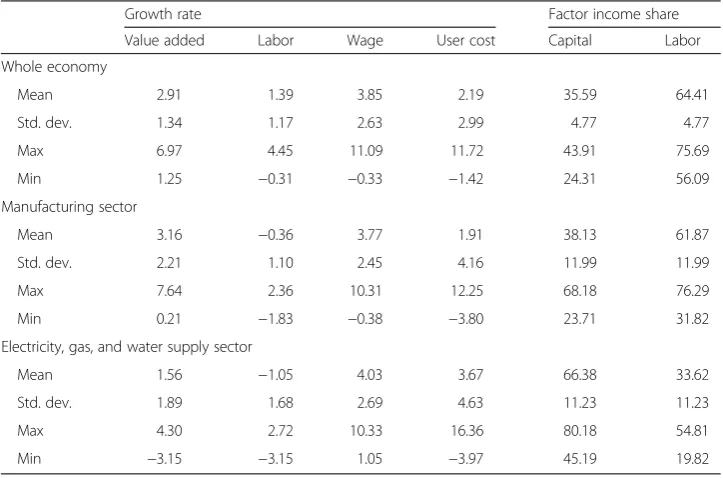
Table 1 summarizes input–output data for the whole economy and two sectors in 18 countries for 1995–2006. GDP, which is the value added for the whole economy, grew at an average annual rate of 2.91 % in the sample countries.9Labor for the whole economy also increased, but its growth rate was not as much as that of GDP. In contrast, manufacturing showed a higher growth rate with a value added of 3.16 %, even with declining quantity of labor. While the value added of the electricity, gas, and water supply sector grew at a rela-tively low rate of 1.56 % per year, labor in this sector also declined. Thus, it indicates that labor productivity grew in the whole economy as well as the two sectors and that the growth rate was especially higher in manufacturing. Similarly, large increases in wages were also documented in the whole economy and the two sectors, where wages grew at around 4 % on average per year. It is worth noting the differences in production structures reflected by factor shares for the two sectors. While manufacturing showed a capital share of ap-proximately 40 %, which is close to the whole economy, the electricity, gas, and water sup-ply sector showed especially large capital share of 66.38 %, reflecting its dependence on large infrastructure.
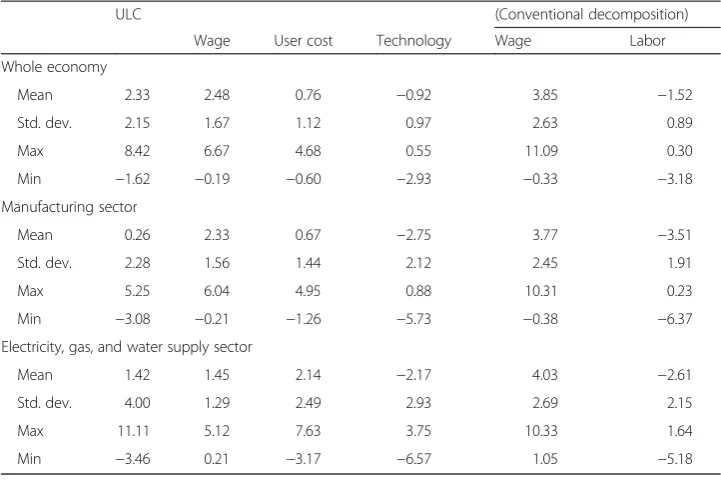
Decomposition of the changes in ULC based on Eqs. (7)–(10) is summarized in Table 2. It also presents the conventional decomposition into changes in wage and labor productivity, for comparison.10 ULC for the whole economy significantly in-creased at an average rate of 2.33 % per year. On the other hand, while ULC for electri-city, gas, and water supply increased at a smaller rate of 1.42 % on average per year,
Table 1Average growth rate of GDP, labor and factor prices, and average share of factor input, 1995–2006 (%)
Growth rate Factor income share
Value added Labor Wage User cost Capital Labor
Whole economy
Mean 2.91 1.39 3.85 2.19 35.59 64.41
Std. dev. 1.34 1.17 2.63 2.99 4.77 4.77
Max 6.97 4.45 11.09 11.72 43.91 75.69
Min 1.25 −0.31 −0.33 −1.42 24.31 56.09
Manufacturing sector
Mean 3.16 −0.36 3.77 1.91 38.13 61.87
Std. dev. 2.21 1.10 2.45 4.16 11.99 11.99
Max 7.64 2.36 10.31 12.25 68.18 76.29
Min 0.21 −1.83 −0.38 −3.80 23.71 31.82
Electricity, gas, and water supply sector
Mean 1.56 −1.05 4.03 3.67 66.38 33.62
Std. dev. 1.89 1.68 2.69 4.63 11.23 11.23
Max 4.30 2.72 10.33 16.36 80.18 54.81
Min −3.15 −3.15 1.05 −3.97 45.19 19.82
ULC for manufacturing was nearly constant over this period. Thus, it shows that only the manufacturing sector could hold its cost competitiveness over this period, along with other factors deteriorating their competitiveness.
Now, we investigate the sources of changes in ULC. We begin by revisiting the con-ventional decomposition; the large wage effect of around 4 % dominates the increase in ULC, but it is partly mitigated by labor productivity growth. Since the rate of wage in-creases is comparable among sectors, the difference in ULC growth can be attributed to the difference in labor productivity growth. However, once we use the alternative de-composition proposed in this study, we find that the wage effect has shrunk in the whole economy and in the two sectors, reflecting the firm’s substitution of labor by capital under higher wages. As Eq. (7) suggests, the smaller the labor share or the larger the capital share, the more the wage effect has shrunk, under the alternative measure of wage effect. Reflecting its large capital share, the electricity, gas, and water supply sector shows the largest gap in the two wage effects, falling from 4.03 % under the con-ventional measure to 1.42 % in the alternative decomposition.
The wage effect under the alternative decomposition proposed by this study turns out to be very close to the growth rate of ULC for the whole economy and electricity, gas, and water supply sector on average over time. Effects of user cost and technical change offset each other in these two sectors.11 Thus, we can conclude that the long-run impact of labor productivity growth, which is induced by factors other than wage, is negligible in these sectors.
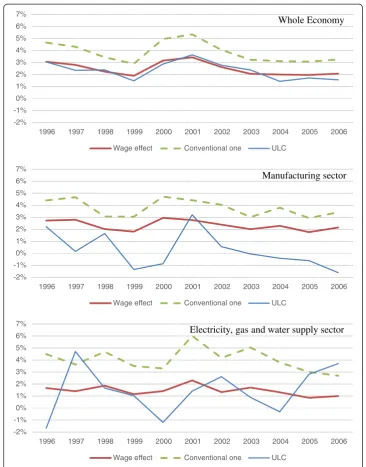
Figure 1 compares the time series of two wage effects and ULC. Evidently, there is a one-to-one relationship between the movement of ULC and the wage effect in the alternative decomposition for the whole economy. As Fig. 1 suggests, this relationship does not neces-sarily hold, especially in sectors where there is much technical progress. However, it is clear that the wage effect in the decomposition proposed here becomes much closer to the Table 2Decomposition of changes in unit labor cost, 1995–2006 (%)
ULC (Conventional decomposition)
Wage User cost Technology Wage Labor
Whole economy
Mean 2.33 2.48 0.76 −0.92 3.85 −1.52
Std. dev. 2.15 1.67 1.12 0.97 2.63 0.89
Max 8.42 6.67 4.68 0.55 11.09 0.30
Min −1.62 −0.19 −0.60 −2.93 −0.33 −3.18
Manufacturing sector
Mean 0.26 2.33 0.67 −2.75 3.77 −3.51
Std. dev. 2.28 1.56 1.44 2.12 2.45 1.91
Max 5.25 6.04 4.95 0.88 10.31 0.23
Min −3.08 −0.21 −1.26 −5.73 −0.38 −6.37
Electricity, gas, and water supply sector
Mean 1.42 1.45 2.14 −2.17 4.03 −2.61
Std. dev. 4.00 1.29 2.49 2.93 2.69 2.15
Max 11.11 5.12 7.63 3.75 10.33 1.64
growth rate of ULC compared with the conventional measure of wage effect, by reducing the role of labor productivity growth, which is characterized by the joint effects of user cost change and technical change.
4 Conclusions
We propose the decomposition of the change in ULC into two factor-price effects and a technical change effect. All these effects are defined by the underlying ULC function, which reflects a firm’s cost-minimizing behavior. Thus, the wage effect in our decom-position not only captures its direct impact on labor compensation but also incorpo-rates the indirect impact on ULC through the change in labor productivity induced by
-2% -1% 0% 1% 2% 3% 4% 5% 6% 7%
1996 1997 1998 1999 2000 2001 2002 2003 2004 2005 2006
Wage effect Conventional one ULC
-2% -1% 0% 1% 2% 3% 4% 5% 6% 7%
1996 1997 1998 1999 2000 2001 2002 2003 2004 2005 2006
Wage effect Conventional one ULC
-2% -1% 0% 1% 2% 3% 4% 5% 6% 7%
1996 1997 1998 1999 2000 2001 2002 2003 2004 2005 2006
Wage effect Conventional one ULC
Whole Economy
Manufacturing sector
Electricity, gas and water supply sector
wage changes. We theoretically show that the bias in the conventional measure of wage effect depends on factor shares.
The empirical examination of 18 OECD member countries indicates that the impact of the wage effect on the change in ULC is overestimated by more than one percentage point under the conventional measure of wage effect. The bias in the conventional measure is especially large for industries with large capital shares such as in the electri-city, gas, and water supply sector. We find that once the comprehensive impact of wage change is appropriately measured based on the decomposition proposed in this study, the wage effect becomes smaller and much closer to the growth rate of ULC. For the whole economy, the change in ULC is almost completely explained by the wage effect.
This study is a first step towards measuring the comprehensive impact of a wage change on ULC. One limitation is clearly our selection of the functional form. Our theoretical result indicates that some index number formulae are exact to the theor-etical measures based on the ULC function under the assumption of the Cobb– Douglas production function. However, even though output elasticities are allowed to vary over time, it is constant within a period. This leads to a unitary elasticity of substitution between capital and input. Thus, the assumption of Cobb–Douglas se-verely restricts substitution between two inputs a priori. Ideally, the exactness should hold under flexible functional forms such as the translog functional form, which im-poses the minimum on the underlying production technology.12 However, we leave the search for such superlative index number formulae of the comprehensive wage effect for ULC change to future research.
5 Endnotes 1
Strictly speaking, we are talking about value added at constant prices or the quantity of value added.
2
Turner and Van’t dack (1993) and Turner and Golub (1997) recommend the use of unit labor cost in manufacturing as a measure of competitiveness.
3
Formally,ULC¼labour compensationvalue added ¼wageunits of labourvalue added ¼value addedwage=units of labour¼labour productivitywage .
4
As the changes in ULC over time is decomposed into changes in wage and labor prod-uctivity, the differences in ULC across units are decomposed into differences in wage and labor productivity.
5
Although the rapidly growing share of China’s manufacturing export is often ascribed to its low wages, Ceglowski and Golub (2007, 2012) document that labor productivity growth played a significant role in lowering ULC, although this slowed down after 2003.
6
ULC is also a key variable for estimating the New Keynesian price equation (Galí and Gertler 1999; Sbordone 2002). In these studies, real ULC, which is ULC deflated by output price, is considered a measure of marginal cost.
7
Estimating the cost function is one way of implementing theoretical measures (see Coelli et al. 2005). However, there are multiple concerns about adopting this approach, such as the number of observations as well as specification of the stochastic term. It is far more demanding than computing the rate of wage change and labor productivity growth. Our approach is as tractable as the current decomposition.
8
Under the specification of Eq. (6), it can be shown that ULC¼A1t 1−α t
αt
αt
rαt
w1−αt
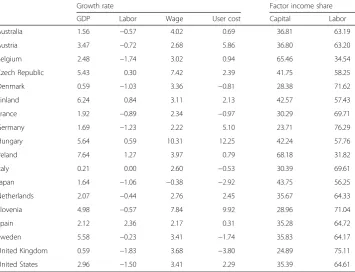
Table 3Average growth rate of GDP, labor and factor prices, and average share of factor input from 1995 to 2006 (%), whole economy
Growth rate Factor income share
GDP Labor Wage User cost Capital Labor
Australia 3.47 2.04 3.95 1.93 38.73 61.27
Austria 2.33 1.09 1.80 2.21 35.27 64.73
Belgium 2.08 1.18 2.35 0.48 37.27 62.73
Czech Republic 2.54 0.11 7.48 1.67 41.30 58.70
Denmark 1.89 1.33 3.05 −0.37 32.58 67.42
Finland 3.52 1.59 3.04 3.00 35.29 64.71
France 2.12 0.88 2.73 1.53 34.46 65.54
Germany 1.50 −0.31 1.74 0.20 33.07 66.93
Hungary 4.22 1.55 11.09 11.72 39.63 60.37
Ireland 6.97 4.45 5.03 3.50 43.91 56.09
Italy 1.39 1.17 2.53 1.78 35.22 64.78
Japan 1.25 −0.04 −0.33 −1.42 42.43 57.57
Netherlands 2.63 1.55 3.17 2.45 33.38 66.62
Slovenia 4.07 0.89 7.81 6.81 24.31 75.69
Spain 3.48 3.78 2.63 2.38 36.89 63.11
Sweden 2.99 0.80 3.63 −0.35 33.05 66.95
United Kingdom 2.72 1.47 3.85 0.75 28.42 71.58
United States 3.16 1.44 3.74 1.13 35.44 64.56
Source: EU KLEMS based on ISIC Rev. 3 (http://www.euklems.net/)
Table 4Average growth rate of GDP, labor and factor prices, and average share of factor input from 1995 to 2006 (%), manufacturing sector
Growth rate Factor income share
GDP Labor Wage User cost Capital Labor
Australia 1.56 −0.57 4.02 0.69 36.81 63.19
Austria 3.47 −0.72 2.68 5.86 36.80 63.20
Belgium 2.48 −1.74 3.02 0.94 65.46 34.54
Czech Republic 5.43 0.30 7.42 2.39 41.75 58.25
Denmark 0.59 −1.03 3.36 −0.81 28.38 71.62
Finland 6.24 0.84 3.11 2.13 42.57 57.43
France 1.92 −0.89 2.34 −0.97 30.29 69.71
Germany 1.69 −1.23 2.22 5.10 23.71 76.29
Hungary 5.64 0.59 10.31 12.25 42.24 57.76
Ireland 7.64 1.27 3.97 0.79 68.18 31.82
Italy 0.21 0.00 2.60 −0.53 30.39 69.61
Japan 1.64 −1.06 −0.38 −2.92 43.75 56.25
Netherlands 2.07 −0.44 2.76 2.45 35.67 64.33
Slovenia 4.98 −0.57 7.84 9.92 28.96 71.04
Spain 2.12 2.36 2.17 0.31 35.28 64.72
Sweden 5.58 −0.23 3.41 −1.74 35.83 64.17
United Kingdom 0.59 −1.83 3.68 −3.80 24.89 75.11
United States 2.96 −1.50 3.41 2.29 35.39 64.61
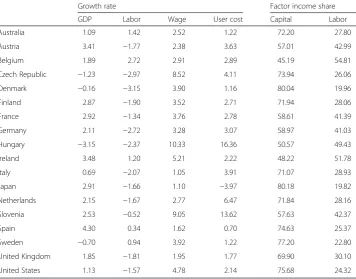
Table 5Average growth rate of GDP, labor and factor prices, and average share of factor input from 1995 to 2006 (%), electricity, gas, and water supply sector
Growth rate Factor income share
GDP Labor Wage User cost Capital Labor
Australia 1.09 1.42 2.52 1.22 72.20 27.80
Austria 3.41 −1.77 2.38 3.63 57.01 42.99
Belgium 1.89 2.72 2.91 2.89 45.19 54.81
Czech Republic −1.23 −2.97 8.52 4.11 73.94 26.06
Denmark −0.16 −3.15 3.90 1.16 80.04 19.96
Finland 2.87 −1.90 3.52 2.71 71.94 28.06
France 2.92 −1.34 3.76 2.78 58.61 41.39
Germany 2.11 −2.72 3.28 3.07 58.97 41.03
Hungary −3.15 −2.37 10.33 16.36 50.57 49.43
Ireland 3.48 1.20 5.21 2.22 48.22 51.78
Italy 0.69 −2.07 1.05 3.91 71.07 28.93
Japan 2.91 −1.66 1.10 −3.97 80.18 19.82
Netherlands 2.15 −1.67 2.77 6.47 71.84 28.16
Slovenia 2.53 −0.52 9.05 13.62 57.63 42.37
Spain 4.30 0.34 1.62 0.70 74.63 25.37
Sweden −0.70 0.94 3.92 1.22 77.20 22.80
United Kingdom 1.85 −1.81 1.95 1.77 69.90 30.10
United States 1.13 −1.57 4.78 2.14 75.68 24.32
Source: EU KLEMS based on ISIC Rev. 3 (http://www.euklems.net/)
Table 6Decomposition of changes in unit labor cost from 1995 to 2006 (%), whole economy
ULC (Conventional decomposition)
Wage User cost TFP Wage ALP
Australia 2.52 2.42 0.75 −0.64 3.95 −1.43
Austria 0.56 1.16 0.80 −1.40 1.80 −1.24
Belgium 1.44 1.48 0.18 −0.22 2.35 −0.91
Czech Republic 5.06 4.38 0.68 0.01 7.48 −2.42
Denmark 2.49 2.06 −0.12 0.55 3.05 −0.56
Finland 1.12 1.96 1.05 −1.89 3.04 −1.92
France 1.49 1.79 0.53 −0.82 2.73 −1.24
Germany −0.07 1.17 0.09 −1.32 1.74 −1.81
Hungary 8.42 6.67 4.68 −2.93 11.09 −2.67
Ireland 2.51 2.79 1.45 −1.73 5.03 −2.52
Italy 2.31 1.63 0.62 0.05 2.53 −0.22
Japan −1.62 −0.19 −0.60 −0.83 −0.33 −1.29
Netherlands 2.09 2.12 0.82 −0.85 3.17 −1.08
Slovenia 4.63 5.96 1.47 −2.80 7.81 −3.18
Spain 2.93 1.66 0.89 0.38 2.63 0.30
Sweden 1.44 2.44 −0.12 −0.87 3.63 −2.19
United Kingdom 2.60 2.75 0.21 −0.36 3.85 −1.25
Table 7Decomposition of changes in unit labor cost from 1995 to 2006 (%), manufacturing sector
ULC (Conventional decomposition)
Wage User cost TFP Wage ALP
Australia 1.89 2.52 0.24 −0.87 4.02 −2.13
Austria −1.51 1.68 2.13 −5.32 2.68 −4.19
Belgium −1.19 1.03 0.63 −2.86 3.02 −4.22
Czech Republic 2.30 4.32 1.01 −3.03 7.42 −5.12
Denmark 1.74 2.41 −0.22 −0.45 3.36 −1.62
Finland −2.30 1.78 0.92 −4.99 3.11 −5.40
France −0.47 1.62 −0.28 −1.81 2.34 −2.81
Germany −0.70 1.70 1.30 −3.70 2.22 −2.92
Hungary 5.25 6.04 4.95 −5.73 10.31 −5.06
Ireland −2.41 1.23 0.29 −3.92 3.97 −6.37
Italy 2.39 1.81 −0.17 0.75 2.60 −0.21
Japan −3.08 −0.21 −1.26 −1.60 −0.38 −2.70
Netherlands 0.26 1.79 0.90 −2.42 2.76 −2.50
Slovenia 2.30 5.61 2.33 −5.65 7.84 −5.55
Spain 2.40 1.41 0.11 0.88 2.17 0.23
Sweden −2.40 2.20 −0.62 −3.97 3.41 −5.81
United Kingdom 1.26 2.82 −0.99 −0.57 3.68 −2.42
United States (NAICS based) −1.05 2.22 0.89 −4.16 3.41 −4.46
Table 8Decomposition of changes in unit labor cost from 1995 to 2006 (%), electricity, gas, and water supply sector
ULC (Conventional decomposition)
Wage User cost TFP Wage ALP
Australia 2.85 0.71 0.87 1.27 2.52 0.33
Austria −2.80 1.03 2.12 −5.96 2.38 −5.18
Belgium 3.74 1.59 1.26 0.88 2.91 0.83
Czech Republic 6.79 2.26 3.03 1.50 8.52 −1.73
Denmark 0.92 0.77 0.94 −0.80 3.90 −2.99
Finland −1.25 0.99 2.03 −4.27 3.52 −4.77
France −0.50 1.56 1.57 −3.64 3.76 −4.26
Germany −1.55 1.34 1.86 −4.76 3.28 −4.83
Hungary 11.11 5.12 7.43 −1.44 10.33 0.78
Ireland 2.93 2.65 1.04 −0.76 5.21 −2.28
Italy −1.71 0.25 2.76 −4.71 1.05 −2.76
Japan −3.46 0.21 −3.17 −0.50 1.10 −4.56
Netherlands −1.05 0.73 4.79 −6.57 2.77 −3.82
Slovenia 6.00 3.85 7.63 −5.48 9.05 −3.05
Spain −2.33 0.41 0.52 −3.26 1.62 −3.95
Sweden 5.56 0.88 0.93 3.75 3.92 1.64
United Kingdom −1.71 0.61 1.25 −3.57 1.95 −3.66
9
See Appendix; Tables 3, 4, and 5 for underlying country-specific data.
10
See Appendix; Tables 6, 7, and 8 for underlying country-specific result.
11
Technical change and underlying production technology of energy sectors are dis-cussed in detail by Managi et al. (2004) and Kerstens and Managi (2012).
12
See Diewert (1976) and Caves et al. (1982).
Competing interests
The author declares that he has no competing interests.
Acknowledgements
The author is grateful to Bert Balk, Michio Suzuki and the anonymous referee for their helpful comments and suggestions. All remaining errors are the author’s responsibility. This article was completed when I visited the School of Economics at the University of Queensland. I appreciate the good research environment offered by the department. This research was financially supported by Grant-in-Aid for Scientific Research (KAKENHI 25870922).
Received: 10 May 2015 Accepted: 12 June 2015
References
1. Caves DW, Christensen LR, Diewert WE (1982) The economic theory of index numbers and the measurement of input, output, and productivity. Econometrica 50:1393–414
2. Ceglowski J, Golub S (2007) Just how low are China’s labour costs? World Econ 30:597–617. doi:10.1111/j.1467-9701.2007.01006.x.
3. Ceglowski J, Golub SS (2012) Does China still have a labor cost advantage? Glob Econ J. doi:10.1515/1524-5861.1874 4. Coelli TJ, Rao DSP, O’Donnel CJ, Batesse GE (2005) An introduction to efficiency and productivity analysis. 2nd ed.
Springer, New York, NY
5. Diewert WE (1976) Exact and superlative index numbers. J Econo 4:115–45
6. Fisher I (1922) The making of index numbers: a study of their varieties, tests, and reliability. Houghton Mifflin, Boston, MA 7. Galí J, Gertler M. (1999) Inflation dynamics: a structural econometric analysis. J Monet Econ 44:195–222.
doi:10.1016/S0304-3932(99)00023-9.
8. Kerstens K, Managi S (2012) Total factor productivity growth and convergence in the petroleum industry: empirical analysis testing for convexity. Int J Prod Econ 139:196–206. doi:10.1016/j.ijpe.2012.04.008.
9. Managi S, Opaluch JJ, Jin D, Grigalunas TA (2004) Technological change and depletion in offshore oil and gas. J Environ Econ Manage 47:388–409. doi:10.1016/S0095-0696(03)00093-7.
10. Mizobuchi H (2014) Returns to scale effect in labour productivity growth. J Product Anal 42:293–304. doi:10.1007/s11123-014-0408-9.
11. Sbordone AM (2002) Prices and unit labor costs: a new test of price stickiness. J Monet Econ 49:265–92. doi:10.1016/S0304-3932(01)00111-8.
12. Shephard RW (1970) Theory of cost and production function. Princeton University Press, Princeton, NJ 13. Turner AG, Golub SS (1997) Towards a system of unit labor cost-based competitiveness indicators for advanced,
developing and transition countries. Staff Studies for the World Economic Outlook, IMF, Washington, DC 14. Turner P, Van’t dack J (1993) Measuring international price and cost competitiveness. Bank for International
Settlements Economic Paper No. 39, Basel
15. Van Ark B, Stuivenwold E, Ypma G (2005) Unit labour costs, productivity and international competitiveness. Research Memorandum GD-80, Groningen Growth and Development Centre
Submit your manuscript to a
journal and benefi t from:
7Convenient online submission
7Rigorous peer review
7Immediate publication on acceptance
7Open access: articles freely available online
7High visibility within the fi eld
7Retaining the copyright to your article