Modeling and Simulation of Custom Power
Devices to Mitigate Power Quality Problems
T.Devaraju
Research Scholar, Department of EEE, JNTU College of Engineering, Anantapur
Dr. V.C.Veera Reddy Professor, Department of EEE, SV University College of Engineering, Tirupati
Dr. M. Vijay Kumar, Professor, Department of EEE, JNTU College of Engineering, Anantapur
Abstract:
A Power quality problem is an occurrence manifested as a nonstandard voltage, current or frequency that results in a failure or a misoperation of end use Equipments. Utility distribution networks, sensitive industrial loads, and critical commercial operations all suffer from various types of outages and service interruptions which can cost significant financial 1oss per incident based on process down-time, lost production, idle work forces, and other factors. With the restructuring of Power Systems and with shifting trend towards distributed and dispersed Generation, the issue of Power Quality is going to take newer dimensions. The aim therefore, in this work, is to identify the prominent concerns in the area and thereby to recommend measures that can enhance the quality of the power, keeping in mind their economic viability and technical repercussions. In this paper ectromagnetic transient studies are presented for the following two custom power controllers: the distribution static compensator (D-STATCOM), and the dynamic voltage restorer (DVR). Comprehensive results are presented to assess the performance of each device to mitigate the power quality problems.
Index Terms-- Power Quality Problems, Voltage Sag, DSTATCOM, DVR, MATLAB
I. Introduction
Power quality is certainly a major concern in the present era; it becomes especially important with the introduction of sophisticated devices, whose performance is very sensitive to the quality of power supply. Modern industrial processes are based a large amount of electronic devices such as programmable logic controllers and adjustable speed drives. The electronic devices are very sensitive to disturbances [1] and thus industrial loads become less tolerant to power quality problems such as voltage dips, voltage swells, and harmonics. Voltage dips are considered one of the most severe disturbances to the industrial equipment. Swells and over voltages can cause over heating tripping or even destruction of industrial equipment such as motor drives. Electronic equipments are very sensitive loads against harmonics because their control depends on either the peak value or the zero crossing of the supplied voltage, which are all influenced by the harmonic distortion.
describes the techniques of correcting the supply voltage sag in a distribution system by two power electronics based devices called Dynamic Voltage Restorer (DVR) and Distribution STATCOM (D-STATCOM). A DVR voltage in series with the system voltage and a D-STATCOM injects a current into the system to correct the voltage sag [1]. The steady state performance of both DVR and D-STATCOM is studied for various levels of voltage sag levels.
II. Sources and Effects of Power Quality Problems
The distortion in the quality of supply power can be introduced /enhanced at various stages; however, some of the primary sources of distortion [3] can be identified as below:
A. Power Electronic Devices B. IT and Office Equipments C. Arcing Devices
D. Load Switching E. Large Motor Starting F. Embedded Generation
G. Electromagnetic Radiations and Cables H. Storm and Environment Related Causes etc.
Some of the common power quality issues and their prominent impact are summarized in the table below:
Problem Effects Voltage sags Devices /Process down time, effect on product quality, failure/malfunction of customer
equipments and associated scrap cost, clean up costs, maintenance and repair costs etc. Transients Tripping,copmponents failures,flashover of instrument insulation hardware re booting,
software glitches, poor product quality etc.
Harmonics Excessive losses and heating in motors, capacitors and transformers connected to the system
Flicker Visual irritation, introduction of many harmonic components in the supply power and their associated equipment.
III. Use of Custom Power Devices to Improve Power Quality
In order to overcome the problems such as the ones mentioned above, the concept of custom power devices is introduced recently; custom power is a strategy, which is designed primarily to meet the requirements of industrial and commercial customer. The concept of custom power is to use power electronic or static controllers in the medium voltage distribution system aiming to supply reliable and high quality power to sensitive users [1]. Power electronic valves are the basis of those custom power devices such as the static transfer switch, active filters and converter-based devices. Converter based power electronics devices can be divided in to two groups: shunt-connected and series-shunt-connected devices. The shunt shunt-connected devices is known as the D-STATCOM and the series device is known as the Static Series Compensator (SSC), commercially known as DVR. It has also been reported in literature that both the SSC and D-STATCOM have been used to mitigate the majority the power system disturbances such as voltage dips, sags, flicker unbalance and harmonics.
IV. Modeling of Custom Power Devices and Simulation Results
As mentioned in the previous section that custom power devices could be the effective means to overcome some of the major power quality problems by the way of injecting active and/or reactive power(s) into the system [5]-[6]. This section of the paper deals with the modeling of DSTATCOM and DVR. Consequently some case studies will be taken up for analysis and performance comparison of these devices. The modeling approach adopted in the paper is graphical in nature, as opposed to mathematical models embedded in code using a high-level computer language. The well-developed graphic facilities available in an industry standard power system package, namely, MATLAB (Simulink) [7], is used to conduct all aspects of model implementation and to carry out extensive simulation studies. The control scheme for these devices is shown in Fig.1. The controller input is an error signal obtained from the
reference voltage and the value rms of the terminal voltage measured. Such error is processed by a PI controller and the output is the angle δ, which is provided to the PWM signal generator. The PWM generator then generates the pulse signals to the IGBT gates of voltage source converter [10].
Fig.1. PI Controller
(A) D-STATCOM
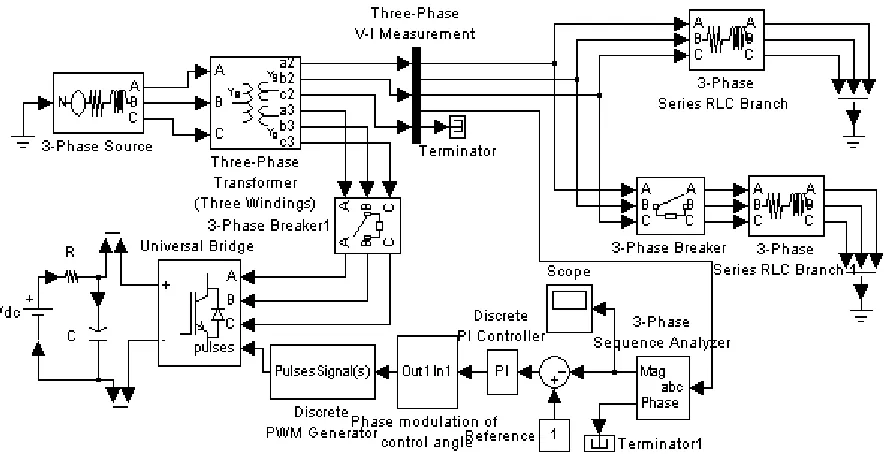
The test system employed to carry out the simulations concerning the DSTATCOM actuation for voltage sag compensation is shown in Fig.2. Such system is composed by a 230 kV, 50 Hz transmission system, represented by a Thevenin equivalent, feeding a distribution network through a 3-winding transformer connected in Y/Y/Y, 230/11/11 kV. To verify the working of a DSTATCOM, a variable load is connected at bus 2. During the simulation, in the period from 500 to 900 ms, the switch S1 is closed .The above test system is simulated under the environment of Matlab -Simulink and power system block set (PSB) the model used for this purpose is shown in the fig.3.
Fig.3. Simulink model for D-STATCOM
A set of simulations was carried out for the test system shown in Fig.2. The simulations relate to three main operating conditions.
1) In the simulation period 500–900 ms, the load is increased by closing switch S1. In this case, the voltage drops by almost 27% with respect to the reference value.
2) At 900 ms, the switch S1 is opened and remains so throughout the rest of the simulation. The load voltage is very close to the reference value, i.e., 1 pu.
3) In order to gain insight into the influence that capacitor size has on D-STATCOM performance, simulations were carried out with different size of capacitors . The total simulation period is 1.4 s.
Fig.4. Voltage response without DSTATCOM Fig 5 Voltage response with DSTATCOM
Similarly, a new set of simulations was carried out with the D -STATCOM connected to the system.
The results are shown in Fig.5. Where the very effective voltage regulation provided by the D-STATCOM can be clearly appreciated. When the switch S1 closes the D-STATCOM supplies reactive power to the system By way of example, Fig.5. shows the regulated rms voltage corresponding to a 750 F capacitor, where a rapid regulation response is obtained and transient overshoots are almost nonexistent.
(B) DVR
The test system employed to carry out the simulations concerning the DVR actuation is shown in Fig. 6. Such network is composed by a 13kV,50 Hz generation system, represented by a Thevenin equivalent, feeding two transmission lines through an3-winding transformer connected in Y/∆/∆ 13/115/115 kV. Such transmission lines feed two distribution networks through two transformers connected in ∆/Y, 115/11 kV. To verify the working of a DVR employed to avoid voltage sags during short -circuit, a fault is applied at point X via a resistance of 0.4 Ω. Such fault is applied from 500 to 900 ms.
Two simulations studies are carried out as follows:
1) The first simulation contains no DVR and a three–phase short-circuit fault is applied at point A, via a fault resistance of 0.4, during the period 500–900 ms. The voltage sag at the load point is almost 60% with respect to the reference voltage.
2) The second simulation is carried out using the same scenario as above but now with the DVR in operation. The total simulation period is 1.4 s.
Using the facilities available in MATLAB the DVR is simulated with the SIMULINK model shown in fig 7 to be in operation only for the duration of the fault, as it is expected to be the case in a practical situation.
Fig.8. Voltage response without DVR Fig 9: Voltage response with DVR
The results for both simulations are shown in Fig.8 and Fig.9 Voltage response without DVR is shown in Fig.8. When the DVR is in operation the voltage sag is mitigated almost completely, and the rms voltage at the sensitive load point is maintained at 98%, as shown in Fig. 9. The PWM control scheme controls the magnitude and the phase of the injected voltages, restoring the rms voltage very effectively [8]. The sag mitigation is performed with a smooth, stable, and rapid DVR response.
VI. Conclusions
Power quality measures can be applied both at the user end and also at the utility level. This paper has presented models of custom power equipment, namely D -STATCOM, DVR, and applied them to mitigate voltage dip which is very prominent as per utilities are concerned. The highly developed graphic facilities available in MATLAB/SIMULINK were used to conduct all aspects of model implementation and to carry out extensive simulation studies on test systems. A new PWM-based control scheme has been implemented to control the electronic valves in the two–level VSC used in the D-STATCOM and DVR. This characteristic makes it ideally suitable for low-voltage custom power applications. It was observed that in case of DSTATCOM capacity for power compensation and voltage regulation depends mainly on the rating of the dc storage device. The simulation results presented shows good accuracy with results reported in index journals.
VIII References
[1] H. Hingorani “Introducing Custom Power” IEEE Spectrum, vol.32 no.6 June 1995 p 41-48.
[2] John Stones and Alan Collinsion “Introduction to Power Quality, Power Engineering Journal
[3] N.G. Hingorani and L. Gyugyi, “Understanding FACTS: Concepts and Technology of Flexible AC Transmission Systems”
[4] M.H.Haque “Compensation of Distribution System Voltage Sag by DVR and DSTATCOM” Power Tech Proceedings, 2001 IEEE
Porto , Volume: 1 , 10-13 Sept. 2001 Pages:5 pp. vol.1
[5] TEQSIM International Inc., “Power System Blockset User'sGuide”, 2001. M. H. J. Bollen, “Understanding Power Quality
Problems—Voltage Sags and interruptions.