Combustion Quality Estimation in Power
Station Boilers using Median Threshold
Clustering Algorithms
*K.SUJATHA, **DR.N.PAPPA AND ***A. KALAIVANI *K.Sujatha, Research Scholar, Dept of Instrumentation Engg., M.I.T., Chromepet, CH-25. **Dr.N.Pappa, A.P., Dept of Instrumentation Engg. M.I.T., Chromepet, CH-25.
***A. Kalaivani, A.P., Dep of MCA, Easwari Engineering College, Ramapuram, Chennai-89. Abstract
The estimation of combustion quality in power station boilers is of great importance in the present scenario as it plays an important role in controlling the air pollution. The harmful gases like NOx and CO from the chimney causes air pollution. The amount of NOx and CO concentration in flue gas can be maintained within admissible limits by analyzing the flame colour. The colour of the flame is affected by combustion quality. When complete combustion takes place the amount these gases at the exit are within tolerance. Hence if the quality of combustion was estimated from the flame using image processing technique, it is possible to minimize the air pollution. This new strategy developed uses median threshold for feature reduction and various clustering algorithms to estimate the quality of combustion.
Key words
Combustion quality, Image J, Feature reduction, Median threshold, Image Processing, K-means clustering algorithm, Farthest first algorithm, DBSCAN
1. Introduction
The Neyveli Lignite Corporation (NLC), Neyveli, Tamil Nadu, India is one the major thermal power plants in India with highly modernized technology. The Thermal Power Station (TPS-Exp I) is the most recently renovated power station. The flame monitoring system used here indicates only the presence or absence of the flame inside the furnace. The major idea to determine the ON-OFF status was to prevent the explosion of boiler. The repeated addition of coal without monitoring the status of the flame will collapse the entire set up [1]. It is also possible to estimate the temperature and flue gas emissions by monitoring the flame colour [2, 3]. To avoid this situation the above said flame monitoring system is used. The existing set up at NLC is as shown in figure 1 below
1.1. Experimental set-up
The proposed technique for flame monitoring and combustion quality control includes the following device. The major components of the proposed flame monitoring system are
1. Infra-red camera placed inside a cooling jacket with servo-motor mechanism 2. CCTV set up placed in the control room
3. TV tuner for transferring the flame video from the CRT monitor on to the PC 4. Laptop connected to the TV tuner
5. The video file is split up into frames for further analysis
6. Image processing algorithms for analyzing the constituents of the flame 7. Intelligent control strategy to monitor and control the combustion quality 8. Validation of the developed system.
The features were extracted using Image J, the median threshold algorithm using Matlab for feature reduction and clustering algorithms like K-means, Farthest First and DB Scan algorithms [6, 7] was implemented with Weka.
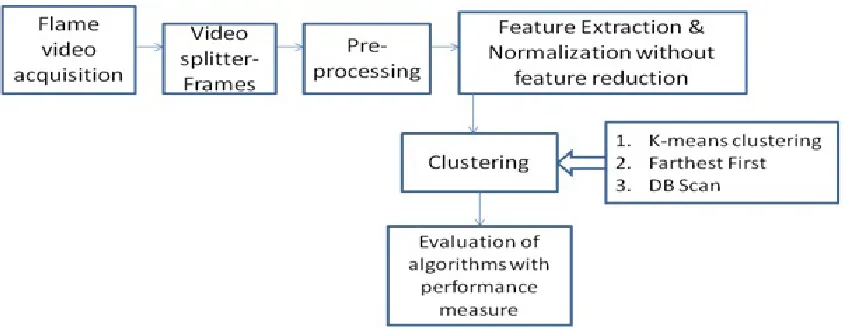
2. Materials and Methods
The following stages are involved in flame video analysis is as shown in figure 2 a, b and c
Step 1: The video file is further processed by splitting into frames using any video splitter Step 2: The flame images are pre-processed for noise removal
Step 3: The features are extracted using Image J and normalised using Min-Max method Step 4: Features are reduced using Median threshold algorithm
Figure 2 (b). Procedural block diagram for flame image analysis by clustering without feature reduction
Figure 2 (c). Procedural block diagram for flame image analysis for combustion quality control
2.1 Pre-processing
Pre-processing is done to remove noise. The frame size acquired was 320x240. It is sufficient that we take 30x30 portion of the image for further analysis. Median filtering was done to remove noise. Histogram analysis was done to find the quality of the acquired image.
2.1.1 Median filtering
The extracted flame images if corrupted with noise, then filtering need to be done. Median filter was used for noise removal. The simulation for addition and removal of noise was done using Image J. Figure 3 shows the effect of median filter on the corrupted image.
Figure 3. Effect of median filtering on the corrupted flame image
(a)
Original flame image(b)
Flame image corrupted2.1.2 Histogram Analysis
Histogram is the plot of the intensity values and the frequency of occurrence. If the dynamic range of the histogram is large then the quality of combustion is good. The dynamic range is the difference between the maximum and minimum intensity values. The plot in figure 4 shown below was obtained using Image J
Figure 4. Histogram for flame images captured with varying combustion conditions
(a) Complete Combustion (b) Incomplete combustion
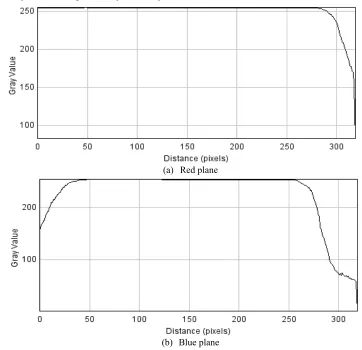
Since the flame images acquired vary with colour intensity under different combustion conditions it becomes a must to analyse the images in R, G and B planes. The results of the analysis in all the three are shown in the figure 5 below
Figure 5. Profile plot for flame images in R,G,B plane for complete combustion
(a) Red plane
(c) Green plane
Figure 6. Profile of the flame image with complete and incomplete combustion
(a) Complete combustion (b) Incomplete combustion
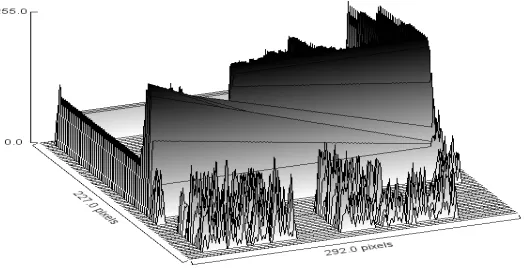
The figure 6 above shows the profile of the flame images obtained under complete and incomplete combustion conditions. It is inferred that the intensity value changes with respect to quality of combustion. If the combustion is complete then the maximum intensity value is 255 but whereas for incomplete combustion the maximum intensity value is only 85. Similarly the surface plot in figure 9 shows that the flame image has many pixels with intensity closer to 255.
Figure 7. Surface plot for flame images obtained when the combustion is complete
2.2 Feature Extraction
2.3 Normalization
The extracted features for complete and incomplete combustion are normalized using the Min-Max criteria. Normalization reduces computational complexity. Features extracted and normalized using Image J for complete and incomplete combustion.
2.4Feature reduction
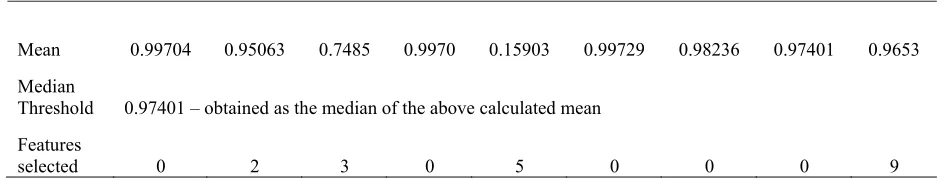
The features were selected using the median threshold algorithm given below. The statistical measures like mean and median were selected as the threshold values. Previously the threshold was the mean and overall mean. Considering median as the threshold yields better results. The block diagram for feature reduction is given in figure 8 and the results are tabulated in table 1 below
1) The mean of each column was calculated
2) The threshold was calculated by finding the median for the mean of each feature
3) The features having a mean less than or equal to the threshold were alone selected. The selected features alone are numbered serially and those unselected were numbered ‘0’
Figure 8. Block diagram for Median threshold algorithm
Table 1. Central Measure based on Statistical - including all features using Min-Max Normalization
Mean 0.99704 0.95063 0.7485 0.9970 0.15903 0.99729 0.98236 0.97401 0.9653
Median
Threshold 0.97401 – obtained as the median of the above calculated mean Features
selected 0 2 3 0 5 0 0 0 9
2.5 Clustering
This was done to cluster the images belonging to the two categories. The K-means algorithm, Farthest First and Density Based Spatial Clustering of Application with Noise (DBSCAN) algorithms are used to identify the combustion conditions. The above said algorithms are implemented using Weka.
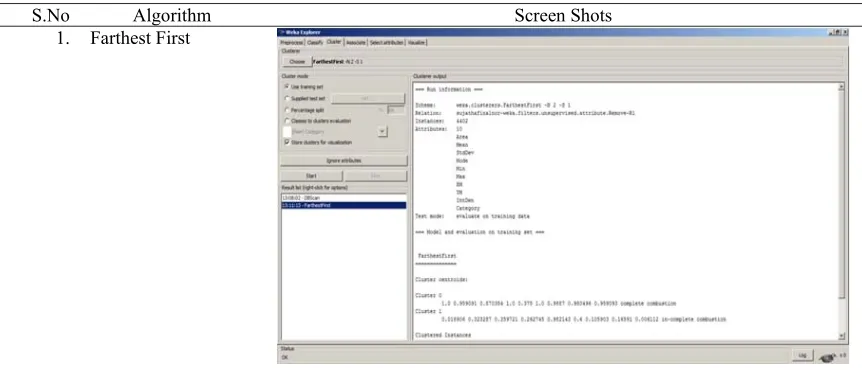
2.5.1 Farthest First Algorithm
The k-center clustering problem is also called minmax radius clustering problem, whose objective is to
minimize the maximum diameter of any cluster on some set of points. A simple 2-approximation algorithm for the k-center clustering problem is proposed by Gonzales, which utilizes a farthest-point clustering heuristic. In this paper, the algorithm and its variant are used as the initialization methods for k-modes clustering. The
farthest-point heuristic starts with an arbitrary point s1. Pick a point s2 that is as far from s1 as possible. Pick si
to maximize the distance to the nearest of all centroids picked so far. That is, maximize the min {dist (si, s1), dist (si, s2) ...}. After all k representatives are chosen we can define the partition of D: cluster Cj consists of all
points closer to sj than to any other representative. As shown in, let the maximum radius of these k clusters be σ,
then even in the optimal k-clustering the maximum radius must be at least σ / 2. Here optimal is in the sense of
minimizing the maximum radius of any cluster. Obviously, farthest-point heuristic based method has the time complexity O (nk), where n is number of objects in the dataset and k is number of desired clusters. Furthermore,
one can implement farthest-point heuristic based method in constant dimension in O (nlogk) time. In fact, it can be solved in O (n) this case. Clearly, farthest-point heuristic based method is fast and suitable for large-scale
2.5.2 Density Based Spatial Clustering of Application with Noise (DBSCAN)
DBSCAN is a data clustering algorithm proposed by Martin Ester, Hans-Peter Kriegel, Jörg Sander and Xiaowei Xu in 1996. It is a density based clustering algorithm because it finds a number of clusters starting from the estimated density distribution of corresponding nodes. DBSCAN is one of the most common clustering algorithms and also most cited in scientific literature. DBSCAN's definition of a cluster is based on the notion of density reach-ability. Basically, a point q is directly density-reachable from a point p if it is not farther away
than a given distance ε (i.e., is part of its ε-neighbourhood), and if p is surrounded by sufficiently many points
such that one may consider p and q be part of a cluster. q is called density-reachable from p if there is a
sequence of points with and p1 = p and pn = q where each pi + 1 is directly density-reachable from pi. Note that the relation of density-reachable is not symmetric (since q might lie on the edge of a cluster, having
insufficiently many neighbours to count as a genuine cluster element), so the notion of density-connected is
introduced at two points p and q are density-connected if there is a point o such that o and p as well as o and q
are density-reachable [10]. A cluster, which is a subset of the points of the database, satisfies two properties: 1. All points within the cluster are mutually density-connected.
2. If a point is density-connected to any point of the cluster, it is part of the cluster as well.
2.5.3 K-means algorithm
K-means clustering is a well-known method of assigning cluster membership by minimizing the differences among items in a cluster while maximizing the distance between clusters. The "means" in k-means refers to the centroid of the cluster, which is a data point that is chosen arbitrarily and then refined iteratively until it represents the true mean of all data points in the cluster. The "k" refers to an arbitrary number of points that are used to seed the clustering process. The k-means algorithm calculates the squared Euclidean distances between data records in a cluster and the vector that represents the cluster mean, and converges on a final set of k clusters when that sum reaches its minimum value [9].
3. Results and Discussions
The results for the clustering algorithms with and without feature reduction are shown below. The results obtained by using WEKA were tabulated in table 2 below
Table 2. Screen shots for Farthest First, DB scan and K-means algorithms using Weka
S.No Algorithm Screen Shots
2. DB Scan
3. K-means Clustering
Figure 9. Comparison chart for K-means, Farthest First and DB Scan algorithms
4. Conclusion
Thus the flame monitoring system was designed to automate the estimation of combustion quality in water tube boilers. This technique adds value as it is possible to infer combustion quality from the flame status thereby reducing the flue gas emissions. The Farthest First and DB scan clustering algorithms with reduced feature set provides better performance when compared to the other type. The above said statement is well established from the figure 9. The same can be extended to identify the flame temperature and thereby infer the flue gas emissions so as to automate the entire process.
5. References
[1] Gang Lu a, Yong Yan a, Steve Cornwell b, Michael Whitehouse b, Gerry Riley b, Impact of co-firing coal and biomass on flame
characteristics and stability, Elsevier, pp: 1133–1140, 2007.
[2] Dr. G. Lu and Prof. Yan, Advanced Monitoring and Characterization of combustion flames, 20th annual meeting and meeting of the
Advanced Power Generation Division, University of Leeds, April 2009.
[3] C K Tan, S J.Wilcox, J Ward and M Lewitt Monitoring near burner slag deposition with a hybrid neural network system,
MEASUREMENTSCIENCEANDTECHNOLOGY, April 2003.
[4] G Gilabert, G Lu and Y Yan,Three dimensional visualisation and reconstruction of the luminosity distribution of a flame using digital
imaging Techniques, Sensors & their Applications, pp:167–171, 2005.
[5] M.G. Abdul Rahman, J.R. Gibbins, A.K. Forrest, Combustion in Power Station Boilers –Advanced Monitoring Using Imaging, First
published 2004 © Imperial College of Science, Technology and Medicine copyright 2004Pu Han, Xin Zhang, Chenggang Zhen and Bing Wang ,Boiler Flame Image Classification Based on Hidden Markov Model, IEEE ISIE 2006, July 9-12, Montreal, Quebec, Canada, 2006
[6] Mikhail Bilenko, Sugato Basu, Raymond J. Mooney, Integrating Constraints and Metric Learning in Semi-Supervised Clustering,
Proceedings of the 21st International Conference on Machine Learning,(ICML-2004), pp. 81-88, Banff, Canada, July, 2004
[7] Enrique Teruela, Cristóbal Cortésb, Luis Ignacio Díezb, Inmaculada Arauzob, Monitoring and prediction of fouling in coal-fired utility boilers using neural networks, Chemical Engineering Science 60 (2005) 5035 – 5048.
[8] Susanne Paulruda, Calle Nilsson, The effects of particle characteristics on emissions from burning wood fuel powder, Fuel 83 (2004).
[9] [9] Kanungo, T,Mount, D. M., Netanyahu, N. S.; Piatko, C. D.; Silverman, R., Wu, An efficient k-means clustering algorithm:
Analysis and implementation, IEEE Trans. Pattern Analysis and Machine Intelligence, 24: 881–892, 2002.
[10] Sander, Jörg, Ester, Martin, Kriegel, Hans-Pete,; Xu, Xiaowei, Density-Based Clustering in Spatial Databases, The Algorithm