R E S E A R C H A R T I C L E
Open Access
Methods for identifying 30 chronic conditions:
application to administrative data
Marcello Tonelli
1*, Natasha Wiebe
2, Martin Fortin
3, Bruce Guthrie
4, Brenda R Hemmelgarn
1, Matthew T James
1,
Scott W Klarenbach
2, Richard Lewanczuk
5, Braden J Manns
1, Paul Ronksley
6, Peter Sargious
5, Sharon Straus
7,
Hude Quan
6and For the Alberta Kidney Disease Network
Abstract
Background:Multimorbidity is common and associated with poor clinical outcomes and high health care costs. Administrative data are a promising tool for studying the epidemiology of multimorbidity. Our goal was to derive and apply a new scheme for using administrative data to identify the presence of chronic conditions and multimorbidity.
Methods:We identified validated algorithms that use ICD-9 CM/ICD-10 data to ascertain the presence or absence of 40 morbidities. Algorithms with both positive predictive value and sensitivity≥70% were graded as“high validity”; those with positive predictive value≥70% and sensitivity <70% were graded as“moderate validity”. To show proof of concept, we applied identified algorithms with high to moderate validity to inpatient and outpatient claims and utilization data from 574,409 people residing in Edmonton, Canada during the 2008/2009 fiscal year.
Results:Of the 40 morbidities, we identified 30 that could be identified with high to moderate validity.
Approximately one quarter of participants had identified multimorbidity (2 or more conditions), one quarter had a single identified morbidity and the remaining participants were not identified as having any of the 30 morbidities.
Conclusions:We identified a panel of 30 chronic conditions that can be identified from administrative data using validated algorithms, facilitating the study and surveillance of multimorbidity. We encourage other groups to use this scheme, to facilitate comparisons between settings and jurisdictions.
Keywords:Multimorbidity, Administrative data
Background
Management of chronic disease is the major challenge facing health systems worldwide [1]. Many people with chronic disease have multiple chronic conditions, which is termed multimorbidity [2]. It is clear that multimor-bidity is common and associated with worse clinical out-comes and higher health care costs, compared to good health or to the presence of a single chronic condition [3-6]. However, there are key knowledge gaps concerning the basic epidemiology of multimorbidity [7]; its clinical and economic consequences; and how it contributes to disparities in health [8]. This information is prerequisite to mitigating the impact of multimorbidity and chronic disease [9].
Multimorbidity has been identified as a key research priority by the Public Health Agency of Canada, and is crucial to inform programming and resource forecasting. Knowledge of secular changes in the incidence and preva-lence of multimorbidity is required, and would be facilitated by methods for identifying the presence of multimorbidity using administrative data.
Identifying morbidity using administrative data can be simple (e.g., based on a single hospitalization and using only a small number of codes) or complex (e.g., includ-ing inpatient and outpatient encounters and long lists of codes). Once developed, algorithms may be validated against a suitable gold standard (e.g., chart reviews; other previously validated algorithms).
Previous work by Barnett et al [3] identified 40 morbid-ities and were informed by a systematic review of multi-morbidity measures [10], the Quality and Outcomes * Correspondence:[email protected]
1Department of Medicine, University of Calgary, Calgary, Canada
Full list of author information is available at the end of the article
© 2015 Tonelli et al.; licensee BioMed Central. This is an Open Access article distributed under the terms of the Creative Commons Attribution License (http://creativecommons.org/licenses/by/4.0), which permits unrestricted use, distribution, and reproduction in any medium, provided the original work is properly credited. The Creative Commons Public Domain Dedication waiver (http://creativecommons.org/publicdomain/zero/1.0/) applies to the data made available in this article, unless otherwise stated.
Framework of the UK General Practice contract, and health service planning by NHS Scotland. However, these authors used administrative data sources that are unique to the United Kingdom to identify the presence or absence of these conditions. A corresponding scheme based on the more widely used ICD-9 CM/ICD-10 sys-tem is not available.
Therefore, we first identified previously validated algo-rithms that use the ICD-9 CM/ICD-10 system for ascer-taining the presence of chronic conditions using inpatient and outpatient claims and utilization data. We then showed proof of concept for using administrative data to study multimorbidity, by applying these previously vali-dated algorithms to a population of adults residing in Edmonton, Canada between April 2008 and March 2009.
Methods
The institutional review boards at the University of Alberta (Pro00038795) and the University of Calgary (E22590) ap-proved the study.
Morbidities
We did a focused literature search for validated algo-rithms that use ICD-9 CM/ICD-10 codes in administra-tive data from inpatient and outpatient encounters to ascertain the presence or absence of the 40 morbidities identified by Barnett et al [3]. We searched MEDLINE using combinations of the following MeSH subject headings together with the specific morbidity of inter-est:‘International Classification of Diseases’,‘ Reproduci-bility of Results’, and ‘Sensitivity and Specificity’. Based on an a priori decision, we considered algorithms to be of high validity if they had both positive predictive value (PPV) and sensitivity≥70% as compared to an acceptable gold standard such as chart review. We considered algo-rithms to be of moderate validity if they had PPV ≥70% but sensitivity <70%. The cut-off values for PPV and sensitivity were based on previous validation studies of administrative data [11]. We did not consider negative predictive value or specificity, because these parameters are generally >90% in studies of chronic diseases among the general population [11,12]. The definition of multi-morbidity required the coexistence of two or more of the morbidities. In a secondary analysis we used a more restrictive definition that required three or more mor-bidities to be present.
ICD codes
Canadian hospital discharge abstract data are coded with ICD-10 CA, which essentially increases specificity com-pared to the ICD-10 system by adding more digits [11]. All of the ICD-10 codes from the included algorithms are consistent with ICD-10 CA codes, and thus we used ICD-10 and ICD-10 CA codes interchangeably throughout
this manuscript. When ICD-10 codes were not given in the primary papers, we used the Canadian Institute for Health Information (CIHI; www.cihi.ca) conversion table to convert ICD-9 CM codes to ICD-10 codes. Many algo-rithms required multiple codes within a specified time period to determine incidence of morbidity (Table 1). In each case the index date for the disease was considered to be the date of the first code. For example, in order to de-termine presence of asthma, we searched for ICD-9 CM 493 and ICD-10 J45 codes in hospitalizations and out-patient encounters. We considered asthma to have de-veloped at the first instance of a single hospitalization with either of these codes, or a single outpatient en-counter followed by two further outpatient enen-counters with either of these codes within two years. In either case, we considered the participant to have asthma for the duration of follow-up.
Proof of concept
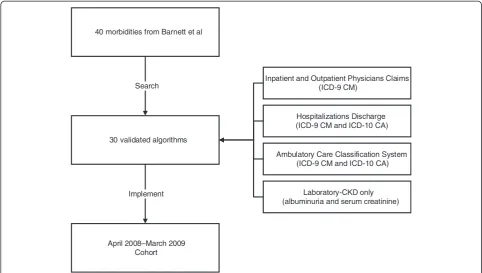
We applied identified algorithms with high or moderate validity to a population-based administrative dataset from Alberta Health (AH; the provincial health ministry) and Alberta clinical laboratories. Details of this administrative dataset including claims, hospitalizations and Ambulatory Care Classification System (ACCS) utilization are given in Figure 1 and have been reported elsewhere [13]. We as-sembled a cohort of adults aged≥18 years who resided in the city of Edmonton, Alberta between April 2008 and March 2009, and included all people registered with AH. All Alberta residents are eligible for insurance coverage by AH, and >99% participate in this coverage. The dataset included demographic information such as postal code of residence, laboratory data, and medication in those aged ≥65 years [13]. We identified Edmonton residents from the AH registry file using the community name variable from the Statistics Canada Postal Code 2008 Conversion file [14] (www.statcan.gc.ca).
To demonstrate proof of concept for applying these al-gorithms to a large administrative dataset, we presented a simple summary of the prevalence of morbidity and multimorbidity in the study population. Counts and per-centages were presented along with a figure showing how the number of morbidities varies by age. In sensitivity ana-lyses, we presented the prevalence of morbidity as assessed by different sources of administrative data.
Results Algorithms
We identified 16 morbidities for which the best identified algorithm was of high validity: asthma, atrial fibrillation, metastatic cancer, chronic heart failure, chronic kidney dis-ease, chronic pain, cirrhosis, diabetes, hypertension, irritable bowel syndrome, multiple sclerosis, myocardial infarction, peripheral vascular disease, psoriasis, schizophrenia and
Table 1 Administrative algorithms for 30 morbidities
Number and nature of claims required to substantiate the diagnosis
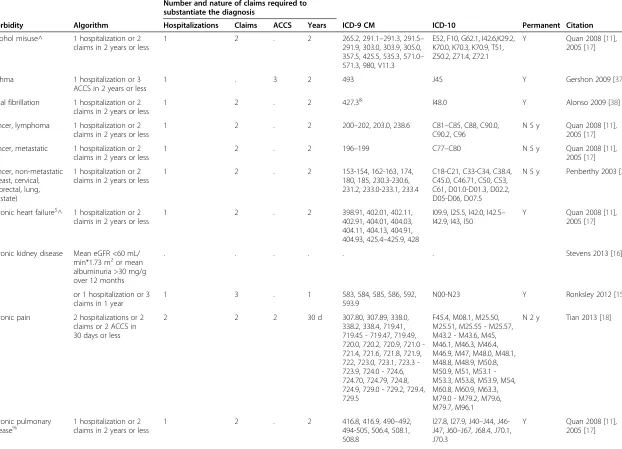
Morbidity Algorithm Hospitalizations Claims ACCS Years ICD-9 CM ICD-10 Permanent Citation
Alcohol misuse^ 1 hospitalization or 2 claims in 2 years or less
1 2 . 2 265.2, 291.1–291.3, 291.5–
291.9, 303.0, 303.9, 305.0, 357.5, 425.5, 535.3, 571.0– 571.3, 980, V11.3
E52, F10, G62.1, I42.6,K29.2, K70.0, K70.3, K70.9, T51, Z50.2, Z71.4, Z72.1
Y Quan 2008 [11], 2005 [17]
Asthma 1 hospitalization or 3 ACCS in 2 years or less
1 . 3 2 493 J45 Y Gershon 2009 [37]
Atrial fibrillation 1 hospitalization or 2 claims in 2 years or less
1 2 . 2 427.3& I48.0 Y Alonso 2009 [38]
Cancer, lymphoma 1 hospitalization or 2 claims in 2 years or less
1 2 . 2 200–202, 203.0, 238.6 C81–C85, C88, C90.0,
C90.2, C96
N 5 y Quan 2008 [11], 2005 [17]
Cancer, metastatic 1 hospitalization or 2 claims in 2 years or less
1 2 . 2 196–199 C77–C80 N 5 y Quan 2008 [11],
2005 [17]
Cancer, non-metastatic (breast, cervical, colorectal, lung, prostate)
1 hospitalization or 2 claims in 2 years or less
1 2 . 2 153-154, 162-163, 174,
180, 185, 230.3-230.6, 231.2, 233.0-233.1, 233.4
C18-C21, C33-C34, C38.4, C45.0, C46.71, C50, C53, C61, D01.0-D01.3, D02.2, D05-D06, D07.5
N 5 y Penberthy 2003 [39]
Chronic heart failure$^ 1 hospitalization or 2
claims in 2 years or less
1 2 . 2 398.91, 402.01, 402.11,
402.91, 404.01, 404.03, 404.11, 404.13, 404.91, 404.93, 425.4–425.9, 428
I09.9, I25.5, I42.0, I42.5– I42.9, I43, I50
Y Quan 2008 [11], 2005 [17]
Chronic kidney disease Mean eGFR <60 mL/ min*1.73 m2or mean
albuminuria >30 mg/g over 12 months
. . . Stevens 2013 [16]
or 1 hospitalization or 3 claims in 1 year
1 3 . 1 583, 584, 585, 586, 592,
593.9
N00-N23 Y Ronksley 2012 [15]
Chronic pain 2 hospitalizations or 2 claims or 2 ACCS in 30 days or less
2 2 2 30 d 307.80, 307.89, 338.0,
338.2, 338.4, 719.41, 719.45 - 719.47, 719.49, 720.0, 720.2, 720.9, 721.0 -721.4, 721.6, 721.8, 721.9, 722, 723.0, 723.1, 723.3 -723.9, 724.0 - 724.6, 724.70, 724.79, 724.8, 724.9, 729.0 - 729.2, 729.4, 729.5
F45.4, M08.1, M25.50, M25.51, M25.55 - M25.57, M43.2 - M43.6, M45, M46.1, M46.3, M46.4, M46.9, M47, M48.0, M48.1, M48.8, M48.9, M50.8, M50.9, M51, M53.1 -M53.3, M53.8, M53.9, M54, M60.8, M60.9, M63.3, M79.0 - M79.2, M79.6, M79.7, M96.1
N 2 y Tian 2013 [18]
Chronic pulmonary
disease% 1 hospitalization or 2claims in 2 years or less 1 2 . 2 416.8, 416.9, 490494-505, 506.4, 508.1,–492,
508.8
I27.8, I27.9, J40–J44, J46-J47, J60–J67, J68.4, J70.1, J70.3
Y Quan 2008 [11], 2005 [17]
Tonelli
et
al.
BMC
Medical
Informati
cs
and
Decision
Making
(2015) 15:31
Page
3
of
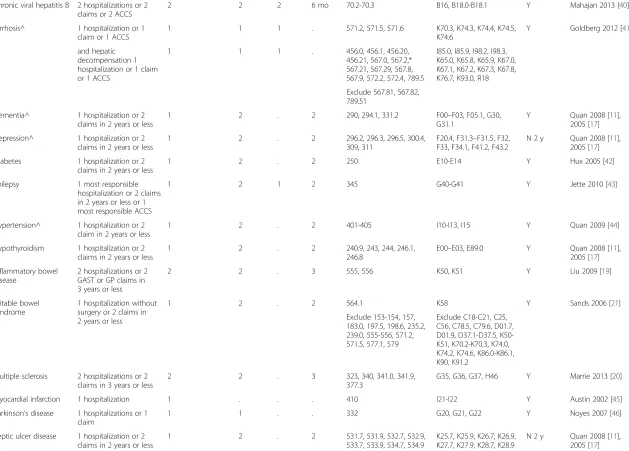
Table 1 Administrative algorithms for 30 morbidities(Continued)
Chronic viral hepatitis B 2 hospitalizations or 2 claims or 2 ACCS
2 2 2 6 mo 70.2-70.3 B16, B18.0-B18.1 Y Mahajan 2013 [40]
Cirrhosis^ 1 hospitalization or 1 claim or 1 ACCS
1 1 1 . 571.2, 571.5, 571.6 K70.3, K74.3, K74.4, K74.5,
K74.6
Y Goldberg 2012 [41]
and hepatic decompensation 1 hospitalization or 1 claim or 1 ACCS
1 1 1 . 456.0, 456.1, 456.20,
456.21, 567.0, 567.2,* 567.21, 567.29, 567.8, 567.9, 572.2, 572.4, 789.5
I85.0, I85.9, I98.2, I98.3, K65.0, K65.8, K65.9, K67.0, K67.1, K67.2, K67.3, K67.8, K76.7, K93.0, R18
Exclude 567.81, 567.82, 789.51
Dementia^ 1 hospitalization or 2 claims in 2 years or less
1 2 . 2 290, 294.1, 331.2 F00–F03, F05.1, G30,
G31.1
Y Quan 2008 [11], 2005 [17]
Depression^ 1 hospitalization or 2 claims in 2 years or less
1 2 . 2 296.2, 296.3, 296.5, 300.4,
309, 311
F20.4, F31.3–F31.5, F32, F33, F34.1, F41.2, F43.2
N 2 y Quan 2008 [11], 2005 [17]
Diabetes 1 hospitalization or 2 claims in 2 years or less
1 2 . 2 250 E10-E14 Y Hux 2005 [42]
Epilepsy 1 most responsible hospitalization or 2 claims in 2 years or less or 1 most responsible ACCS
1 2 1 2 345 G40-G41 Y Jette 2010 [43]
Hypertension^ 1 hospitalization or 2 claim in 2 years or less
1 2 . 2 401-405 I10-I13, I15 Y Quan 2009 [44]
Hypothyroidism 1 hospitalization or 2 claims in 2 years or less
1 2 . 2 240.9, 243, 244, 246.1,
246.8
E00–E03, E89.0 Y Quan 2008 [11], 2005 [17]
Inflammatory bowel disease
2 hospitalizations or 2 GAST or GP claims in 3 years or less
2 2 . 3 555, 556 K50, K51 Y Liu 2009 [19]
Irritable bowel syndrome
1 hospitalization without surgery or 2 claims in 2 years or less
1 2 . 2 564.1 K58 Y Sands 2006 [21]
Exclude 153-154, 157, 183.0, 197.5, 198.6, 235.2, 239.0, 555-556, 571.2, 571.5, 577.1, 579
Exclude C18-C21, C25, C56, C78.5, C79.6, D01.7, D01.9, D37.1-D37.5, K50-K51, K70.2-K70.3, K74.0, K74.2, K74.6, K86.0-K86.1, K90, K91.2
Multiple sclerosis 2 hospitalizations or 2 claims in 3 years or less
2 2 . 3 323, 340, 341.0, 341.9,
377.3
G35, G36, G37, H46 Y Marrie 2013 [20]
Myocardial infarction 1 hospitalization 1 . . . 410 I21-I22 Y Austin 2002 [45]
Parkinson’s disease 1 hospitalizations or 1 claim
1 1 . . 332 G20, G21, G22 Y Noyes 2007 [46]
Peptic ulcer disease 1 hospitalization or 2 claims in 2 years or less
1 2 . 2 531.7, 531.9, 532.7, 532.9,
533.7, 533.9, 534.7, 534.9
K25.7, K25.9, K26.7, K26.9, K27.7, K27.9, K28.7, K28.9
N 2 y Quan 2008 [11], 2005 [17]
Tonelli
et
al.
BMC
Medical
Informati
cs
and
Decision
Making
(2015) 15:31
Page
4
of
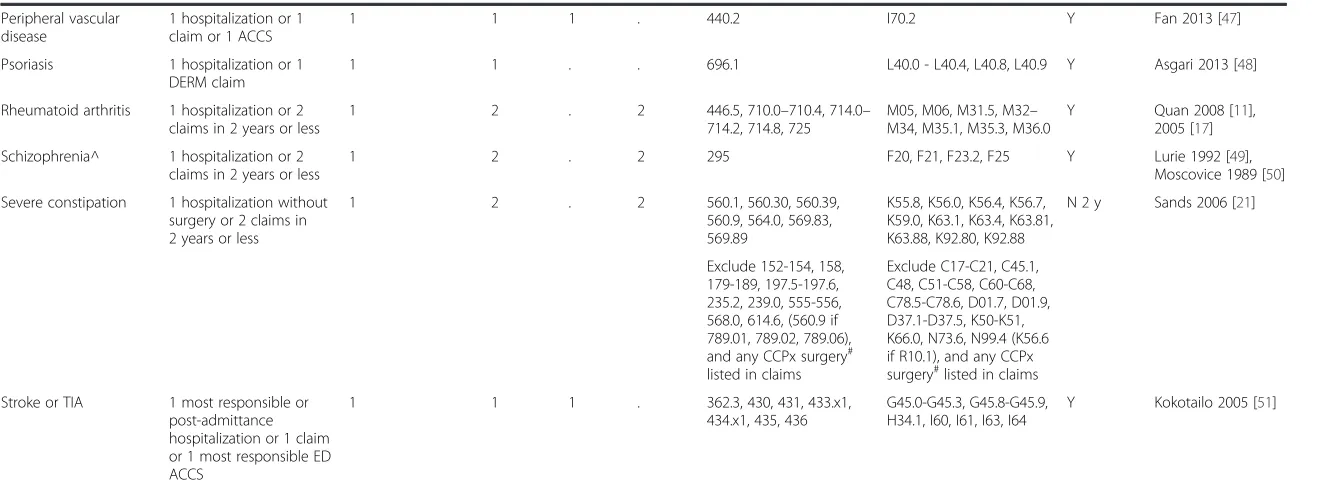
Table 1 Administrative algorithms for 30 morbidities(Continued)
Peripheral vascular disease
1 hospitalization or 1 claim or 1 ACCS
1 1 1 . 440.2 I70.2 Y Fan 2013 [47]
Psoriasis 1 hospitalization or 1 DERM claim
1 1 . . 696.1 L40.0 - L40.4, L40.8, L40.9 Y Asgari 2013 [48]
Rheumatoid arthritis 1 hospitalization or 2 claims in 2 years or less
1 2 . 2 446.5, 710.0–710.4, 714.0–
714.2, 714.8, 725
M05, M06, M31.5, M32– M34, M35.1, M35.3, M36.0
Y Quan 2008 [11], 2005 [17]
Schizophrenia^ 1 hospitalization or 2 claims in 2 years or less
1 2 . 2 295 F20, F21, F23.2, F25 Y Lurie 1992 [49],
Moscovice 1989 [50]
Severe constipation 1 hospitalization without surgery or 2 claims in 2 years or less
1 2 . 2 560.1, 560.30, 560.39,
560.9, 564.0, 569.83, 569.89
K55.8, K56.0, K56.4, K56.7, K59.0, K63.1, K63.4, K63.81, K63.88, K92.80, K92.88
N 2 y Sands 2006 [21]
Exclude 152-154, 158, 179-189, 197.5-197.6, 235.2, 239.0, 555-556, 568.0, 614.6, (560.9 if 789.01, 789.02, 789.06), and any CCPx surgery# listed in claims
Exclude C17-C21, C45.1, C48, C51-C58, C60-C68, C78.5-C78.6, D01.7, D01.9, D37.1-D37.5, K50-K51, K66.0, N73.6, N99.4 (K56.6 if R10.1), and any CCPx surgery#listed in claims
Stroke or TIA 1 most responsible or post-admittance hospitalization or 1 claim or 1 most responsible ED ACCS
1 1 1 . 362.3, 430, 431, 433.x1,
434.x1, 435, 436
G45.0-G45.3, G45.8-G45.9, H34.1, I60, I61, I63, I64
Y Kokotailo 2005 [51]
ACCS ambulatory care classification system, ICD-9 CM International Classification of Diseases 9th
Revision Clinical Modification, ICD-10 International Classification of Diseases 10th
Revision, CCPx Canadian Classification of Procedures, eGFR estimated glomerular filtration rate, GAST gastroenterologist, GP general practitioner, DERM dermatologist, ED emergency department, TIA transient ischemic attack.
Any diagnosis field was considered in the algorithms except when the original text specified otherwise. The index date for disease was set as the date for the first relevant claim. Diseases denoted as“permanent” were assumed to be present continuously from the index date; diseases that are not“permanent”were considered to remit if no claims were present for a specified period of time.
*The author did not intend 567.2 to generalize and include 567.22 or 567.23
#
CCPx surgery codes in claims were included as exclusions for hospitalizations for severe constipation.
&
In claims the specific ICD-9 CM code for atrial fibrillation was not in use and so the less specific code 427.3 (which includes atrial flutter) was used in place of 427.31.
%
The ICD-9 CM code 493 and the ICD-10 code J45 was removed from the chronic pulmonary disease algorithm as it was also included in the asthma algorithm.
$
The ICD-10 codes I11 and I12 were eliminated from chronic heart failure as separate codes for heart failure are required.
^A number of codes were legitimately used in more than one algorithm: alcohol misuse and chronic heart failure (425.5, I42.6), alcohol misuse and cirrhosis (571.2, K70.3), chronic heart failure and hypertension (402.91, 404.01, 404.03, 404.11, 404.13, 404.91, 404.93), and depression and schizophrenia (F20.4).
Tonelli
et
al.
BMC
Medical
Informati
cs
and
Decision
Making
(2015) 15:31
Page
5
of
severe constipation. We identified an additional 14 morbid-ities (including two algorithms for other types of cancer and one algorithm for another type of liver disease) for which the best identified algorithm was of moderate validity: alcohol misuse, lymphoma, non-metastatic cancer (breast, cervical, colorectal, lung, and prostate), chronic pulmonary disease, chronic viral hepatitis B, dementia, de-pression, epilepsy, hypothyroidism, inflammatory bowel disease, Parkinson’s disease, peptic ulcer disease, rheuma-toid arthritis, and stroke or transient ischemic attack. We excluded the remaining morbidities for which no suitable algorithm could be identified (Additional file 1 Table S1). Thus we identified 30 conditions using administrative al-gorithms (including ICD-9 CM and ICD-10 codes) that are summarized in the Table 1. Of these 30 algorithms, half were validated for both ICD-9 CM and ICD-10 codes. We identified all conditions exclusively using ICD-9 CM and ICD-10 data with the exception of chronic kidney dis-ease, for which we used a validated algorithm applied to ICD-9 CM and ICD-10 data [15] and supplemented using serum creatinine and albuminuria data [16]. We consid-ered chronic kidney disease to be present if a participant met either the administrative or laboratory criteria.
In some cases, we made minor changes to the published algorithms to improve anticipated diagnostic performance, to increase consistency between algorithms used for the
different conditions, and to include application to the out-patient setting. First, the original publications by Quan et al [11,17] required one hospitalization to identify the pres-ence of a chronic condition; based on input from the first author of that paper, we modified this algorithm to allow either one inpatient code or two outpatient codes within two years to define the presence of these conditions. Second, to improve mapping of ICD-9 codes from the original (published) algorithm into ICD-10, we com-bined the ‘highly likely’and the ‘likely’codes from the original algorithm for chronic pain [18]. Third, for consistency, we modified algorithms that defined condi-tions as present if participants had two codes within any duration of follow-up (no matter how long) to require that the two codes occur within a three year period [19,20]. Fourth, we expanded the criteria for presence of atrial fibrillation, epilepsy, irritable bowel syndrome, and severe constipation to include two outpatient codes within two years for these conditions. However, to ensure that secondary (post-surgical) bowel complications were not in-correctly classified as chronic bowel conditions, we ex-cluded any hospitalization for surgery when assessing the presence or absence of these conditions [21]. Fifth, we ex-panded the criteria for presence of stroke or TIA to include one outpatient code. Sixth, we reviewed all algorithms for overlapping codes (situations where the same code was 40 morbidities from Barnett et al
30 validated algorithms Search
April 2008–March 2009 Cohort Implement
Inpatient and Outpatient Physicians Claims (ICD-9 CM)
Hospitalizations Discharge (ICD-9 CM and ICD-10 CA)
Ambulatory Care Classification System (ICD-9 CM and ICD-10 CA)
Laboratory-CKD only (albuminuria and serum creatinine)
Figure 1Development of the cohort. ICD International Classification for Diseases, CKD chronic kidney disease. Barnett K, Mercer SW, Norbury M, Watt G, Wyke S, Guthrie B. Epidemiology of multimorbidity and implications for health care, research, and medical education: a cross-sectional study.Lancet.2012;380(9836):37-43.
used to identify more than one condition), and modified the algorithms to avoid double-counting of morbidities (see footnotes in the Table 1 for specific details).
Application of the algorithms to the Edmonton cohort The study cohort included 574,409 participants (Figure 1, Table 2). Almost two-thirds were less than 50 years of age. Ten percent were 70 years of age or older and the propor-tion of men and women was similar. Approximately half of all participants were not identified as having any of the 30 morbidities for which high or moderate validity algo-rithms existed. Approximately one quarter were identified as having one of these 30 morbidities. Another quarter were identified as having 2 or more of these 30 morbid-ities (meeting the primary criterion for multimorbidity), whereas 12% had three or more (meeting the secondary criterion for multimorbidity).
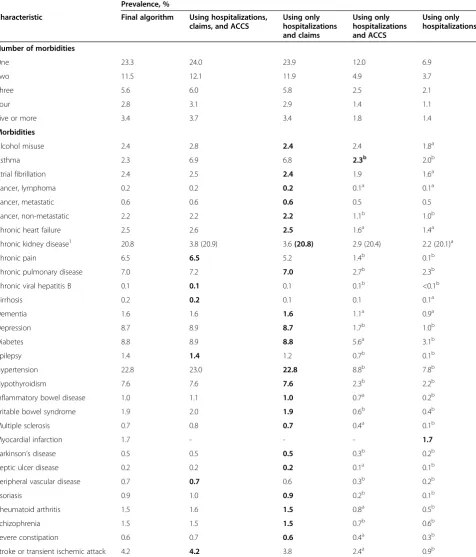
The apparent prevalence of most morbidities was greatly reduced (often by 50% or more) when we assessed their presence or absence using hospitalization data only (Table 2). The addition of ACCS data to hospitalization and claims data made little difference to prevalence esti-mates, with the possible exceptions of chronic pain, hepa-titis B and cirrhosis (the prevalences of which all changed by >20%). In most cases, the algorithms as originally vali-dated resulted in a prevalence that was intermediate be-tween the most inclusive approach (using hospitalization, claims and ACCS data) and the most restrictive approach (using hospitalization data only). As expected, adding gold standard laboratory data for kidney function (eGFR and albuminuria) resulted in substantial increases in the appar-ent prevalence of chronic kidney disease as compared to administrative data alone, regardless of which administra-tive data sources were used.
Figure 2 depicts the percentage of participants with multimorbidity by age group. After hypertension (a preva-lence of 23%), 21% had chronic kidney disease, 9% had diabetes, and 9% had depression.
Discussion
From a published list of chronic conditions [3], we iden-tified a total of 30 validated algorithms including 3 algo-rithms for different types of cancer and 2 algoalgo-rithms for liver disease. We applied the algorithms to ICD codes from claims and utilization data, and identified the pres-ence or abspres-ence of these conditions in a cohort of 574,409 adults residing in Edmonton, Alberta between April 2008 and March 2009 (Figure 1). The overall prevalence of mul-timorbidity in this cohort was 26%, which is similar to the prevalence as reported in the Barnett study [3]. Our find-ings demonstrate proof of concept for using administrative data as a surveillance tool for multimorbidity in settings with systems for reliably capturing population-based claims and utilization data.
Multiple prior studies have ascertained the presence of various chronic conditions in the context of assessing multimorbidity [4,7,22-34]. Although there is no univer-sally accepted definition of multimorbidity (or a list of conditions that should be used to assess the presence of multimorbidity) there appears to be consensus on several issues. First, health conditions used to define multimor-bidity should be chronic but not necessarily permanent. Second, two or more concomitant conditions should be required to identify a person as having multimorbidity. Third, an attempt should be made to standardize defini-tions across studies to facilitate comparisons between populations [7,9,34,35]. At the same time, it is important that algorithms selected for use with administrative data should be validated against a gold standard–and demon-strate acceptable diagnostic properties so as to ensure rea-sonably accurate classification of individuals with respect to morbidity status. We focused on validated algorithms with positive predictive value and sensitivity ≥70%, com-pared to an acceptable gold standard such as chart review. Because we had access to laboratory data allowing a gold standard assessment of kidney function, we primarily assessed the presence of chronic kidney disease using esti-mated glomerular filtration rate (eGFR) and albuminuria rather than administrative data.
To our knowledge, this is the most comprehensive panel of validated algorithms yet applied to administra-tive data for the study of multimorbidity. Other studies have used reasonable but unvalidated algorithms, a more limited list of candidate chronic conditions or both. Al-though there are undoubtedly other chronic conditions that could be identified using administrative data, we fo-cused on those for which available algorithms appear to have adequate sensitivity as well as positive predictive value. We will use the set of algorithms described herein as the foundation for a series of studies describing the epidemiology of multimorbidity in Alberta, Canada.
Besides the various definitions of multimorbidity that they have used, existing studies in this area have several other limitations [36]. First, population-based studies are rare (especially in Canadian settings); most studies have captured patients followed by a particular centre and are vulnerable to referral bias. Second, most studies have been unable to assess the link between multimorbidity and clinical outcomes in subgroups defined by age, sex, or low socioeconomic status. Third, little is known about the relative frequency of individual chronic conditions within the multimorbidity syndrome – or about which clusters of conditions are most common and/or clinic-ally significant. Fourth, studies examining the economic consequences of multimorbidity have typically used rela-tively unsophisticated methods and/or studied only select populations. The scheme outlined in the current manu-script will allow our group to do future studies that close
Table 2 Morbidity characteristics of participants residing in Edmonton, Alberta during the April 2008 to March 2009 fiscal year
Prevalence, %
Characteristic Final algorithm Using hospitalizations,
claims, and ACCS
Using only hospitalizations and claims
Using only hospitalizations and ACCS
Using only hospitalizations
Number of morbidities
One 23.3 24.0 23.9 12.0 6.9
Two 11.5 12.1 11.9 4.9 3.7
Three 5.6 6.0 5.8 2.5 2.1
Four 2.8 3.1 2.9 1.4 1.1
Five or more 3.4 3.7 3.4 1.8 1.4
Morbidities
Alcohol misuse 2.4 2.8 2.4 2.4 1.8a
Asthma 2.3 6.9 6.8 2.3b 2.0b
Atrial fibrillation 2.4 2.5 2.4 1.9 1.6a
Cancer, lymphoma 0.2 0.2 0.2 0.1a 0.1a
Cancer, metastatic 0.6 0.6 0.6 0.5 0.5
Cancer, non-metastatic 2.2 2.2 2.2 1.1b 1.0b
Chronic heart failure 2.5 2.6 2.5 1.6a 1.4a
Chronic kidney disease1 20.8 3.8 (20.9) 3.6(20.8) 2.9 (20.4) 2.2 (20.1)a
Chronic pain 6.5 6.5 5.2 1.4b 0.1b
Chronic pulmonary disease 7.0 7.2 7.0 2.7b 2.3b
Chronic viral hepatitis B 0.1 0.1 0.1 0.1b <0.1b
Cirrhosis 0.2 0.2 0.1 0.1 0.1a
Dementia 1.6 1.6 1.6 1.1a 0.9a
Depression 8.7 8.9 8.7 1.7b 1.0b
Diabetes 8.8 8.9 8.8 5.6a 3.1b
Epilepsy 1.4 1.4 1.2 0.7b 0.1b
Hypertension 22.8 23.0 22.8 8.8b 7.8b
Hypothyroidism 7.6 7.6 7.6 2.3b 2.2b
Inflammatory bowel disease 1.0 1.1 1.0 0.7a 0.2b
Irritable bowel syndrome 1.9 2.0 1.9 0.6b 0.4b
Multiple sclerosis 0.7 0.8 0.7 0.4a 0.1b
Myocardial infarction 1.7 - - - 1.7
Parkinson’s disease 0.5 0.5 0.5 0.3b 0.2b
Peptic ulcer disease 0.2 0.2 0.2 0.1a 0.1b
Peripheral vascular disease 0.7 0.7 0.6 0.3b 0.2b
Psoriasis 0.9 1.0 0.9 0.2b 0.1b
Rheumatoid arthritis 1.5 1.6 1.5 0.8a 0.5b
Schizophrenia 1.5 1.5 1.5 0.7b 0.6b
Severe constipation 0.6 0.7 0.6 0.4a 0.3b
Stroke or transient ischemic attack 4.2 4.2 3.8 2.4a 0.9b
a
Indicate morbidities where removing a sources or sources resulted in prevalence reduced between 25 to 50% compared to estimates using all three sources.
b
Demonstrates morbidities where prevalence was reduced >50% compared to all three sources.
The prevalence values in the first column and the bold prevalence values in the remaining columns are estimates from the final algorithms given in Table1. The bolded prevalence values indicate which administrative datasets were used in the final algorithms.
1
Values in brackets include laboratory data (estimated glomerular filtration rate and albuminuria) as gold standard measures of kidney function
these knowledge gaps – informing policy and practice. We are optimistic that the scheme will also be used by other researchers from other jurisdictions with similar datasets–facilitating comparisons between studies. Fu-ture studies should test the relative importance of the morbidities identified in the current manuscript, as well as considering other potentially important morbidities for inclusion.
Limitations of the current approach include those com-mon to all studies using administrative data. For example, we do not have information on potential confounders re-lated to lifestyle (e.g., diet, smoking, exercise) or on mea-sured blood pressure, which may be confounders when examining the association between multimorbidity and outcomes or costs. However, this limitation would not be expected to affect feasibility of applying the algorithms or the prevalence estimates reported here. Second, identifica-tion of some of the chronic condiidentifica-tions we studied might have been enhanced by simultaneous consideration of medication data [3]. We decided against including pub-licly funded medication data to define these conditions because medication coverage in Alberta is limited to people aged≥65 years; those of lower SES; or with high annual medication costs. Thus, using medication data to define conditions would have biased towards a higher incidence of multimorbidity in older, poorer and sicker participants. We decided against restricting the cohort to people aged ≥65 years, because multimorbidity is relatively common in younger participants – and there might be important differences in the nature and implica-tions of multimorbidity by age. Therefore, we will include all adult Albertans in our forthcoming analyses. Third, since participants must use medical services to be diag-nosed with chronic conditions, our findings underestimate the true population burden of multimorbidity–especially for conditions that are less likely to lead to hospitalization but which may still significantly impact quality of life and
other important outcomes. Fourth, we did not identify ap-propriate algorithms for all of the 40 target conditions, possibly because our searches were not exhaustive, and other important conditions such as obesity were not con-sidered in this study. Therefore, our results likely under-estimate the true prevalence of multimorbidity. Finally, although we focused on validated algorithms, the diagnos-tic performance of algorithms may vary between settings, based on coding practices and the reliability of data cap-ture–and we did not systematically evaluate the quality of the original studies. Therefore (despite the lack of ana
priorireason to suspect worse performance in our
data-set), it is possible that some algorithms that were of high or moderate validity in other jurisdictions may perform less well when applied to Alberta data, especially with the modifications as described herein.
Conclusions
In summary, we identified a panel of 30 chronic condi-tions that can be identified from administrative data using validated algorithms, facilitating the study and sur-veillance of multimorbidity. We encourage other groups to use this scheme, to facilitate comparisons of data on multimorbidity between settings and jurisdictions.
Additional file
Additional file 1: Table S1.Validated algorithms for the original 40 morbidities.
Competing interests
There are no competing interests. This study is based in part by data provided by Alberta Health and Alberta Health Services. The interpretation and conclusions are those of the researchers and do not represent the views of the Government of Alberta. None of the study sponsors had a role in the study design; collection, analysis, and interpretation of data; writing the report; or in the decision to submit the report for publication. Authors’contributions
MT conceived the study. MT, NW and HQ designed and drafted the manuscript. NW performed the statistical analyses. All authors have made substantial contributions to the development of the manuscript, and have all been involved in revising it for important intellectual content and approved the final version.
Acknowledgments
The authors of this report are grateful to Ghenette Houston for administrative support, and to Sophanny Tiv for database development.
This work was supported by the Canadian Institutes for Health Research (MOP 133582), by a team grant to the Interdisciplinary Chronic Disease Collaboration from the Alberta Heritage Foundation for Medical Research (AHFMR) and a Leaders Opportunity Fund grant from the Canada Foundation for Innovation. MT, HQ, and SK are supported by career salary awards from Alberta Innovates-Health Solutions. PR is supported by a post-doctoral fellowship award from the Canadian Institutes for Health Research. Author details
1Department of Medicine, University of Calgary, Calgary, Canada. 2
Department of Medicine, University of Alberta, Edmonton, Canada.
3Department of Family Medicine, Université de Sherbrooke, Sherbrooke,
Canada.4Population Health Sciences Division, Medical Research Institute, University of Dundee, Dundee, UK.5Alberta Health Services, Edmonton,
Figure 2Number of morbidities by age in Edmonton, Alberta during the April 2008 to March 2009 fiscal year.
Canada.6Department of Community Health Sciences, University of Calgary,
Calgary, Canada.7Department of Medicine, University of Toronto, Toronto, Canada.
Received: 6 October 2014 Accepted: 2 April 2015
References
1. Beaglehole R, Bonita R, Horton R, Adams C, Alleyne G, Asaria P, et al. Priority actions for the non-communicable disease crisis. Lancet.
2011;377(9775):1438–47.
2. Fortin M, Lapointe L, Hudon C, Vanasse A. Multimorbidity is common to family practice. Is it commonly researched? Can Fam Physician. 2005;51:244–5.
3. Barnett K, Mercer SW, Norbury M, Watt G, Wyke S, Guthrie B. Epidemiology of multimorbidity and implications for health care, research, and medical education: a cross-sectional study. Lancet. 2012;380(9836):37–43. 4. Fortin M, Hudon C, Haggerty J, van den Akker M, Almirall J. Prevalence
estimates of multimorbidity: a comparative study of two sources. BMC Health Serv Res. 2010;10:111.
5. Perruccio AV, Katz JN, Losina E. Health burden in chronic disease: multimorbidity is associated with self-rated health more than medical comorbidity alone. J Clin Epidemiol. 2012;65(1):100–6.
6. Lehnert T, Heider D, Leicht H, Heinrich S, Corrieri S, Luppa M, et al. Review: health care utilization and costs of elderly persons with multiple chronic conditions. Med Care Res Rev. 2011;68:387–420.
7. Fortin M, Stewart M, Poitras ME, Almirall J, Maddocks H. A Systematic Review of Prevalence Studies on Multimorbidity: Toward a More Uniform Methodology. Ann Fam Med. 2012;10(2):142–51.
8. Parekh AK, Goodman RA, Gordon C, Koh HK, HHS Interagency Workgroup on Multiple Chronic Conditions. Managing multiple chronic conditions: a strategic framework for improving health outcomes and quality of life. Public Health Rep. 2011;126(4):460–71.
9. Salisbury C. Multimorbidity: redesigning health care for people who use it. Lancet. 2012. [Epub ahead of print].
10. Diederichs C, Berger K, Bartels DB. The measurement of multiple chronic diseases–a systematic review on existing multimorbidity indices. J Gerontol A Biol Sci Med Sci. 2011;66(3):301–11.
11. Quan H, Li B, Saunders LD, Parsons GA, Nilsson CI, Alibhai A, et al. Assessing validity of ICD-9-CM and ICD-10 administrative data in recording clinical conditions in a unique dually coded database. Health Serv Res. 2008;43(4):1424–41.
12. Altman DG, Bland JM. Diagnostic tests 2: Predictive values. BMJ. 1994;309(6947):102.
13. Hemmelgarn BR, Clement F, Manns BJ, Klarenbach S, James MT, Ravani P, et al. Overview of the Alberta Kidney Disease Network. BMC Nephrol. 2009;10:30.
14. Statistics Canada: Postal Code Conversion File [http://www.statcan.gc.ca; Accessed January 13.
15. Ronksley PE, Tonelli M, Quan H, Manns BJ, James MT, Clement FM, et al. Validating a case definition for chronic kidney disease using administrative data. Nephrol Dial Transplant. 2012;27(5):1826–31.
16. Stevens PE, Levin A. Kidney Disease: Improving Global Outcomes Chronic Kidney Disease Guideline Development Work Group Members: Evaluation and management of chronic kidney disease: synopsis of the kidney disease: improving global outcomes 2012 clinical practice guideline. Ann Intern Med. 2013;158(11):825–30.
17. Quan H, Sundararajan V, Halfon P, Fong A, Burnand B, Luthi JC, et al. Coding algorithms for defining comorbidities in ICD-9-CM and ICD-10 administrative data. Med Care. 2005;43(11):1130–9.
18. Tian TY, Zlateva I, Anderson DR. Using electronic health records data to identify patients with chronic pain in a primary care setting. J Am Med Inform Assoc. 2013.
19. Liu L, Allison JE, Herrinton LJ. Validity of computerized diagnoses, procedures, and drugs for inflammatory bowel disease in a northern California managed care organization. Pharmacoepidemiol Drug Saf. 2009;18(11):1086–93.
20. Marrie RA, Fisk JD, Stadnyk KJ, Yu BN, Tremlett H, Wolfson C, et al. The incidence and prevalence of multiple sclerosis in Nova Scotia, Canada. Can J Neurol Sci. 2013;40(6):824–31.
21. Sands BE, Duh M-S, Cali C, Ajene A, Bohn RL, Miller D, et al. Algorithms to identify colonic ischemia, complications of constipation and irritable bowel syndrome in medical claims data: development and validation. Pharmacoepidemiol Drug Saf. 2006;15(1):47–56.
22. Fortin M, Bravo G, Hudon C, Vanasse A, Lapointe L. Prevalence of multimorbidity among adults seen in family practice. Ann Fam Med. 2005;3:223–8.
23. Fortin M, Hudon C, Dubois M-F, Almirall J, Lapointe L, Soubhi H. Comparative assessment of three different indices of multimorbidity for studies on health-related quality of life. Health Qual Life Outcomes. 2005;3:74. 24. Fortin M, Soubhi H, Hudon C, Bayliss EA, Van den Akker M. Multimorbidity
in primary health care: Creating a research agenda; Preconference Workshop. Vancouver BC: NAPCRG meeting; 2007.
25. Valderas JM, Starfield B, Roland M. Multimorbidity's many challenges: A research priority in the UK. BMJ. 2007;334:1128.
26. Britt HC, Harrison CM, Miller GC, Knox SA. Prevalence and patterns of multimorbidity in Australia. Med J Aust. 2008;189:72–7.
27. Marengoni A, Winblad B, Karp A, Fratiglioni L. Prevalence of chronic diseases and multimorbidity among the elderly population in Sweden. Am J Public Health. 2008;98:1198–200.
28. Uijen AA, van de Lisdonk EH. Multimorbidity in primary care: prevalence and trend over the last 20 years. Eur J Gen Pract. 2008;1(14 Suppl):28–32. 29. Mercer SW, Smith SM, Wyke S, O'Dowd T, Watt GC. Multimorbidity in
primary care: developing the research agenda. Fam Pract. 2009;2:79–80. 30. Caughey GE, Roughead EE. Multimorbidity research challenges: where to go
from here? J Comorbidity. 2011;1:8–10.
31. Marengoni A, Angleman S, Melis R, Mangialasche F, Karp A, Garmen A, Meinow B, Fratiglioni L: Aging with multimorbidity: A systematic review of the literature. Ageing Res Rev 2011, [Epub ahead of print].
32. Starfield B, Kinder K. Multimorbidity and its measurement. Health Policy. 2011. [Epub ahead of print].
33. Agborsangaya CB, Lau D, Lahtinen M, Cooke T, Johnson JA. Multimorbidity prevalence and patterns across socioeconomic determinants: a cross-sectional survey. BMC Public Health. 2012;12:201.
34. France EF, Wyke S, Gunn JM, Mair FS, McLean G, Mercer SW. Multimorbidity in primary care: a systematic review of prospective cohort studies. Br J Gen Pract. 2012;62(597):297–307.
35. Tinetti ME, Fried TR, Boyd CM. Designing health care for the most common chronic condition-multimorbidity. JAMA. 2012;307(23):2493–4.
36. U.S. Department of Health & Human Services. Multiple Chronic Conditions - A Strategic Framework: Optimum Health and Quality of Life for Individuals with Multiple Chronic Conditions. In Washington, D.C. 2010. http://www.hhs.gov/ ash/initiatives/mcc/mcc_framework.pdf.
37. Gershon AS, Wang C, Guan J, Vasilevska-Ristovska J, Cicutto L, To T. Identifying patients with physician-diagnosed asthma in health administrative databases. Can Respir J. 2009;16(6):183–8.
38. Alonso A, Agarwal SK, Soliman EZ, Ambrose M, Chamberlain AM, Prineas RJ, et al. Incidence of atrial fibrillation in whites and African-Americans: the Atherosclerosis Risk in Communities (ARIC) study. Am Heart J. 2009;158(1):111–7.
39. Penberthy L, McClish D, Pugh A, Smith W, Manning C, Retchin S. Using hospital discharge files to enhance cancer surveillance. Am J Epidemiol. 2003;158(1):27–34.
40. Mahajan R, Moorman AC, Liu SJ, Rupp L, Klevens RM, Chronic Hepatitis Cohort Study investigators. Use of the International Classification of Diseases, 9th revision, coding in identifying chronic hepatitis B virus infection in health system data: implications for national surveillance. J Am Med Inform Assoc. 2013;20(3):441–5.
41. Goldberg D, Lewis J, Halpern S, Weiner M, Lo Re 3rd V. Validation of three coding algorithms to identify patients with end-stage liver disease in an administrative database. Pharmacoepidemiol Drug Saf. 2012;21(7):765–9. 42. Hux JE, Ivis F, Flintoft V, Bica A. Diabetes in Ontario: determination of
prevalence and incidence using a validated administrative data algorithm. Diabetes Care. 2002;25(3):512–6.
43. Jette N, Reid AY, Quan H, Hill MD, Wiebe S. How accurate is ICD coding for epilepsy? Epilepsia. 2010;51(1):62–9.
44. Quan H, Khan N, Hemmelgarn BR, Tu K, Chen G, Campbell N, et al. Validation of a case definition to define hypertension using administrative data. Hypertension. 2009;54(6):1423–8.
45. Austin PC, Daly PA, Tu JV. A multicenter study of the coding accuracy of hospital discharge administrative data for patients admitted to cardiac care units in Ontario. Am Heart J. 2002;144(2):290–6.
46. Noyes K, Liu H, Holloway R, Dick AW. Accuracy of Medicare claims data in identifying Parkinsonism cases: comparison with the Medicare current beneficiary survey. Mov Disord. 2007;22(4):509–14.
47. Fan J, Arruda-Olson AM, Leibson CL, Smith C, Liu G, Bailey KR, et al. Billing code algorithms to identify cases of peripheral artery disease from administrative data. J Am Med Inform Assoc. 2013;20(e2):e349–54. 48. Asgari MM, Wu JJ, Gelfand JM, Salman C, Curtis JR, Harrold LR, et al. Validity
of diagnostic codes and prevalence of psoriasis and psoriatic arthritis in a managed care population, 1996-2009. Pharmacoepidemiol Drug Saf. 2013;22(8):842–9.
49. Lurie N, Popkin M, Dysken M, Moscovice I, Finch M. Accuracy of diagnoses of schizophrenia in Medicaid claims. Hosp Community Psychiatry. 1992;43(1):69–71.
50. Moscovice MF, Lurie N. Minnesota: Plan Choice by the Mentally Ill in Medicaid Prepaid Health Plans. Adv Health Econ Health Serv Res. 1989;10:265–78.
51. Kokotailo RA, Hill MD. Coding of stroke and stroke risk factors using international classification of diseases, revisions 9 and 10. Stroke. 2005;36(8):1776–81.
Submit your next manuscript to BioMed Central and take full advantage of:
• Convenient online submission
• Thorough peer review
• No space constraints or color figure charges
• Immediate publication on acceptance
• Inclusion in PubMed, CAS, Scopus and Google Scholar
• Research which is freely available for redistribution
Submit your manuscript at www.biomedcentral.com/submit