R E S E A R C H A R T I C L E
Open Access
Analysis of the three-dimensional
anatomical variance of the distal
radius using 3D shape models
Sebastian F. Baumbach
1*, Jakob Binder
1, Alexander Synek
2, Fabian G. Mück
3, Yan Chevalier
4, Ekkehard Euler
1,
Georg Langs
5and Lukas Fischer
5,6Abstract
Background:Various medical fields rely on detailed anatomical knowledge of the distal radius. Current studies are limited to two-dimensional analysis and biased by varying measurement locations. The aims were to 1) generate 3D shape models of the distal radius and investigate variations in the 3D shape, 2) generate and assess
morphometrics in standardized cut planes, and 3) test the model’s classification accuracy.
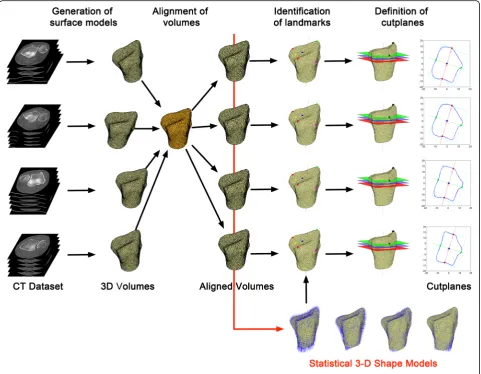
Methods:The local radiographic database was screened for CT-scans of intact radii. 1) The data sets were segmented and 3D surface models generated. Statistical 3D shape models were computed (overall, gender and side separate) and the 3D shape variation assessed by evaluating the number of modes. 2) Anatomical landmarks were assigned and used to define three standardized cross-sectional cut planes perpendicular to the main axis. Cut planes were generated for the mean shape models and each individual radius. For each cut plane, the following morphometric parameters were calculated and compared: maximum width and depth, perimeter and area. 3) The overall shape model was utilized to evaluate the predictive value (leave one out cross validation) for gender and side identification within the study population.
Results:Eighty-six radii (45 left, 44% female, 40 ± 18 years) were included. 1) Overall, side and gender specific statistical 3D models were successfully generated. The first mode explained 37% of the overall variance. Left radii had a higher shape variance (number of modes: 20 female / 23 male) compared to right radii (number of modes: 6 female / 6 male). 2) Standardized cut planes could be defined using anatomical landmarks. All morphometric parameters decreased from distal to proximal. Male radii were larger than female radii with no significant side difference. 3) The overall shape model had a combined median classification probability for side and gender of 80%.
Conclusions:Statistical 3D shape models of the distal radius can be generated using clinical CT-data sets. These models can be used to assess overall bone variance, define and analyze standardized cut-planes, and identify the gender of an unknown sample. These data highlight the potential of shape models to assess the 3D anatomy and anatomical variance of human bones.
Keywords:Image processing, Anatomical model, Distal radius, Statistical model, Computed tomography
* Correspondence:[email protected] 1Department of General, Trauma and Reconstructive Surgery, University
Hospital LMU Munich, Nussbaumstr. 20, Munich 80336, Germany Full list of author information is available at the end of the article
the distal radius is limited to morphologic (shape) and morphometric (size) studies based on radiographs [8] or single computed tomography (CT) slices [9–11]. Limiting the analysis to two-dimensional (2-D) results has two predominant limitations: first, it does not allow the display of three-dimensional (3D) shape variation of the distal radius; second, the use of single CT slices may impair inter-subject comparability due to incon-sistent slice position and orientation.
A well-established methodology in assessment of 3D anatomy and anatomical variances of bones are statis-tical shape models. These can be generated from a data-base of CT scans. Following 3D surface segmentation, a dense set of corresponding surface landmarks is gener-ated for each bone. Based on this information, 3D shape models can be calculated and the variation of each surface point within the population illustrated. These variations are referred to as modes. A further application of these 3D shape models is the generation of two-dimensional (2D) slices of each bone within the database with identical matching location and orientation. Finally, the 3D shape models can be used to classify anatomical geometries into groups, for instance to determine gender of unidentified bones.
Statistical shape models have been applied for seg-mentation of vertebra [12], femora [13, 14], or brain structures [15]. Van Giessen and colleges [16] used this methodology to analyze wrist bone motion patterns. No study has yet applied this methodology to assess the general 3D anatomy and population based variation of the distal radius, or generated inter-specimen consistent (position and orientation) cut planes. Therefore, the primary aim of this study was to generate and analyze a statistical 3D shape model of the intact distal radius. Spe-cifically, 3D shape models were generated to 1) investigate the 3D shape variation, 2) generate standardized cut planes and evaluate morphometric parameters, and 3) test the model’s classification accuracy for radius side and gender.
Methods Study design
A retrospective, CT-based image processing study was designed to investigate anatomical variance of the distal radius. It was organized in three steps: First, 3D shape models were generationed; Second, corresponding, uniform cut-planes were computed and morphometric
Munich). The search period was 2 years, the search terms used were: CT-scan AND wrist OR scaphoid; Eligibility criteria were 18 year of age, sufficiently large region of interest, identical scan and reconstruction parameters (i.e. identical scan protocol, bone kernel reconstruc-tions, 1.25 mm axial slice thickness; Discovery HD 750, GE Healthcare, Waukesha IL/USA), no signs of current/ previous fractures or morphologic changes such as osteo-arthritis, bone cysts or tumors. If both radii of one person were eligible, only the right radius was included. No sam-ple size calculation could be conducted due to missing preliminary data. Previous studies investigating the volar cortical angle of the distal radius included 74 ± 23 patients on average [9–11, 17–19]. Therefore, we aimed at a study population of 90 radii (mean + 1SD) and a gender ratio of 50% female.
3D shape model generation and analysis
R2015a (The MathWorks, Inc., Natick, Massachusetts, United States).
Standardized cross-sectional cut planes and morphometric parameters
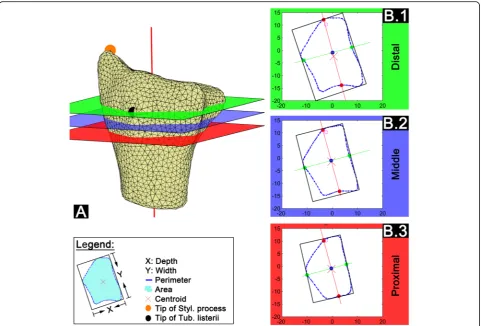
Three cross-sectional cut planes were defined for fur-ther morphometric analysis based on size-independent landmarks. These were the styloid process and the most dorsal point of the tuberculum listerii (Fig. 1 identifica-tion of landmarks and cut planes). Standardized three-dimensional sample orientation allowed the definition of cross-sectional cut planes perpendicular to the main axis. The following cross-sectional cut planes (Fig. 2) were chosen: Distal: The most dorsal point of the tuberculum listerii (Fig. 2B.1);Proximal: 50% of the dis-tance between the tip of the styloid process and the most dorsal point of the tuberculum listerii (Fig. 2B.3);
Middle: Half way between the distal and proximal sec-tional plane (Fig. 2B.2). Cross-secsec-tional cut planes were calculated for the mean shape models as well as for
each individual radius. An animated illustration of the cross-sectional cut planes is presented in Additional file 2. For each sectional plane the maximum width and depth, perimeter and area were calculated (Fig. 2 Legend).
Classification accuracy for side and gender
The overall shape model was utilized to evaluate the pre-dictive value for gender and side identification within our population. To do so leave-one-out cross validation (LOOCV) by repeatedly (100 iterations) removing one test shape and training a classifier (random forest with 50 de-cision trees) on the remaining shape model coeffi-cients was conducted. The resulting classification accuracy was calculated. All computations were per-formed in Matlab R2015a.
Statistics
Statistical differences in morphometric parameters (maximum width and depth, perimeter and area) be-tween side and gender were calculated using SPSS 22.0
(IBM, Chicago, IL, USA). The Kolmogorov-Smirnov test was used to verify that data was normally distributed. General morphology statistics comprised of descriptive analysis, an independent sample t-Test and an ANOVA (post hoc test: Bonferroni). Due to multiple testing, a Bonferroni correction was conducted (p< 0.013). The ra-tio between correctly and incorrectly classified radii was used to calculate the classification accuracy of the overall shape model.
Results Patient sample
One thousand two hundred nine radii were screened, 96 radii met the inclusion criteria. 1113 radii were excluded for the following reasons: fracture (n= 585), region of interest too small (n= 388), duplicates (n= 77), morpho-metric changes (n= 53), and age (n= 10). Ten more radii were excluded as they were used for pretests. The remaining 86 radii (45 left radii, 44% female, no pairs, mean age 40 ± 18 years (18–88 years)) were used to
compute the models. The CT-indications for those radii were suspected distal radius- (25%) or suspected carpal fractures (75%).
3D shape model analysis
All shape models were computed successfully. Figure 3 illustrates the gender and side specific models includ-ing their first mode. The first mode explained 37% of the overall variance and 41% / 34% / 25% / 50% of the variance of female / male / left / right radii respect-ively. Animated illustrations of the first five modes of all models are presented in Additional file 3A-D. Left radii had a higher shape variance (number of modes: 20 female / 23 male) compared to right radii (number of modes: 6 female / 6 male) (Additional file 4). Pre-dominant shape variation directions (1. mode) for fe-male radii were disto-proximal, while in the axial plane for the male left radii. The shape variation in male radii was curved, from lateral to medio-distal.
Standardized cross-sectional cut planes and morphometric parameters
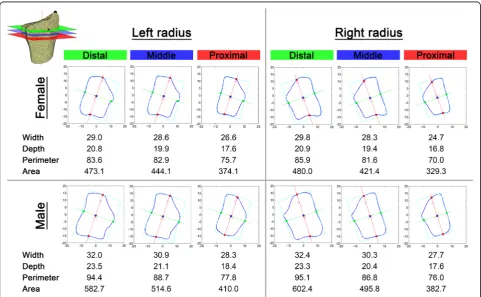
Uniform cut planes were generated for the first mode of each mean shape model and every radius separately. Mor-phometric parameters, i.e. maximum width and depth, perimeter, and area (Fig. 2 Legend) were calculated. Figure 4 illustrates side and gender specific cross-sectional cut planes and their morphometric values for the mean shape model. The cross-sectional cut planes for ±1SD of the mean shape models are presented in Additional file 5, the subsequent morphometric values in Additional file 6. Overall, male radii were larger than female radii with no
significant side difference. All morphometric parameters decreased from distal to proximal.
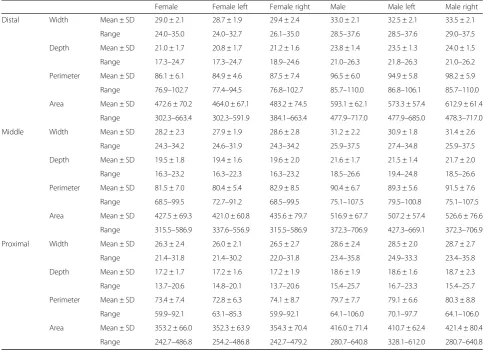
Furthermore, the three standardized cut planes were calculated for all 86 radii separately. The cross-sectional cut planes were on average 3.5 ± 0.6 mm apart from each other. Table 1 summarizes their descriptive morpho-metric parameters. All assessed plane parameters were significantly greater in male than in female patients (p≤0.001). No significant side differences could be found. Comparing the morphometric parameters be-tween the cross-sectional cut planes (ANOVA) gender separately revealed overall significant differences. The
Fig. 3First mode of the four statistical shape models
post-hoc analysis (Bonferroni) showed significant sec-tional plane differences for all parameters except female width, perimeter and area between the distal and mid-dle sectional plane.
Finally, the morphometric parameters generated from the cut planes of the mean shape models were well within one standard deviation range of those of the indi-vidual radii values. The overall mean differences were distal: -0.8 ± 1.7 mm; middle: -1.0 ± 3.4 mm; proximal: -2.1 ± 4.4 mm.
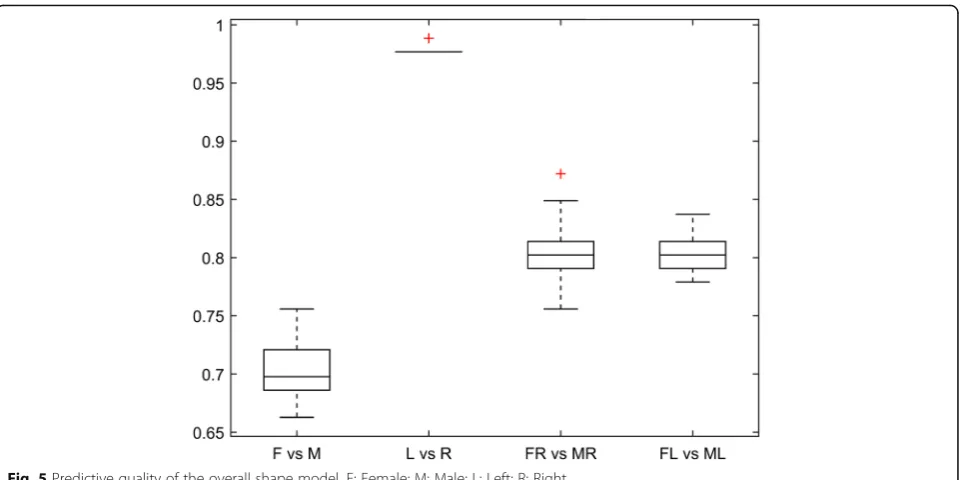
Classification accuracy of the overall shape model
The overall shape model allowed accurate discrimination between left and right radii with a median classification probability of 98%. Testing for gender differences, 70% of the tested radii were classified correctly. Conducting the same analysis step-wise predictive, i.e. by firstly iden-tifing the side, then the gender, yielded a median classifi-cation probability of 80% independent of the radii side.
The predictive quality of the overall shape model is illus-trated in Fig. 5.
Discussion
A large dataset of clinical CT images was used to gener-ate the first 3D mean shape model of the distal radius, define and analyze uniformly oriented cross-sectional cut planes, and finally provide good classification accur-acy regarding side and gender.
Previous studies have predominantly been limited to the 2D anatomy of the distal radius. These assessed gross measurements (distal sagittal and axial width) [8–10, 25] or the cross-sectional anatomy of the distal radius [11, 26, 27]. Some studies indicated to assess the 3D anatomy of the distal radius. Hamilton et al. [27] analyzed various morphometric parameters at different locations of the distal radius. Oppermann et al. [11] analyzed longitudinal and transverse slices of 49 cadaver distal radii. Recent studies have attempted to analyze specific landmarks, such as the dorsal tubercle (Lister’s tubercle) [1, 28, 29], the
Perimeter Mean ± SD 86.1 ± 6.1 84.9 ± 4.6 87.5 ± 7.4 96.5 ± 6.0 94.9 ± 5.8 98.2 ± 5.9
Range 76.9–102.7 77.4–94.5 76.8–102.7 85.7–110.0 86.8–106.1 85.7–110.0
Area Mean ± SD 472.6 ± 70.2 464.0 ± 67.1 483.2 ± 74.5 593.1 ± 62.1 573.3 ± 57.4 612.9 ± 61.4
Range 302.3–663.4 302.3–591.9 384.1–663.4 477.9–717.0 477.9–685.0 478.3–717.0
Middle Width Mean ± SD 28.2 ± 2.3 27.9 ± 1.9 28.6 ± 2.8 31.2 ± 2.2 30.9 ± 1.8 31.4 ± 2.6
Range 24.3–34.2 24.6–31.9 24.3–34.2 25.9–37.5 27.4–34.8 25.9–37.5
Depth Mean ± SD 19.5 ± 1.8 19.4 ± 1.6 19.6 ± 2.0 21.6 ± 1.7 21.5 ± 1.4 21.7 ± 2.0
Range 16.3–23.2 16.3–22.3 16.3–23.2 18.5–26.6 19.4–24.8 18.5–26.6
Perimeter Mean ± SD 81.5 ± 7.0 80.4 ± 5.4 82.9 ± 8.5 90.4 ± 6.7 89.3 ± 5.6 91.5 ± 7.6
Range 68.5–99.5 72.7–91.2 68.5–99.5 75.1–107.5 79.5–100.8 75.1–107.5
Area Mean ± SD 427.5 ± 69.3 421.0 ± 60.8 435.6 ± 79.7 516.9 ± 67.7 507.2 ± 57.4 526.6 ± 76.6
Range 315.5–586.9 337.6–556.9 315.5–586.9 372.3–706.9 427.3–669.1 372.3–706.9
Proximal Width Mean ± SD 26.3 ± 2.4 26.0 ± 2.1 26.5 ± 2.7 28.6 ± 2.4 28.5 ± 2.0 28.7 ± 2.7
Range 21.4–31.8 21.4–30.2 22.0–31.8 23.4–35.8 24.9–33.3 23.4–35.8
Depth Mean ± SD 17.2 ± 1.7 17.2 ± 1.6 17.2 ± 1.9 18.6 ± 1.9 18.6 ± 1.6 18.7 ± 2.3
Range 13.7–20.6 14.8–20.1 13.7–20.6 15.4–25.7 16.7–23.3 15.4–25.7
Perimeter Mean ± SD 73.4 ± 7.4 72.8 ± 6.3 74.1 ± 8.7 79.7 ± 7.7 79.1 ± 6.6 80.3 ± 8.8
Range 59.9–92.1 63.1–85.3 59.9–92.1 64.1–106.0 70.1–97.7 64.1–106.0
Area Mean ± SD 353.2 ± 66.0 352.3 ± 63.9 354.3 ± 70.4 416.0 ± 71.4 410.7 ± 62.4 421.4 ± 80.4
Range 242.7–486.8 254.2–486.8 242.7–479.2 280.7–640.8 328.1–612.0 280.7–640.8
volar surface [11, 18, 19], the promatory of the radius [5] or the radiocarpal surface [30]. However, these studies based their analysis on single slices.
This study is the first to approach the three-dimensional anatomy of the distal radius and examine its variability within a population. The morphometric parameters calcu-lated from the mean shape model, correcalcu-lated well with those from the individual cut planes. Moreover, these morphometric values mirror data from previous studies in similar populations [2, 8]. However, published morpho-metric distal radius values have shown a broad range, even within a population. This may either be due to a natural wide variability, or variations in measurement location be-tween these studies.
This study highlights the significant influence of the measurement location on morphometric parameters. Al-though the generated cut-planes were only 3.5 ± 0.6 mm apart from each other on average, almost all morphometric parameters varied significantly. Therefore, two-dimensional analysis of cut-planes requires careful attention to the measurement location. Consistent measurement location may facilitate inter-study comparison. In future, however 3D anatomical models eliminate this confounder.
The retrospective dataset, generated from patients pre-senting with wrist/hand pain, is a limitation of this study. One may assume, that this patient cohort differs from a prospectively assessed, asymptomatic patient sample. However, patients who present at our level 1 trauma cen-ter are of an assumed random population. All CT-datasets were carefully reviewed by a fellow-trained orthopedic surgeon and radiologist to assure an intact bony architec-ture. Although trauma may have had an impact on the
intra-osseos architecture, i.e. trabecular microfractures, we belive this most likely did not alter the cortical architec-ture of the distal radius. Therefore, as the cortical surface was used to generate the 3D-surface models, the initial trauma should not compromise the results.
One further point that warrants discussion is sexual dimorphism and the identification of handedness. A fo-rensic study by Ruiz Mediavilla et al. [7] avoided the bias of measurement location by assessing the volume of 127 distal radii (twentieth century) to analyze the potential of volume measurements in order to determine the gen-der of fragmentary remains. For the distal radius, they reported significant greater values for male and right radii compared to female and left radii respectively. The current study, as well as previous studies, also found sig-nificant gender differences, but no such differences for side [11]. Moreover, Ruiz Mediavilla et al. [7] reported a gender classification function accuracy of their volumet-ric measurements of 95.5% for right and 88.5% for left radii. These values are higher than reported herein. This may either be due to our limited sample size or a greater gender difference in the volume rather than the shape.
Interestingly, a greater shape variance (number of modes) was determined in left compared to right radii. As no further quantitative analyses could be conducted on the total 3D shape models, we computed their cross-sectional cut planes (mean, ±1SD). The greater shape variance of left radii may be explained by the functional adaptation of bone to stress [31]. Previous studies showed a difference in metacarpal bone size de-pending on hand dominance [32]. With most of the population being right-handed, this could explain the
odology can quickly and efficiently process large data and generate 3D shape models based on clinical CT datasets. Therefore it may easily be adapted to various anatomical locations. Finally, although the overall shape variance could not be further analyzed quantitatively, this may be possible for specific anatomical landmarks. Future studies should, for example, assess the surface area and the 3D curve of the distal volar surface. This is of particular inter-est to the design of pre-shaped plates used in osteosynth-esis in distal radius factures [3, 38].
Conclusions
A novel 3D shape model of the distal radius was con-structed allowing descriptive analysis of shape variance. Based on the shape model, uniform cut-planes were de-fined and analyzed. Assessment of the the model’s side and gender classification accuracy was 80%. Future studies may apply these models to other anatomical locations and assess specific anatomical landmarks.
Additional files
Additional file 1:Detailed description of the process of shape model generation. (DOCX 92 kb)
Additional file 2:Animated illustration of the cross-sectional cut planes. Green plane: Proximal plane (50% of the distance between the tip of the styloid process and the most dorsal point of the tuberculum listerii); Blue plane: Middle plane (Half way between the distal and proximal sectional plane); Red plane: Distal plane (The most dorsal point of the tuberculum listerii). (PDF 140 kb)
Additional file 3:Animated illustrations of the first five modes of all radius models. A: Female left radii model; B: Female right radii model; C: Male left radii model; D: Male right radii model. (ZIP 9547 kb)
Additional file 4:Illustration of the shape variance (number of modes) for each radius model. (TIF 57327 kb)
Additional file 5:Illustration of the cross-sectional cut planes for ±1SD of the mean shape models. SD: Standard deviation; Distal: Distal plane; Middle: Middle plane; Proximal: Proximal plane. (TIF 9568 kb)
Additional file 6:Summary of morphometric parameters (Mean, ±1SD) of the mean shape model for all three sectional planes. SD: Standard deviation; Distal: Distal plane; Middle: Middle plane; Proximal: Proximal plane. (DOCX 113 kb)
Abbreviations
2D:Two-dimensional; 3D: Three-dimensional; CPD: Coherent point drift; CT: Computed tomography; DICOM: Digital imaging and communications in medicine; e: eigenvectors; Fig: Figure; l: Mean shape; LOOCV: Leave one out cross validation; n: number; PCA: Principle component analysis; SD: Standard deviation; Supp: Supplement;λ: Eigenvalues
Acknowledgements
The authors would like to Bela Turk for proof-reading.
SFB had the study idea, wrote the proposal for the ethics committee, conducted the statistics and wrote the paper. JB was responsible for data generation, rendering of the radii and participated in writing the paper. FGM conducted CT scans, helped prepare and analyze the data and proof-read the paper. AS was involved in study planning and conducted parts of the data analysis. YC conducted rendering of the radii and participated in manuscript preparation. EE was one of the study initiators, helped with the ethics proposal, data interpretation and proof-read the paper. GL supervised data generation and analysis and proof-read the paper. LF conducted the data analysis, model generation and prepared parts of the paper. All authors read and approved the final manuscript.
Authors’information Not applicable.
Competing interests
The authors declare that they have no competing interests.
Consent for publication Not applicable.
Ethics approval and consent to participate
The local ethics committee (University Hospital of Munich, LMU) approved the study (Ref. Nr. 126-13).
Author details
1
Department of General, Trauma and Reconstructive Surgery, University Hospital LMU Munich, Nussbaumstr. 20, Munich 80336, Germany.2Institute of Lightweight Design and Structural Biomechanics, Vienna University of Technology, Getreidemarkt 9, Vienna 1060, Austria.3Department of Clinical Radiology, University Hospital LMU Munich, Nussbaumstr. 20, Munich 80336, Germany.4Department of Orthopaedic Surgery, Physical Medicine and Rehabilitation, University Hospital LMU Munich, Campus Grosshadern, Marchioninistraße 15, Munich 81377, Germany.5Computational Imaging Research Laboratory, Department of Biomedical Imaging and Image-guided Therapy, Medical University of Vienna, Waehringer Guertel 18-20, Vienna 1090, Austria.6Software Competence Center Hagenberg GmbH, Softwarepark 21, Hagenberg 4232, Austria.
Received: 6 October 2016 Accepted: 27 February 2017
References
1. Ağır I, Aytekin MN, Küçükdurmaz F, Gökhan S, CavuşUY. Anatomical Localization of Lister's Tubercle and its Clinical and Surgical Importance. Open Orthop J. 2014;8:74–7. doi:10.2174/1874325001408010074. 2. Barrier ILO, L'Abbé EN. Sex determination from the radius and ulna in a
modern South African sample. Forensic Sci Int. 2008;179(1):85.e1–7. doi:10. 1016/j.forsciint.2008.04.012.
3. Oppermann J, Bredow J, Beyer F, Neiss WF, Spies CK, Eysel P et al. Distal radius: anatomical morphometric gender characteristics. Do anatomical pre-shaped plates pay attention on it? Arch Orthop Trauma Surg. 2014. doi:10. 1007/s00402-014-2112-7.
4. Vroemen JC, Dobbe JGG, Sierevelt IN, Strackee SD, Streekstra GJ. Accuracy of distal radius positioning using an anatomical plate. Orthopedics. 2013; 36(4):e457–62. doi:10.3928/01477447-20130327-22.
5. Windisch G, Clement H, Tanzer K, Feigl G, Grechenig W, Anderhuber F, et al. Promontory of radius: a new anatomical description on the distal radius. Surg Radiol Anat. 2007;29(8):629–33. doi:10.1007/s00276-007-0264-7. 6. Akhlaghi M, Sheikhazadi A, Ebrahimnia A, Hedayati M, Nazparvar B, Saberi
Iranian population. J Forensic Legal Med. 2012;19(4):219–22. doi:10.1016/j. jflm.2011.12.030.
7. Ruiz Mediavilla E, Perea Pérez B, Labajo González E, Sánchez Sánchez JA, Santiago Sáez A, Dorado FE. Determining sex by bone volume from 3D images: discriminating analysis of the tali and radii in a contemporary Spanish reference collection. Int J Legal Med. 2012;126(4):623–31. doi:10. 1007/s00414-012-0715-5.
8. Baumbach SF, Krusche-Mandl I, Huf W, Mall G, Fialka C. Linear intra-bone geometry dependencies of the radius: Radius length determination by maximum distal width. Eur J Radiol. 2012;81(5):947–50. doi:10.1016/j.ejrad. 2011.02.030.
9. Gasse N, Lepage D, Pem R, Bernard C, Lerais JM, Garbuio P, et al. Anatomical and radiological study applied to distal radius surgery. Surg Radiol Anat. 2011;33(6):485–90. doi:10.1007/s00276-010-0754-x. 10. Pichler W, Clement H, Hausleitner L, Tanzer K, Tesch NP, Grechenig W.
Various circular arc radii of the distal volar radius and the implications on volar plate osteosynthesis. Orthopedics. 2008;31(12). https://www.ncbi.nlm. nih.gov/pubmed/?term=Pichler+W%2C+Clement+H%2C+Hausleitner+L%2C +Tanzer+K%2C+Tesch+NP%2C+Grechenig+W.+Various+circular+arc+radii +of+the+distal+volar+radius+and+the+implications+on+volar+plate +osteosynthesis.
11. Oppermann J, Wacker M, Stein G, Springorum H-P, Neiss WF, Burkhart KJ, et al. Anatomical fit of seven different palmar distal radius plates. Arch Orthop Trauma Surg. 2014;134(10):1483–9. doi:10.1007/s00402-014-2072-y. 12. Pekar V, Kaus MR, Lorenz C, Lobregt S, Truyen R, Weese J. Shape-modelbased
adaptation of 3D deformable meshes for segmentation of medical images. In: Sonka M, Hanson KM, Editors. Proc SPIE Medical Imaging: Image Processing. vol 4322, San Diego; 2001. http://proceedings.spiedigitallibrary.org/solr/ searchresults.aspx#q=%2C%20Weese%20J.%20Shape-modelbased% 20adaptation%20of%203D%20deformable%20meshes%20for%20seg mentation%20of%20medical%20images&SearchSourceType=1.
13. Josephson K, Ericsson A, Karlsson J. Segmentation of medical images using three-dimensional active shape models. In: Proc Scandinavian Conference on Image Analysis LNCS, vol 3540 Springer. 2005.
14. Tang TSY, Ellis RE. 2D/3D deformable registration using a hybrid atlas. In: Proc MICCAI LNCS, vol 3750 Springer. 2005.
15. Zhao Z, Aylward SR, Teoh EK. A novel 3D partitioned active shape model for segmentation of brain MR images. In: Proc MICCAI LNCS, vol 3749 Springer.
16. van de Giessen M, Foumani M, Vos FM, Strackee SD, Maas M, Van Vliet LJ, et al. A 4D statistical model of wrist bone motion patterns. IEEE Trans Med Imaging. 2012;31(3):613–25. doi:10.1109/TMI.2011.2174159.
17. Bassi RS, Krishnan KM, Dhillon SS, Deshmukh SC. Palmar cortical angle of the distal radius: a radiological study. J Hand Surg Eur Vol. 2003;28(2):163–4. 18. Evans S, Ramasamy A, Deshmukh SC. Distal volar radial plates: how
anatomical are they? Orthop Traumatol Surg Res. 2014;100(3):293–5. doi:10. 1016/j.otsr.2013.11.014.
19. Oura K, Oka K, Kawanishi Y, Sugamoto K, Yoshikawa H, Murase T. Volar morphology of the distal radius in axial planes: A quantitative analysis. J Orthop Res. 2014. doi:10.1002/jor.22780.
20. Slicer 3D. http://www.slicer.org/. Accessed 5 June 2016.
21. Chevalier Y. Numerical Methodology to Evaluate the Effects of Bone Density and Cement Augmentation on Fixation Stiffness of Bone-Anchoring Devices. J Biomech Eng. 2015;137(9). doi:10.1115/1.4030943. 22. CGAL Project. http://www.cgal.org/. Accessed 5 June 2016.
23. Cootes TF, Taylor CJ, Cooper DH, Graham J. Training Models of Shape from Sets of Examples. In: Proceedings of the British Machine Vision Conference. 1992. p. 9–18. doi:10.1007/978-1-4471-3201-1_2.
24. Thodberg HH. Minimum Description Length shape and appearance models. Inf Process Med Imaging. 2003;18:51–62.
25. Celbis O, Agritmis H. Estimation of stature and determination of sex from radial and ulnar bone lengths in a Turkish corpse sample. Surg Radiol Anat. 2006;158(2-3):135–9. doi:10.1016/j.forsciint.2005.05.016.
26. Bouxsein ML, Myburgh KH, van der Meulen MC, Lindenberger E, Marcus R. Age-related differences in cross-sectional geometry of the forearm bones in healthy women. Calcif Tissue Int. 1994;54(2):113–8.
27. Hamilton CJ, Thomas SG, Jamal SA. Associations between leisure physical activity participation and cortical bone mass and geometry at the radius and tibia in a Canadian cohort of postmenopausal women. Bone. 2010; 46(3):774–9. doi:10.1016/j.bone.2009.10.041.
28. Clement H, Pichler W, Nelson D, Hausleitner L, Tesch NP, Grechenig W. Morphometric analysis of lister's tubercle and its consequences on volar plate fixation of distal radius fractures. J Hand Surg Am. 2008;33(10):1716–9. doi:10.1016/j.jhsa.2008.08.012.
29. Pichler W, Windisch G, Schaffler G, Rienmüller R, Grechenig W. Computer tomography aided 3D analysis of the distal dorsal radius surface and the effects on volar plate osteosynthesis. J Hand Surg Eur Vol. 2009;34(5):598–602. doi:10.1177/1753193409101471.
30. Andermahr J, Lozano-Calderon S, Trafton T, Crisco JJ, Ring D. The volar extension of the lunate facet of the distal radius: a quantitative anatomic study. J Hand Surg Am. 2006;31(6):892–5. doi:10.1016/j.jhsa.2006.03.010. 31. Goodship AE, Lanyon LE, McFie H. Functional adaptation of bone to increased
stress. An experimental study. J Bone Joint Surg Am. 1979;61(4):539–46. 32. Plato CC, Wood JL, Norris AH. Bilateral asymmetry in bone measurements of
the hand and lateral hand dominance. Am J Phys Anthropol. 1980;52(1):27– 31. doi:10.1002/ajpa.1330520105.
33. Varzi D, Coupaud SAF, Purcell M, Allan DB, Gregory JS, Barr RJ. Bone morphology of the femur and tibia captured by statistical shape modelling predicts rapid bone loss in acute spinal cord injury patients. Bone. 2015;81: 495–501. doi:10.1016/j.bone.2015.08.026.
34. Schneider MTY, Zhang J, Crisco JJ, Weiss APC, Ladd AL, Nielsen P, et al. Men and women have similarly shaped carpometacarpal joint bones. J Biomech. 2015;48(12):3420–6. doi:10.1016/j.jbiomech.2015.05.031.
35. Lindner C, Thiagarajah S, Wilkinson JM, Panoutsopoulou K, Day-Williams AG, Consortium A, et al. Investigation of association between hip osteoarthritis susceptibility loci and radiographic proximal femur shape. Arthritis Rheumatol (Hoboken, NJ). 2015;67(8):2076–84. doi:10.1002/art.39186. 36. Ramezani M, Johnsrude I, Rasoulian A, Bosma R, Tong R, Hollenstein T, et al.
Temporal-lobe morphology differs between healthy adolescents and those with early-onset of depression. Neuroimage Clin. 2014;6:145–55. doi:10. 1016/j.nicl.2014.08.007.
37. Lacko D, Huysmans T, Parizel PM, De Bruyne G, Verwulgen S, Van Hulle MM, et al. Evaluation of an anthropometric shape model of the human scalp. Appl Ergon. 2015;48:70–85. doi:10.1016/j.apergo.2014.11.008.
38. Schneppendahl J, Windolf J, Kaufmann RA. Distal radius fractures: current concepts. J Hand Surg Am. 2012;37(8):1718–25. doi:10.1016/j.jhsa.2012.06.001.
• We accept pre-submission inquiries
• Our selector tool helps you to find the most relevant journal
• We provide round the clock customer support
• Convenient online submission
• Thorough peer review
• Inclusion in PubMed and all major indexing services
• Maximum visibility for your research
Submit your manuscript at www.biomedcentral.com/submit