R E S E A R C H
Open Access
A transcriptome profile in hepatocellular
carcinomas based on integrated analysis of
microarray studies
Feifei Wang
1†, Ruliang Wang
1†, Qiuwen Li
1†, Xueling Qu
1, Yixin Hao
1, Jingwen Yang
1, Huixia Zhao
1, Qian Wang
1,
Guanghui Li
1, Fengyun Zhang
1, He Zhang
1, Xuan Zhou
1, Xioumei Peng
1, Yang Bian
2and Wenhua Xiao
1*Abstract
Background:Despite new treatment options for hepatocellular carcinomas (HCC) recently, 5-year survival remains poor, ranging from 50 to 70%, which may attribute to the lack of early diagnostic biomarkers. Thus, developing new biomarkers for early diagnosis of HCC, is extremely urgent, aiming to decrease HCC-related deaths.
Methods:In the study, we conducted a comprehensive characterization of gene expression data of HCC based on a bioinformatics method. The results were confirmed by real time polymerase chain reaction (RT-PCR) and TCGA database to prove the credibility of this integrated analysis.
Results:After integrating analysis of seven HCC gene expression datasets, 1167 differential expressed genes (DEGs) were identified. These genes mainly participated in the process of cell cycle, oocyte meiosis, and oocyte maturation mediated by progesterone. The results of experiments and TCGA database validation in 10 genes was in full accordance with findings in integrated analysis, indicating the high credibility of our integrated analysis of different gene expression datasets.ASPM,CCT3, andNEK2was showed to be significantly associated with overall survival of HCC patients in TCGA database.
Conclusion:This method of integrated analysis may be a useful tool to minish the heterogeneity of individual microarray, hopefully outputs more accurate HCC transcriptome profiles based on large sample size, and explores some potential biomarkers and therapy targets for HCC.
Keywords:Hepatocellular cancer, Differentially expressed gene, Integrated analysis, Expression profile, Real time polymerase chain reaction, TCGA validation
Background
Hepatocellular carcinoma (HCC) is one of the most fre-quently occurring malignant tumors worldwide [1]. Risk factors of HCC are well recognized including gender, infection by hepatitis B virus or hepatitis C virus, cirrhosis, metabolism diseases, toxins, excess alcohol consumption, and smoking. HCC varies with wide geography, and is more prevalent in Asia, Africa, and southern Europe. It has been well defined that experiencing surgery for early HCC patients could achieve a higher curative resection
rate (80.5%) [2], and finally have a better survival rate. However, patients with early HCC frequently manifest non-typical symptoms, hence, most of patients are diag-nosed with advanced HCC when seeing a doctor, resulting in a low 5-year survival rate, ranging from 50 and 70% [3]. Therefore, developing biomarkers for early diagnosis is be-ing emphasized to prolong survival in patients with HCC.
Over the last decades, large efforts have been made to promote the early diagnosis of HCC. Alpha-fetoprotein (AFP) has been the most commonly used tumor biomarker in the liver, testicles, and ovaries [4]. Highly sensitive and specific biomarkers need to be developed in HCC diagno-sis. Glypican-3 (GPC3), a membrane-associated heparan sulfate proteoglycan, is up-regulated in HCC. Additionally, GPC3 involved in hippo pathway to exert its function in * Correspondence:[email protected]
†Equal contributors
1Department of Oncology, The First Affiliated Hospital of PLA General
Hospital, Fucheng Road 51, Beijing 100048, China
Full list of author information is available at the end of the article
HCC cell proliferation. GPC may be applied in clinical practice as a novel diagnostic biomarker [5].
Additionally, some researchers have attempted to employ prognostic markers for predicting HCC recur-rence. Villa E et al. detected whole genome microarray ex-pression profiling of 161 HCC samples, and revealed that five-gene signature (ANGPT2, NETO2, NR4A1, DLL4,
ESM1) was able to predict fast growth and worst survival of HCC patients [6]. The exploration of prognostic markers may facilitate individualized therapies.
Recently, detection of genome-wide gene transcripts expressed in a given tissue type is becoming more and more feasible with advent of high-throughput technolo-gies, such as microarray and RNA-seq. The application of microarray-based gene expression profiling has produced tremendous information, and provided mechanistic insights into the oncogenic process of HCC [7]. However, although many microarray studies of HCC have been performed [8–11], each of study holds a somewhat differ-ent view due to the heterogeneity caused by the variety in clinical samples, platform, analytical approach, etc. Toward this end, an integrated analysis of seven HCC gene expres-sion datasets was conducted to identify differential expressed genes (DEGs) between tumor and normal tissues, revealing a common biological thread that linked the disparate microarray studies. Ten genes were selected for further real time polymerase chain reaction (RT-PCR) and TCGA database validation, to prove the credibility of this integrated analysis. We expected our study would be of some value for the future diagnosis and therapy of HCC in clinic.
Methods
Eligible HCC gene expression datasets
The raw gene expression datasets of HCC and control samples were selected and downloaded in the Gene Expression Omnibus (GEO) database. The datasets meet-ing the followmeet-ing criteria were included: i) the expression profile of whole genome; ii) data from the tumor and tumor-adjacent normal liver tissues from HCC patients in clinic; iii) raw data or standardized data. Cirrhotic liver tissue sets, non-human sets, and integrated analysis of gene expression profiles were excluded.
Identification of HCC gene expression profile
We selected the Z-score transformation [12] method to normalize raw data from different platforms. The MATrix-LABoratory (MATLAB) software was applied to calculate differently expressed probe sets between tumor and tumor-adjacent normal tissue, using gene specific t-test. The genes with FDR≤0.05 were selected as the signifi-cantly differentially expressed genes (DEGs). Heat map analysis was conducted using the“heatmap.2” function of the R/Bioconductor package“gplots”[13].
Gene ontology (GO) of differentially expressed genes The GO and pathway enrichment was analyzed via the on-line software GENECODIS to facilitate the interpretation of biological roles of DEGs (http://genecodis.cnb.csic.es) [14]. The GO functions of the DEGs were determined according to different categories including biological process, molecular functions, and cellular components. In addition, pathway enrichment analysis was based on the Kyoto Encyclopedia of Genes and Genomes (KEGG) database.
Protein-protein interaction (PPI) network construction In order to find candidate genes involved in the onco-genesis and hepatic dysfunction of HCC, PPI networks of significantly DEGs were constructed according to the data from Biological General Repository for Interaction Datasets (BioGRID) (http://thebiogrid.org/). Among the candidate genes, the PPI networks of the top 20 most significantly dysregulated genes were visualized via Cytoscape [15].
RNA Isolation and RT-PCR validation
Tumor and matched adjacent normal liver tissues which were obtained from five HCC patients in the current study, were frozen immediately after surgery, and were stored at −135 °C for RNA extraction. Frozen sections were made and evaluated independently by senior pa-thologists. The study was approved by the First Affiliated Hospital of PLA General Hospital ethnics committee. The ethics committee approved the relating screening, inspection, and data collection of the patients, and all subjects signed a written informed consent form. All works were undertaken following the provisions of the Declaration of Helsinki.
The whole RNA of liver tissue for each sample was ex-tracted using RNAeasy Mini Kit (Qiagen, Valencia, CA) according to the manufacture’s protocol. Ten genes were randomly selected from the 20 most significantly DEGs. Primers for the ten genes were designed using PrimerPlex 2.61 (PREMIER Biosoft, Palo Alto, CA) (Additional file 1: Table S1). Expression levels of genes were screened by SYBR (Applied Biosystems/Life Technologies, Carlsbad, CA) in ABI 7500 Real Time PCR System (Applied Biosys-tems, Carlsbad CA). Relative gene expression was calcu-lated with Data Assist Software version 3.0 (Applied Biosystems/Life Technologies) and human actin gene was used as a reference. The expression level of each gene was determined according to the method of 2-△△ct.
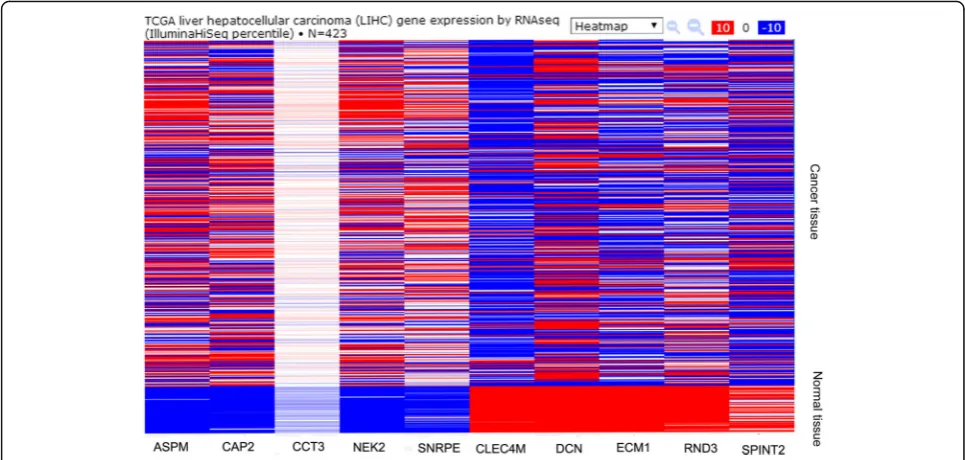
TCGA database validation of selected genes in HCC patients
mRNA expression patterns in HCC patients (N= 423) [16]. The selected genes were also evaluated for the overall survival time of HCC patients in correlation with their expression pattern (http://cbioportal.org) in the TCGA database (N= 442) [17].
Results
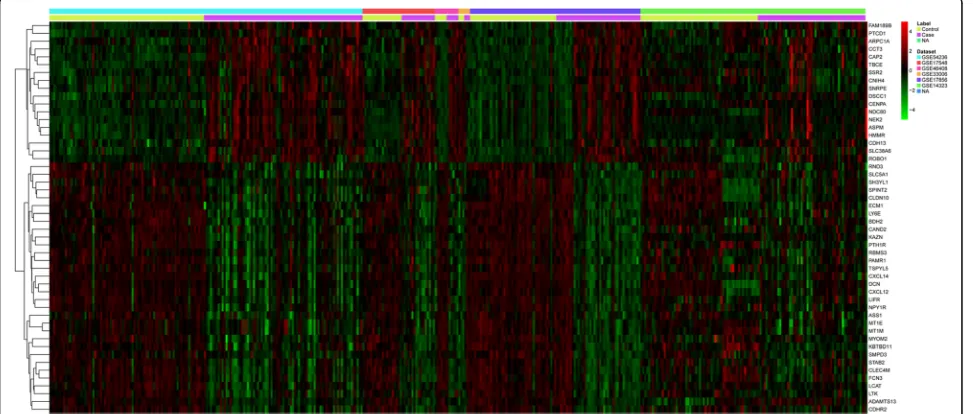
Candidate genes involved in the occurrence of HCC Seven microarray datasets of HCC were identified accord-ing to the includaccord-ing criteria. Among of them, GSE17548, GSE33006, GSE17856, and GSE1481 didn’t contain the gene expression data of tumor-adjacent normal liver tissues. 267 HCC samples and 67 control samples were enrolled in the integrated analysis. The information of each microarray dataset was shown in Table 1. Based on micro-array datasets available for integrated analysis, a total of 1167 DEGs were identified, among which, 628 genes were up-regulated and 539 genes were down-regulated. The de-tailed information of the 20 most significantly up-regulated
or down-regulated genes were shown in Additional file 1: Table S2. The top 50 most significantly DEGs were dis-played in a heat map across different HCC microarray datasets (Fig. 1).
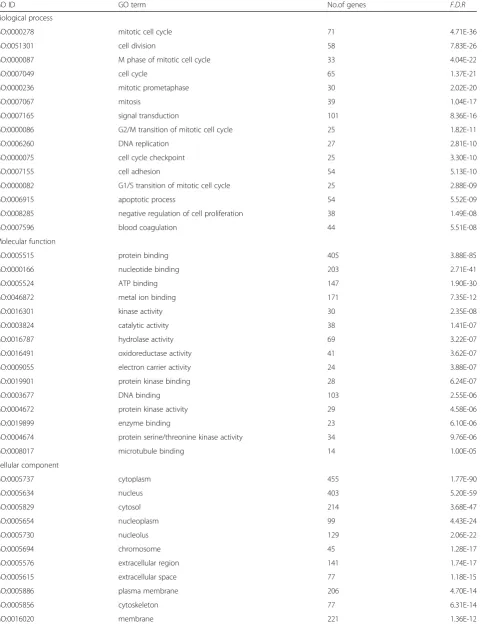
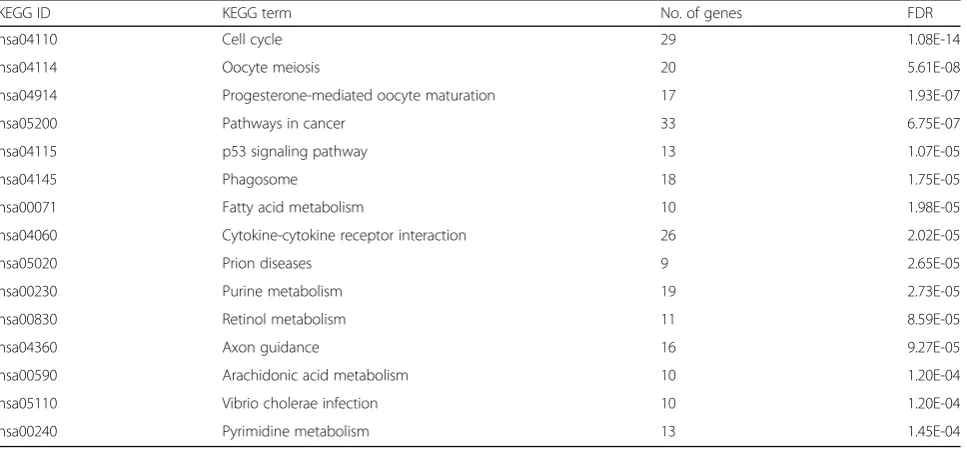
GO and KEGG analysis of the candidate genes
Mitotic cell cycle (GO: 0000278, 4.71E-36) and cell div-ision (GO: 0051301, 7.83E-26) was significantly enriched upon the category of GO biological progress, and protein binding (GO: 0005515, 3.88E-85) and nucleotide binding (GO: 0000166, 2.71E-41) was significantly enriched upon the category of GO molecular function. While for the category of GO cellular component, cytoplasm (GO: 0005737, 1.77E-90) and nucleus (GO: 0005634, 5.20E-59) was significantly enriched (Table 2). Based on KEGG data-base, the 1167 DEGs were involved in 99 signal pathways, including cell cycle, oocyte meiosis, oocyte maturation mediated by progesterone, pathways in cancer, p53 signal-ing pathways, production of phagosome, metabolism of
Table 1Information of the expression profiles
GEO ID Platform Samples
(cancer:normal)
Sample source
Country Time
GSE54236 GPL6480 Agilent-014850 Whole Human Genome Microarray 4x44K G4112F (Probe Name version)
64:19 In vivo Italy 2014
GSE17548 GPL570 [HG-U133_Plus_2] Affymetrix Human Genome U133 Plus 2.0 Array 17:0 In vivo Turkey 2013
GSE46408 GPL4133 Agilent-014850 Whole Human Genome Microarray 4x44K G4112F (Feature Num-ber version)
6:6 In vivo Taiwan 2013
GSE33006 GPL570 [HG-U133_Plus_2] Affymetrix Human Genome U133 Plus 2.0 Array 3:0 In vivo Taiwan 2011
GSE17856 GPL6480 Agilent-014850 Whole Human Genome Microarray 4x44K G4112F (Probe Name version)
43:0 In vivo USA 2010
GSE14811 GPL8177 KRIBB_Human_14K 56:0 In vivo Korea 2009
GSE14323 GPL96 [HG-U133A] Affymetrix Human Genome U133A Array/GPL571 [HG-U133A_2] Affymetrix Human Genome U133A 2.0 Array
81:43 In vivo USA 2009
Table 2Partial results of gene ontology (GO) analysis
GO ID GO term No.of genes F.D.R
Biological process
GO:0000278 mitotic cell cycle 71 4.71E-36
GO:0051301 cell division 58 7.83E-26
GO:0000087 M phase of mitotic cell cycle 33 4.04E-22
GO:0007049 cell cycle 65 1.37E-21
GO:0000236 mitotic prometaphase 30 2.02E-20
GO:0007067 mitosis 39 1.04E-17
GO:0007165 signal transduction 101 8.36E-16
GO:0000086 G2/M transition of mitotic cell cycle 25 1.82E-11
GO:0006260 DNA replication 27 2.81E-10
GO:0000075 cell cycle checkpoint 25 3.30E-10
GO:0007155 cell adhesion 54 5.13E-10
GO:0000082 G1/S transition of mitotic cell cycle 25 2.88E-09
GO:0006915 apoptotic process 54 5.52E-09
GO:0008285 negative regulation of cell proliferation 38 1.49E-08
GO:0007596 blood coagulation 44 5.51E-08
Molecular function
GO:0005515 protein binding 405 3.88E-85
GO:0000166 nucleotide binding 203 2.71E-41
GO:0005524 ATP binding 147 1.90E-30
GO:0046872 metal ion binding 171 7.35E-12
GO:0016301 kinase activity 30 2.35E-08
GO:0003824 catalytic activity 38 1.41E-07
GO:0016787 hydrolase activity 69 3.22E-07
GO:0016491 oxidoreductase activity 41 3.62E-07
GO:0009055 electron carrier activity 24 3.88E-07
GO:0019901 protein kinase binding 28 6.24E-07
GO:0003677 DNA binding 103 2.55E-06
GO:0004672 protein kinase activity 29 4.58E-06
GO:0019899 enzyme binding 23 6.10E-06
GO:0004674 protein serine/threonine kinase activity 34 9.76E-06
GO:0008017 microtubule binding 14 1.00E-05
Cellular component
GO:0005737 cytoplasm 455 1.77E-90
GO:0005634 nucleus 403 5.20E-59
GO:0005829 cytosol 214 3.68E-47
GO:0005654 nucleoplasm 99 4.43E-24
GO:0005730 nucleolus 129 2.06E-22
GO:0005694 chromosome 45 1.28E-17
GO:0005576 extracellular region 141 1.74E-17
GO:0005615 extracellular space 77 1.18E-15
GO:0005886 plasma membrane 206 4.70E-14
GO:0005856 cytoskeleton 77 6.31E-14
fatty acid, cytokines-cell factor receptor interactions, prion diseases, etc. (Table 3).
PPI Network Constructions
For PPI networks of the 20 most significantly dyregulated genes, they consisted of 377 edges and 503 nodes. Three hub proteins were identified in this network, including
CCT3(121°),NDC80(98°), andASPM(93°) (Fig. 2).
Experimental and TCGA database validation of selected genes in HCC patients
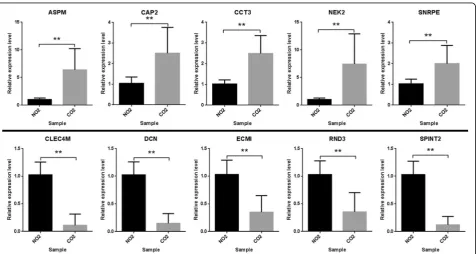
Ten genes (ASPM, CAP2, CCT3, NEK2, SNRPE, CLEC4M,
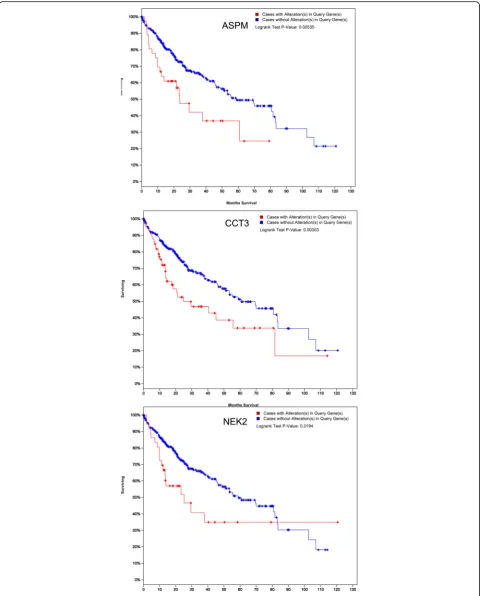
DCN, ECM1, RND3 and SPINT2) were randomly re-trieved from the 20 most significantly up-regulated or down-regulated genes, respectively. After performing RT-PCR, the expression levels of selected 10 genes in clinical samples were identical with the results of the integrated analysis. For the ten genes, the mRNA expression was statistically different between tumor and matched adjacent normal liver tissues (Fig. 3; Additional file 1: Table S3) (P< 0.01). Furthermore, results of TCGA database validation indicated that these genes showed similar expression trends to those obtained from the integrated analysis (Fig. 4). Among the ten genes, only the ASPM, CCT3, and NEK2 showed significant association with
overall survival time of HCC patients in TCGA data-base (P< 0.05) (Fig. 5).
Discussion
It is generally accepted that the altered gene expression pattern of a cancer tissue should be associated with the initiation and maintenance of the malignant phenotype. Previous studies have identified several HCC gene ex-pression profiles [18–21]. However, there wasn’t a com-mon pattern acom-mong disparate studies for HCC. While in this study, we integrated different microarray studies to identify a precise gene expression profile for HCC with more statistical power supported by large sample size. In the current study, an integrated analysis of seven HCC microarray datasets was conducted, and showed that 1167 DEGs were identified, among which 628 genes were up-regulated and 539 genes were down-regulated. These genes mainly participated in the process of cell cycle, oocyte meiosis, and oocyte maturation mediated by progesterone.
In the current study, further annotation and PPI network analysis of the 20 most significant DEGs were conducted. Most of the 20 genes were involved in the pathways of cell cycle, cytokines-cell factor receptor interactions, and intra-cellular signaling cascades, and their involvements in HCC have also been reported [22–26]. The functions of the 20 Table 2Partial results of gene ontology (GO) analysis(Continued)
GO:0005819 spindle 25 1.40E-12
GO:0000777 condensed chromosome kinetochore 18 2.41E-11
GO:0005874 microtubule 34 4.10E-10
GO:0005622 intracellular 122 4.20E-10
Table 3Partial results of Kyoto Encyclopedia of Genes and Genomes (KEGG) analysis
KEGG ID KEGG term No. of genes FDR
hsa04110 Cell cycle 29 1.08E-14
hsa04114 Oocyte meiosis 20 5.61E-08
hsa04914 Progesterone-mediated oocyte maturation 17 1.93E-07
hsa05200 Pathways in cancer 33 6.75E-07
hsa04115 p53 signaling pathway 13 1.07E-05
hsa04145 Phagosome 18 1.75E-05
hsa00071 Fatty acid metabolism 10 1.98E-05
hsa04060 Cytokine-cytokine receptor interaction 26 2.02E-05
hsa05020 Prion diseases 9 2.65E-05
hsa00230 Purine metabolism 19 2.73E-05
hsa00830 Retinol metabolism 11 8.59E-05
hsa04360 Axon guidance 16 9.27E-05
hsa00590 Arachidonic acid metabolism 10 1.20E-04
hsa05110 Vibrio cholerae infection 10 1.20E-04
Fig. 2Protein-protein interaction analysis of the 20 most significantly DEGs: Red was up-regulated DEGs; Blue was down-regulated DEGs
genes were in accordance with the results of GO and KEGG analysis. Three genes, includingCCT3,NDC80, and
ASPMwere proved to be highly connected in the PPI net-work. CCT3, a subunit of CCT cluster, plays a role in assisting the folding of proteins involved in important biological processes.CCT3was found to display a signifi-cantly different gene expression level in HCC compared to adjacent non-malignant liver tissues, arising from the occurrence of the amplicon 1q21-q22 [27], which is consistent with our result of RT-PCR validation. In addition, other genes’ expression status detected by RT-PCR was totally in accordance with the result of integrated analysis, suggesting that the bioinformatics method of inte-grated analysis was credible.
ASPMwas highly expressed in fetal tissues but lowly in most adult tissues. Our result and previous evidences [23] found that ASPM and NEK2 mRNA was over-expressed in HCC. Moreover, we found thatASPM,NEKandCCT3 expression present significant association with over-all survival of HCC patients based on TCGA validation, predicting enhanced invasive/metastatic potential of HCC and higher risk of early tumor recurrence. ASPM, NEK and CCT3 may be applied as potential prognostic biomarkers for HCC. CAP2 overexpression was also discovered in our study, andCAP2has been suggested as a candidate biomarker of HCC owing to elevated level in the serum of HCC patients [28].
Among the 10 most significantly down-regulated genes, DCN, an extracellular matrix proteoglycan, has important biological functions in growth, development and diseases. Loss of the decorin gene, which are known to interfere with cellular events of tumorigenesis mainly
by blocking various receptor tyrosine kinases such as EGFR, Met, IGF-IR, PDGFR and VEGFR2, is permissive for tumorigenic growth of HCC with decreasing levels of the cyclin-dependent kinase inhibitor p21WAF1/CIP1, sug-gesting potential utilization of DCN as an antitumor agent in HCC [29]. RND3 down-regulation in HCC pa-tients has been reported by several studies [26, 30, 31], and may be a metastasis suppressor gene in HCC.
However, the expression patterns of four genes among the 20 most significant DEGs in the current study were inconsistent with or ignored in the previous studies, in-cludingTBCE,SPINT2,ECM1, andKZAN. The function of KZAN was not identified, whereas the other three genes were all comprehensively studied. In the current study, the inconsistent results might inspire their roles in the oncogenesis and development of HCC with some novel views.
SPINT2 encodes a transmembrane protein with two extracellular Kunitz domains that inhibits a variety of serine proteases. The protein product ofSPINT2inhibits HGF activator, which prevents the formation of active hepatocyte growth factor, has been taken as a putative tumor suppressor [32]. Previous studies mainly focus on the methylation ofSPINT2in HCC instead of its expres-sion [33, 34]. Nevertheless, we have found that the ex-pression level of SPINT2was significantly suppressed in HCC expression profiles. The pattern was consistent with that in cell renal cell carcinoma [32], which might indicate its potential application as a novel HCC suppressor.
biology. It interacts with a variety of extracellular and structural proteins, contributing to the maintenance of skin integrity and homeostasis [35]. The expression of
ECM1 is reported to be significantly up-regulated in HCC patients [24], however, the current analyses of ex-pression profiles showed that exex-pression of ECM1 was suppressed in HCC patients and were confirmed using RT-PCR. The discrepancy revealed the complicated functions ofECM1 in the oncogenesis and development of HCC.
Conclusions
In short, the current study gave an explicit elucidation of dysregulated genes in HCC by the integrated analysis of microarray datasets in GEO database, the biological function of these genes was significantly enriched in cell cycle. The results of RT-PCR and TCGA validation were consistent with that of integrated analysis, indicating the high credibility of this integrated analysis method. In addition, our study showed that some genes could be potentially valuable in the clinical diagnosis (such as
ASPM, NEK2 and CCT3) and anticancer therapy (such as DCN, RND3) for HCC. Our study improved the un-derstanding of the transcriptome status of HCC, and might shed a light on the further investigation on the mechanisms of HCC.
Additional file
Additional file 1:Table S1.Detail information of primers.Table S2.
Information of the most significantly up-regulated or down-regulated DEGs in HCC.Table S3.The expression values of 10 genes on all 5 HCC cases. (DOC 89 kb)
Abbreviations
BioGRID:Biological General Repository for Interaction Datasets;
DEG: Differential expressed genes; GEO: Gene Expression Omnibus; GO: Gene ontology; HCC: Hepatocellular carcinomas; KEGG: Kyoto Encyclopedia of Genes and Genomes; MATLAB: MATrixLABoratory; PPI: Protein-protein interaction; RT-PCR: Real time polymerase chain reaction
Acknowledgements
Not applicable.
Funding
Not applicable.
Availability of data and materials
The dataset supporting the conclusions of this article is included within the article (Tables 1, 2 and 3).
Authors’contributions
XWH conceived of the study. WFF, WRL and QXL carried out data analysis, participated in its design and coordination and drafted the manuscript. LQW, HYX, YJW and ZHX collected the transcriptome data. WQ, LGH, ZFY and ZH performed the analysis of raw data. ZX, PXM, and BY carried out Real time PCR. All authors read and approved the final manuscript.
Competing interests
The authors declare that they have no competing interests.
Consent for publication
Not applicable.
Ethics approval and consent to participate
This study was approved by the First Affiliated Hospital of PLA General Hospital ethics committee (Reference number: 201403166). Written informed consents were obtained from the enrolled patients.
Author details 1
Department of Oncology, The First Affiliated Hospital of PLA General Hospital, Fucheng Road 51, Beijing 100048, China.2Department of Bioinformatics, Beijing Medintell Biomed Co., Ltd, Beijing, China.
Received: 1 August 2016 Accepted: 30 December 2016
References
1. Bosch FX, Ribes J, Borras J. Epidemiology of primary liver cancer. Semin Liver Dis. 1999;19:271–85.
2. Zhou XD, Tang ZY, Yang BH, Lin ZY, Ma ZC, Ye SL, Wu ZQ, Fan J, Qin LX, Zheng BH. Experience of 1000 patients who underwent hepatectomy for small hepatocellular carcinoma. Cancer. 2001;91:1479–86.
3. Bruix J, Llovet JM. Major achievements in hepatocellular carcinoma. Lancet. 2009;373:614–6.
4. Chaiteerakij R, Addissie BD, Roberts LR. Update on biomarkers of hepatocellular carcinoma. Clin Gastroenterol Hepatol. 2015;13:237–45. 5. Miao HL, Pan ZJ, Lei CJ, Wen JY, Li MY, Liu ZK, Qiu ZD, Lin MZ, Chen NP,
Chen M. Knockdown of GPC3 inhibits the proliferation of Huh7 hepatocellular carcinoma cells through down-regulation of YAP. J Cell Biochem. 2013;114:625–31.
6. Villa E, Critelli R, Lei B, Marzocchi G, Camma C, Giannelli G, Pontisso P, Cabibbo G, Enea M, Colopi S, et al. Neoangiogenesis-related genes are hallmarks of fast-growing hepatocellular carcinomas and worst survival. Results from a prospective study. Gut. 2016;65:861–9.
7. Rhodes DR, Chinnaiyan AM. Integrative analysis of the cancer transcriptome. Nat Genet. 2005;37(Suppl):S31–7.
8. Kim BY, Lee JG, Park S, Ahn JY, Ju YJ, Chung JH, Han CJ, Jeong SH, Yeom YI, Kim S, et al. Feature genes of hepatitis B virus-positive hepatocellular carcinoma, established by its molecular discrimination approach using prediction analysis of microarray. Biochim Biophys Acta. 2004;1739:50–61. 9. Liao YL, Sun YM, Chau GY, Chau YP, Lai TC, Wang JL, Horng JT, Hsiao M,
Tsou AP. Identification of SOX4 target genes using phylogenetic footprinting-based prediction from expression microarrays suggests that overexpression of SOX4 potentiates metastasis in hepatocellular carcinoma. Oncogene. 2008;27:5578–89.
10. Hodo Y, Honda M, Tanaka A, Nomura Y, Arai K, Yamashita T, Sakai Y, Mizukoshi E, Sakai A, Sasaki M, et al. Association of interleukin-28B genotype and hepatocellular carcinoma recurrence in patients with chronic hepatitis C. Clin Cancer Res. 2013;19:1827–37.
11. Chung EJ, Sung YK, Farooq M, Kim Y, Im S, Tak WY, Hwang YJ, Kim YI, Han HS, Kim JC, Kim MK. Gene expression profile analysis in human hepatocellular carcinoma by cDNA microarray. Mol Cells. 2002;14:382–7. 12. Yang Z, Chen Y, Fu Y, Yang Y, Zhang Y, Li D. Meta-analysis of differentially
expressed genes in osteosarcoma based on gene expression data. BMC Med Genet. 2014;15:80.
13. Reimers M, Carey VJ. Bioconductor: an open source framework for
bioinformatics and computational biology. Methods Enzymol. 2006;411:119–34. 14. Tabas-Madrid D, Nogales-Cadenas R, Pascual-Montano A. GeneCodis3: a
non-redundant and modular enrichment analysis tool for functional genomics. Nucleic Acids Res. 2012;40:W478–83.
15. Shannon P, Markiel A, Ozier O, Baliga NS, Wang JT, Ramage D, Amin N, Schwikowski B, Ideker T. Cytoscape: a software environment for integrated models of biomolecular interaction networks. Genome Res. 2003;13:2498–504. 16. Goldman M, Craft B, Swatloski T, Cline M, Morozova O, Diekhans M,
Haussler D, Zhu J. The UCSC Cancer Genomics Browser: update 2015. Nucleic Acids Res. 2015;43:D812–7.
18. Zhou X, Zheng R, Zhang H, He T. Pathway crosstalk analysis of microarray gene expression profile in human hepatocellular carcinoma. Pathol Oncol Res. 2015;21:563–9.
19. Melis M, Diaz G, Kleiner DE, Zamboni F, Kabat J, Lai J, Mogavero G, Tice A, Engle RE, Becker S, et al. Viral expression and molecular profiling in liver tissue versus microdissected hepatocytes in hepatitis B virus-associated hepatocellular carcinoma. J Transl Med. 2014;12:230.
20. Smalling RL, Delker DA, Zhang Y, Nieto N, McGuiness MS, Liu S, Friedman SL, Hagedorn CH, Wang L. Genome-wide transcriptome analysis identifies novel gene signatures implicated in human chronic liver disease. Am J Physiol Gastrointest Liver Physiol. 2013;305:G364–74.
21. Tsuchiya M, Parker JS, Kono H, Matsuda M, Fujii H, Rusyn I. Gene expression in nontumoral liver tissue and recurrence-free survival in hepatitis C virus-positive hepatocellular carcinoma. Mol Cancer. 2010;9:74. 22. Uemura M, Fujimura Y, Ko S, Matsumoto M, Nakajima Y, Fukui H. Pivotal role
of ADAMTS13 function in liver diseases. Int J Hematol. 2010;91:20–9. 23. Lin SY, Pan HW, Liu SH, Jeng YM, Hu FC, Peng SY, Lai PL, Hsu HC. ASPM is a
novel marker for vascular invasion, early recurrence, and poor prognosis of hepatocellular carcinoma. Clin Cancer Res. 2008;14:4814–20.
24. Chen H, Jia WD, Li JS, Wang W, Xu GL, Ma JL, Ren WH, Ge YS, Yu JH, Liu WB, et al. Extracellular matrix protein 1, a novel prognostic factor, is associated with metastatic potential of hepatocellular carcinoma. Med Oncol. 2011;28 Suppl 1:S318–25.
25. Tahara D, Nakanishi T, Akazawa S, Yamaguchi Y, Yamamoto H, Akashi M, Chikuba N, Okuno S, Maeda Y, Kusumoto Y, et al. Lecithin-cholesterol acyltransferase and lipid transfer protein activities in liver disease. Metabolism. 1993;42:19–23.
26. Grise F, Sena S, Bidaud-Meynard A, Baud J, Hiriart JB, Makki K, Dugot-Senant N, Staedel C, Bioulac-Sage P, Zucman-Rossi J, et al. Rnd3/RhoE Is down-regulated in hepatocellular carcinoma and controls cellular invasion. Hepatology. 2012; 55:1766–75.
27. Wong N, Chan A, Lee SW, Lam E, To KF, Lai PB, Li XN, Liew CT, Johnson PJ. Positional mapping for amplified DNA sequences on 1q21-q22 in hepatocellular carcinoma indicates candidate genes over-expression. J Hepatol. 2003;38:298–306.
28. Sakamoto M, Mori T, Masugi Y, Effendi K, Rie I, Du W. Candidate molecular markers for histological diagnosis of early hepatocellular carcinoma. Intervirology. 2008;51 Suppl 1:42–5.
29. Horvath Z, Kovalszky I, Fullar A, Kiss K, Schaff Z, Iozzo RV, Baghy K. Decorin deficiency promotes hepatic carcinogenesis. Matrix Biol. 2014;35:194–205. 30. Guo X, Cao C, Sun J, Zhang D, Liu L, Wu D. miR-128a is up-regulated in
hepatocellular carcinoma and promotes tumor cell proliferation by targeting RND3. Nan Fang Yi Ke Da Xue Xue Bao. 2014;34:1408–13. 31. Luo H, Dong Z, Zou J, Zeng Q, Wu D, Liu L. Down-regulation of RhoE is
associated with progression and poor prognosis in hepatocellular carcinoma. J Surg Oncol. 2012;105:699–704.
32. Morris MR, Gentle D, Abdulrahman M, Maina EN, Gupta K, Banks RE, Wiesener MS, Kishida T, Yao M, Teh B, et al. Tumor suppressor activity and epigenetic inactivation of hepatocyte growth factor activator inhibitor type 2/SPINT2 in papillary and clear cell renal cell carcinoma. Cancer Res. 2005;65: 4598–606.
33. Moribe T, Iizuka N, Miura T, Kimura N, Tamatsukuri S, Ishitsuka H, Hamamoto Y, Sakamoto K, Tamesa T, Oka M. Methylation of multiple genes as molecular markers for diagnosis of a small, well-differentiated hepatocellular carcinoma. Int J Cancer. 2009;125:388–97.
34. Iizuka N, Oka M, Sakaida I, Moribe T, Miura T, Kimura N, Tamatsukuri S, Ishitsuka H, Uchida K, Terai S, et al. Efficient detection of hepatocellular carcinoma by a hybrid blood test of epigenetic and classical protein markers. Clin Chim Acta. 2011;412:152–8.
35. Smits P, Ni J, Feng P, Wauters J, Van Hul W, Boutaibi ME, Dillon PJ, Merregaert J. The human extracellular matrix gene 1 (ECM1): genomic structure, cDNA cloning, expression pattern, and chromosomal localization. Genomics. 1997;45:487–95.
• We accept pre-submission inquiries
• Our selector tool helps you to find the most relevant journal
• We provide round the clock customer support
• Convenient online submission
• Thorough peer review
• Inclusion in PubMed and all major indexing services
• Maximum visibility for your research
Submit your manuscript at www.biomedcentral.com/submit