organic papers
Acta Cryst.(2007). E63, o329–o330 doi:10.1107/S1600536806053426 Zhouet al. C
10H8N2O
o329
Acta Crystallographica Section E Structure Reports Online
ISSN 1600-5368
(
E
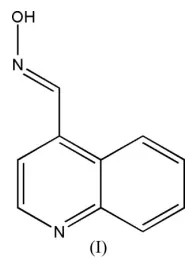
)-Quinoline-4-carbaldehyde oxime
Fu-Hui Zhou,aHong-Bin Zhao,a* Xiao-Dan Gu,bZhi-Gang Licand Jing-Wei Xuc*
aDepartment of Organic Chemistry, The College
of Chemistry, Xiangtan University, Hunan 411105, People’s Republic of China,
bDepartment of Applied Chemistry, The College
of Chemistry, Xiangtan University, Hunan 411105, People’s Republic of China, and
c
National Analytical Research Center of Electrochemistry and Spectroscopy, Changchun Institute of Applied Chemistry, Chinese Academy of Sciences, Changchun 130022, People’s Republic of China
Correspondence e-mail:
[email protected], [email protected]
Key indicators
Single-crystal X-ray study T= 293 K
Mean(C–C) = 0.002 A˚ Rfactor = 0.047 wRfactor = 0.134
Data-to-parameter ratio = 14.1
For details of how these key indicators were automatically derived from the article, see http://journals.iucr.org/e.
Received 7 December 2006 Accepted 10 December 2006
#2007 International Union of Crystallography
All rights reserved
The title compound, C10H8N2O, exists as the Eisomer. The crystal packing is stabilized by intermolecular O—H N and C—H N hydrogen bonds, as well as–stacking.
Comment
[image:1.610.283.378.277.406.2]The title compound, (I), was synthesized to support our ongoing drug development program. Its structure is shown in Fig. 1. The molecule exists as theEisomer.
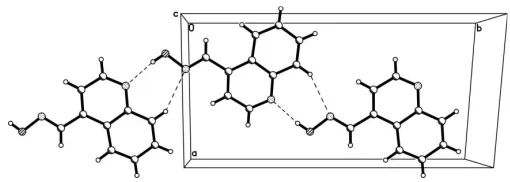
In the structure there are two kinds of intermolecular hydrogen bonds, namely O—H N and C—H N (Table 1). These generate a dimericR2
2(7) motif (Bernsteinet al., 1995), and assemble these dimers into one-dimensional supra-molecular chains (Fig. 2). The chains are arranged in an antiparallel fashion and are stabilized by–stacking inter-actions between the quinoline rings at (x,y,z) and (x+ 1.272,
y+ 0.321, z+ 3.342) with centroid-to-centroid distances of 3.590 (2) A˚ .
Figure 1
[image:1.610.208.457.545.723.2]Experimental
Compound (I) was prepared according to a known procedure (Ginsburg & Wilson, 1957). Single crystals suitable for X-ray diffraction were obtained by slow evaporation of a methanol solution at room temperature.
Crystal data
C10H8N2O Mr= 172.18
Monoclinic,P21=c a= 8.161 (2) A˚
b= 15.746 (4) A˚
c= 7.1509 (18) A˚
= 110.826 (4)
V= 858.8 (4) A˚3
Z= 4
Dx= 1.332 Mg m
3
MoKradiation
= 0.09 mm1 T= 293 (2) K Prism, colorless 0.250.150.10 mm
Data collection
Bruker SMART APEX diffractometer
’and!scans
Absorption correction: multi-scan (SADABS; Sheldrick, 1996)
Tmin= 0.978,Tmax= 0.991
4737 measured reflections 1688 independent reflections 1441 reflections withI> 2(I)
Rint= 0.015
max= 26.1
Refinement
Refinement onF2 R[F2> 2(F2)] = 0.047 wR(F2) = 0.134
S= 1.04 1688 reflections 120 parameters
H-atom parameters constrained
w= 1/[2
(Fo2) + (0.0805P)2
+ 0.1178P]
whereP= (Fo2+ 2Fc2)/3
(/)max< 0.001
max= 0.17 e A˚
3
min=0.22 e A˚
3
Extinction correction:SHELXL97
Extinction coefficient: 0.051 (7)
Table 1
Hydrogen-bond geometry (A˚ ,).
D—H A D—H H A D A D—H A
O1—H1 N1i
0.82 1.97 2.782 (2) 171 C10—H10 N2ii 0.93 2.56 3.377 (3) 146
Symmetry codes: (i)xþ1;y1
2;zþ12; (ii)xþ1;yþ12;zþ12.
The hydroxy H atom was located in a difference Fourier map and refined as riding in its as-found relative position, with Uiso(H) =
1.5Ueq(O), while other H atoms were placed in calculated positions
(C—H = 0.93 A˚ ) and refined in riding mode, withUiso(H) = 1.2Ueq(C)
Data collection:SMART(Bruker, 1998); cell refinement:SAINT
(Bruker, 2003); data reduction:SAINT; program(s) used to solve structure:SHELXS97(Sheldrick, 1997); program(s) used to refine structure: SHELXL97 (Sheldrick, 1997); molecular graphics:
SHELXTL (Bruker, 1997); software used to prepare material for publication:SHELXTL.
This work is supported by the National Analytical Research Center of Electrochemistry and Spectroscopy, Changchun Institute of Applied Chemistry, Changchun, China.
References
Bernstein, J., Davis, R. E., Shimoni, L. & Chang, N.-L. (1995).Angew. Chem. Int. Ed. Engl.34, 1555–1573.
Bruker (1997).SHELXTLReference Manual. Version 5.1. Bruker AXS Inc., Madison, Wisconsin, USA.
Bruker (1998).SMART Software Reference Manual. Version 5.0. Bruker AXS Inc., Madison, Wisconsion, USA.
Bruker (2003).SAINT Software Reference Manual. Version 6. Bruker AXS Inc., Madison, Wisconsion, USA.
Ginsburg, S. & Wilson, I. R. (1957).J. Am. Chem. Soc.79, 481–483. Sheldrick, G. M. (1996).SADABS. University of Go¨ttingen, Germany. Sheldrick, G. M. (1997). SHELXS97 and SHELXL97. University of
[image:2.610.311.566.69.160.2]Go¨ttingen, Germany.
Figure 2
supporting information
sup-1 Acta Cryst. (2007). E63, o329–o330
supporting information
Acta Cryst. (2007). E63, o329–o330 [https://doi.org/10.1107/S1600536806053426]
(
E
)-Quinoline-4-carbaldehyde oxime
Fu-Hui Zhou, Hong-Bin Zhao, Xiao-Dan Gu, Zhi-Gang Li and Jing-Wei Xu
(E)-Quinoline-4-carbaldehyde oxime
Crystal data
C10H8N2O
Mr = 172.18
Monoclinic, P21/c
Hall symbol: -P 2ybc
a = 8.161 (2) Å
b = 15.746 (4) Å
c = 7.1509 (18) Å
β = 110.826 (4)°
V = 858.8 (4) Å3
Z = 4
F(000) = 360
Dx = 1.332 Mg m−3
Mo Kα radiation, λ = 0.71073 Å Cell parameters from 2173 reflections
θ = 2.6–26.1°
µ = 0.09 mm−1
T = 293 K Prism, colorless 0.25 × 0.15 × 0.10 mm
Data collection
Bruker SMART APEX diffractometer
Radiation source: fine-focus sealed tube Graphite monochromator
φ and ω scans
Absorption correction: multi-scan (SADABS; Sheldrick, 1996)
Tmin = 0.978, Tmax = 0.991
4737 measured reflections 1688 independent reflections 1441 reflections with I > 2σ(I)
Rint = 0.015
θmax = 26.1°, θmin = 2.6°
h = −10→8
k = −17→19
l = −7→8
Refinement
Refinement on F2
Least-squares matrix: full
R[F2 > 2σ(F2)] = 0.047
wR(F2) = 0.134
S = 1.04 1688 reflections 120 parameters 0 restraints
Primary atom site location: structure-invariant direct methods
Secondary atom site location: difference Fourier map
Hydrogen site location: inferred from neighbouring sites
H-atom parameters constrained
w = 1/[σ2(F
o2) + (0.0805P)2 + 0.1178P]
where P = (Fo2 + 2Fc2)/3
(Δ/σ)max < 0.001
Δρmax = 0.17 e Å−3
Δρmin = −0.22 e Å−3
Extinction correction: SHELXL97, Fc*=kFc[1+0.001xFc2λ3/sin(2θ)]-1/4
Special details
Geometry. All e.s.d.'s (except the e.s.d. in the dihedral angle between two l.s. planes) are estimated using the full covariance matrix. The cell e.s.d.'s are taken into account individually in the estimation of e.s.d.'s in distances, angles and torsion angles; correlations between e.s.d.'s in cell parameters are only used when they are defined by crystal symmetry. An approximate (isotropic) treatment of cell e.s.d.'s is used for estimating e.s.d.'s involving l.s. planes.
Refinement. Refinement of F2 against ALL reflections. The weighted R-factor wR and goodness of fit S are based on F2,
conventional R-factors R are based on F, with F set to zero for negative F2. The threshold expression of F2 > σ(F2) is used
only for calculating R-factors(gt) etc. and is not relevant to the choice of reflections for refinement. R-factors based on F2
are statistically about twice as large as those based on F, and R- factors based on ALL data will be even larger.
Fractional atomic coordinates and isotropic or equivalent isotropic displacement parameters (Å2)
x y z Uiso*/Ueq
N1 0.54839 (15) 0.28890 (7) 0.17710 (18) 0.0482 (3) N2 0.33039 (16) −0.00720 (7) 0.1929 (2) 0.0536 (4) O1 0.22115 (14) −0.07671 (6) 0.1716 (2) 0.0734 (4)
H1 0.2804 −0.1191 0.2164 0.110*
C1 0.26701 (17) 0.22135 (8) 0.13337 (18) 0.0392 (3) C2 0.37347 (18) 0.29438 (8) 0.14897 (19) 0.0425 (3) C3 0.34699 (17) 0.14002 (8) 0.14489 (19) 0.0421 (3) C4 0.52148 (18) 0.13711 (9) 0.1682 (2) 0.0482 (4)
H4 0.5768 0.0851 0.1733 0.058*
C5 0.61525 (18) 0.21239 (9) 0.1841 (2) 0.0492 (4)
H5 0.7333 0.2083 0.2009 0.059*
C6 0.24744 (19) 0.06138 (9) 0.1333 (2) 0.0519 (4)
H6 0.1255 0.0619 0.0831 0.062*
C7 0.08872 (18) 0.23349 (9) 0.1088 (2) 0.0469 (4)
H7 0.0167 0.1865 0.0977 0.056*
C8 0.02109 (19) 0.31323 (10) 0.1013 (2) 0.0535 (4)
H8 −0.0959 0.3201 0.0872 0.064*
C9 0.1267 (2) 0.38488 (10) 0.1147 (2) 0.0577 (4)
H9 0.0789 0.4389 0.1085 0.069*
C10 0.2987 (2) 0.37606 (9) 0.1369 (2) 0.0535 (4)
H10 0.3672 0.4240 0.1441 0.064*
Atomic displacement parameters (Å2)
U11 U22 U33 U12 U13 U23
supporting information
sup-3 Acta Cryst. (2007). E63, o329–o330
C9 0.0632 (9) 0.0401 (8) 0.0634 (9) 0.0147 (7) 0.0147 (7) 0.0021 (6) C10 0.0596 (9) 0.0349 (7) 0.0606 (9) −0.0004 (6) 0.0148 (7) 0.0009 (6)
Geometric parameters (Å, º)
N1—C5 1.3161 (17) C4—C5 1.3934 (18)
N1—C2 1.3716 (18) C4—H4 0.9300
N2—C6 1.2653 (18) C5—H5 0.9300
N2—O1 1.3854 (15) C6—H6 0.9300
O1—H1 0.8200 C7—C8 1.3648 (19)
C1—C7 1.415 (2) C7—H7 0.9300
C1—C2 1.4215 (18) C8—C9 1.402 (2)
C1—C3 1.4263 (17) C8—H8 0.9300
C2—C10 1.4132 (19) C9—C10 1.362 (2)
C3—C4 1.3744 (19) C9—H9 0.9300
C3—C6 1.4670 (18) C10—H10 0.9300
C5—N1—C2 117.32 (11) C4—C5—H5 117.7
C6—N2—O1 113.02 (12) N2—C6—C3 118.83 (13)
N2—O1—H1 109.5 N2—C6—H6 120.6
C7—C1—C2 118.24 (11) C3—C6—H6 120.6
C7—C1—C3 123.89 (12) C8—C7—C1 120.85 (13)
C2—C1—C3 117.87 (12) C8—C7—H7 119.6
N1—C2—C10 118.08 (12) C1—C7—H7 119.6
N1—C2—C1 122.39 (12) C7—C8—C9 120.50 (13)
C10—C2—C1 119.53 (13) C7—C8—H8 119.8
C4—C3—C1 118.03 (11) C9—C8—H8 119.8
C4—C3—C6 120.51 (11) C10—C9—C8 120.57 (13)
C1—C3—C6 121.45 (12) C10—C9—H9 119.7
C3—C4—C5 119.78 (12) C8—C9—H9 119.7
C3—C4—H4 120.1 C9—C10—C2 120.31 (13)
C5—C4—H4 120.1 C9—C10—H10 119.8
N1—C5—C4 124.57 (13) C2—C10—H10 119.8
N1—C5—H5 117.7
Hydrogen-bond geometry (Å, º)
D—H···A D—H H···A D···A D—H···A
O1—H1···N1i 0.82 1.97 2.782 (2) 171
C10—H10···N2ii 0.93 2.56 3.377 (3) 146