Introduction
Corruption and its potential reduction is a con-stant topic not only of economic or social scien-ce research, but also an issue that plagues go-vernments and citizens alike. This phenomenon is more or less immanent in every social system, regardless of the size and sophistication of the country or culture of the nation. Despite the fact that corruption is not a new phenomenon and a number of foreign and domestic authors have been dealing with this subject for several years, there are still many questions that remain unan-swered. The very defi nition of the term corrupti-on is not yet clear, and different authors defi ne corruption with greater or smaller differences. For more detail, see e.g. [6], [9], [29], [20]. Even the question of whether and how corruption can affect the economic level of a country has never been answered by any literature without con-troversy. One may thus encounter the view that corruption is “sand in the wheels” of the eco-nomy, which impedes economic transactions, as it reduces the security of property rights and contributes to ineffi cient allocation of resources [23], [28], [24], [17], [13]. On the other hand, there are authors who believe that corruption is precisely what “greases the wheels” of the eco-nomy, because it allows individuals to avoid ad-ministrative and bureaucratic delays [12], [14], [15], [1], [16]. It can be said, however, that with the existence of adequate legislation, the argu-ment about corruption as “greasing the wheels of the economy” is totally unacceptable.
The issue of quantifying the degree of corruption also raises fi erce debate. Consi-dering the fact that bribery and other forms of corruption are illegal in most countries, the people involved make every effort to carefully conceal their actions and revealing corruption is often almost impossible. Even so, there are currently a number of exact procedures that attempt to quantify the level of corruption in
a country. Among the best known current in-dicators of corruption is one example, the CPI (Corruption Perception Index), published an-nually by Transparency International and the Control of Corruption of the World Bank [27]. A common feature of all currently existing indi-ces of corruption, however, is the fact that all without exception quantify the level of corrupti-on in a country and are therefore not applicable for quantifi cation of corruption at a sub-national level. The authors of this paper argue that the socio-economic development in a country is not homogeneous, and that it can be assumed that a difference exists in the extent of corruption in different regions within the same country. Under this assumption, more corrupt sub-national re-gions are detrimental to the national evaluation of corruption in a country as a whole. The fact that the distribution of corruption in a country is not homogenous was confi rmed by authors [2] and [5] in their studies of Italian regions. The le-vel of corruption in the sub national breakdown as reported by these authors was very diverse and its analysis can help explain the differen-ces in the different economic performance of the regions. It can be noted, however, that the study of the Italian authors is unique and fi nding another study on the quantifi cation of regional levels of corruption, or its impact on the regi-on, is virtually impossible. From this it is clear that the issue of quantifying corruption and its consequences at the regional level is a topic that deserves more attention. There are several reasons to consider these issues. Perhaps the strongest is that if corruption is indeed one of the variables that are degrading the performan-ce of economies, the elimination of corruption in certain regions may just be the key to removing regional economic disparities and thereby incre-asing the economic performance of the country. Analysing regional corruption may also lead to the creation of direct regional anti-corruption
QUANTIFYING CORRUPTION AT
A SUBNATIONAL LEVEL
initiatives that can bring about reductions in the national level of corruption. In general terms, a sub-national resolution in terms of the degree of corruption could bring a new dimension to traditional theories of regional disparities.
The main objective of this article is formula-ted in the context of the above considerations. It contains a design for a method of quantifying the extent of corruption at the level of regional cohesion. The proposed method is then verifi ed and applied to individual regions of the Member States and candidate States of the European Union. Using the proposed method it is possible to evaluate the current state of corruption in the evaluated regions, to mutually compare the re-gions, to determine the degree of deviation from the “surface” level of national corruption and si-multaneously determine the degree of variabili-ty in the extent of corruption within the country.
The text of this article presents the propo-sed method of quantifying the regional level of corruption verifi ed using Kendall’s coeffi cient of concordance for further use. Verifi cation of the proposed method is carried out at a natio-nal and regionatio-nal level. Methods at the nationatio-nal level are verifi ed by comparing the evaluation of the newly proposed method to the evaluation of existing corruption indices. This will determi-ne the level of agreement between the already established indices and the newly proposed method. The methods are verifi ed at the regi-onal level using police statistics on recorded corruption offences. After the method is verifi ed, the level of corruption in the various regions is calculated. Special attention is paid to quanti-fying the extent of corruption in the regions of the Czech Republic. Calculating the level of corruption in the Czech regions will identify tho-se regions which are more affected by corrupti-on than others and would thus worsen the nati-onal evaluation of the Czech Republic within the standard published indices of corruption.
1. Proposal for a Method of
Quantifying the Extent of
Corruption at a Sub-National Level
Due to the absence of any method for deter-mining corruption in a more or less affected sub-national region, the next section will pre-sent a method for quantifying corruption at a sub-national level. The design of this method is based on the construction of the European Quality of Government Index developed by the European Commission together with TheQua-lity of Government Institute. Corruption is unde-rstood here in accordance with the defi nition of Nye, who describes corruption as “behaviour that deviates from the formal duties of a pub-lic role because of private-regarding wealth or status gains“ [20]. This defi nition focuses on the abuse of public power, and somewhat ignores corruption in the private sector, which of cour-se also exists. Most existing studies, however, have focused on corruption in the public sector, as the consequences of misuse of public power impact the broad mass of taxpayers and the country as such.
1.1 The European Quality of
Government Index
The European Quality of Government Index (EQI) was created to quantify the quality of pu-blic administration at a regional level. The index so far been developed twice; in 2010 and 2013. 27 EU Member States were included in the EQI in 2010. In 2013, 28 EU Member States are in-cluded as well as the Candidate States Turkey and Serbia; in total 30 countries. The European Commission plans to construct EQI regularly every three years.
In addition to the national evaluation of the quality of governance, the resulting EQI also takes note of the evaluation of regional admini-stration using regional data which the Europe-an Commission has drawn up for the needs of constructing the EQI. The EQI thus consists of two main parts:
The fi rst part of the EQI takes into ac-count the national government level, which is represented by the Worldwide Governance Indicators (WGI) of the World Bank. Of the six pillars of the quality of governance, the Europe-an Commission chose four for the construction of the EQI: Voice and Accountability (GM1), Government Effectiveness (GM3), Rule of Law (GM5) Control of Corruption (GM6) [4], [26], [11].
The second part of the EQI, which takes into account the regional level of governan-ce, was compiled by the European Commission on the basis of a unique regional survey, condu-cted for the sole purpose of creating a Regional indicator of government quality, which would take into account regional aspects in the fi nal construction of the EQI.
Eu-ropean Union in 2010 (from the remaining 9 countries of the European Union only data at the national level was included). The research includes altogether 181 regional units. Data was obtained by means of surveying more than 33,000 inhabitants. The all-European regional research was conducted from 15th December
2009 to 1st February 2010 by means of
telepho-ne interviews with respondents older than 18 years and in the local language.
In the second construction of EQI, it was executed in 206 NUTS regions in 24 count-ries of the European Union in 2013 (from the remaining 7 countries of the European Union only data at the national level was included). The research includes altogether 213 regional units. Data was obtained by means of research of more than 85,000 inhabitants.
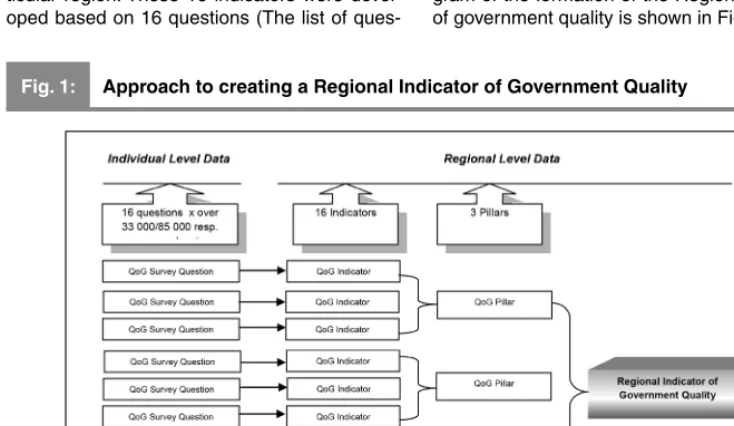
The resulting regional quality of adminis-tration indicator refl ects the actual experience of respondents with the use of individual pub-lic services, thus the quality of governance in the region is evaluated as it is perceived by its inhabitants; i.e., the recipients of public admin-istration. The Regional indicator of government quality is composed of 16 separate indicators relating to the quality of administration in a par-ticular region. These 16 indicators were devel-oped based on 16 questions (The list of
ques-tions is available at http://www.qog.pol.gu.se/ data/datadownloads/qogeuregionaldata/.) de-veloped in accordance with the pillars arising from the methodology of the WGI: Voice and Accountability, Government Effectiveness, Rule of Law and Control of Corruption. In order to capture the most important sub-national differ-ences, questions were focused on three public services that are often funded or administered at sub-national levels. Each of the four pillars mentioned thus involves issues relating to edu-cation, health care and law enforcement in the region. With a focus on these three services, respondents were asked to assess these public services with regard to the three fundamental concepts of quality administration - quality, im-partiality and corruption. These three concepts are the pillars of the resulting regional indicator of quality government. Data is aggregated three times using a simple average. First is the cre-ation of the average values of responses to the questions. This will create 16 indicators for each region. Then these 16 values are aggregated into three defi ned pillars - quality, impartiality and corruption. Finally, these three pillars are aggregated into a single numerical Regional quality of administration indicator. A simple dia-gram of the formation of the Regional indicator of government quality is shown in Figure 1.
Fig. 1: Approach to creating a Regional Indicator of Government Quality
Thus in its fi nal form, the resulting EU Quality of Government Index enriches the national evaluation of quality of administration created by the World Bank (WGI) on a regional scale (Regional indicator of government quality).
The fi nal form of the construction of the EQI is as follows:
EQIregionXincountryY= WGIcountryY+
+ (RqogregionXincountryY – CRqogcountryY), (1) where EQIregionXincountryY is the fi nal European Quality of Government Index in the region of a given country,
WGIcountryY is the national average of the above four Worldwide Governance Indicators
for each country,
RqogregionXincountryY is the score from a regional survey; thus the Regional indicator of government quality,
CRqogcountryY is the regional survey of all regions in the country weighted by the proportion of the population of each region to the national population of the country.
The EQI has so far been calculated twice; once in 2010 and in 2013. Member States of the EU-28, Turkey and Serbia, were included in the calculation.
1.2 Proposal for a Regional Index of
Corruption
It is apparent that the resulting EQI, as it was compiled by the European Commission together with The Quality of Government Institute, provi-des the opportunity to pursue a quantifi cation of corruption at a sub-national level, which had not previously been practically possible. The pri-mary modifi cations of the already created EQI can create a modifi ed index, which, of all the components of quality government, takes into account only corruption; it therefore takes into account only the indicator Control of Corrupti-on in the natiCorrupti-onal evaluatiCorrupti-on and the indicator Pillars of Corruption in the regional evaluation. Based on this modifi ed methodology of the EQI composition, the modifi ed method of calculating EQI can then be applied only for the purpose of quantifying corruption in the cohesion regions.
The resulting Regional Index of Corruption (RIC) is then calculated based on the formula:
RICregionXincountryY= CCcountryY+
+ (PCqogregionXincountryY – CPCqogcountryY), (2)
where RICregionXincountryY is the resulting
Regional Index of Corruption for each region of a given country,
CCcountryY is the national indicator value
of Control Of Corruption (GM6) from the
Worldwide Governance Indicators,
PCqogregionXincountryY is the score from a regional survey focused on corruption, thus Pillar of Corruption,
CPCqogcountryY is the value for the Pillar of Corruption from the regional survey of all regions in a country weighted by the proportion of the population in each region on the national population of the country.
Composite indicators often evoke a number of questions relating to their composition and weighting of the individual indicators entering into a composite indicator. There were created tens of aggregated indicators at the time when composite indicators reached a rapid expansion. Most of them, unfortunately, were not built on correct statistical basis [25]. Because of these errors composite indicators failed to meet expectations, which were inserted into them, sparking concerns among their users and negatively affected trust in composite indicators in general. The credibility of these indicators is mainly related to the accuracy of data, based on which they are constructed and the methodology by which they are constructed. Number of composite indicators is constructed by reputable international institution. Such indicators can get known and respected easier and earlier. However, although composite indicators are designed very carefully and statistical requirements have been met, their acceptation is always dependent on bargaining and how they are accepted by experts and public. Acceptation of aggregated indicators mostly depends on how they meet the original goal, i.e. whether measure what they should and the subsequent acceptance of their users. Gaining legitimacy and trust of users is a gradual process.
In the case of constructing indicator EQI was by the European Commission used an equal weighting of entering variables. With respect to author´s proposed RIC is a modifi cation of EQI, authors of the article do not consider important further weighting of variables entering into RIC.
2. Applying the Proposed Regional
Index of Corruption
level, then at the level of the cohesion regions. From the resulting values, the individual regions can be mutually compared and regions can be identifi ed which are more or less affected by corruption. Table 1 shows the resulting ranking of countries in the newly created RIC for the years 2010 and 2013. Countries in the segmented EQI 2013 are included; thus there are a total of 30
countries. The higher the value of the RIC, the better is the evaluation of the country’s RIC. In the evaluation of the RIC between 2010 and 2013, it was found that the new Member States and candidate States of the European Union are at the very bottom of the list of countries evaluated. Conversely, the Nordic countries were evaluated as the least affected by corruption.
NUTS I RIC 2010 Ranking NUTS I RIC 2013 Ranking
DK 1.811919 1 DK 1.841393 1
FI 1.740486 2 SE 1.559288 2
SE 1.516722 3 FI 1.555572 3
NL 1.438868 4 LU 1.493145 4
LU 1.261475 5 NL 1.479409 5
AT 1.142543 6 DE 0.932501 6
IE 0.948732 7 UK 0.779821 7
DE 0.917613 8 BE 0.749709 8
UK 0.830591 9 IE 0.726454 9
FR 0.488344 10 FR 0.703595 10
BE 0.415918 11 AT 0.609217 11
CY 0.322032 12 PT 0.168304 12
ES 0.157165 13 ES 0.131936 13
MT 0.083101 14 EE -0.0212 14
PT 0.029269 15 SI -0.05617 15
SI -0.07815 16 CY -0.07266 16
EE -0.12856 17 MT -0.1372 17
LV -0.67118 18 PL -0.56423 18
LT -0.70428 19 HU -0.76712 19
HU -0.71697 20 CZ -0.7947 20
PL -0.76271 21 SK -0.85981 21
SK -0.81496 22 LT -0.86415 22
CZ -0.85541 23 LV -0.92744 23
IT -0.87991 24 IT -1.05754 24
GR -1.06275 25 TR -1.08985 25
TR -1.08395 26 HR -1.14626 26
HR -1.23592 27 GR -1.38318 27
RO -1.37328 28 RO -1.39001 28
RS -1.55004 29 BG -1.43259 29
BG -1.55089 30 RS -1.46287 30
Source: Author’s own work
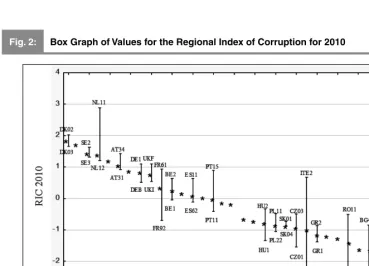
By using Statistica 12, graphic models were created of the variability of RIC values in individual countries for the years 2010 and 2013. The box plots use the method of min-max comparison and show the range of RIC values marking the best and the worst of the regions evaluated in the country. On the x-axis are plotted the countries evaluated; on the y-axis are the resulting values of the RIC in a given year. The range of values is complemented by the fi nal value of the RIC of the country, which is represented by an asterisk. Figure 2 shows the range of RIC values for 2010 in the thirty countries evaluated. Defi nitely the greatest variability in the assessment of corruption is to be found in the Italian regions. Italian respondents answered questions regarding the impact of corruption on their area with great differences, and perceived corruption very differently depending on which region they live. The most corrupt Italian region, based on the results of the RIC from 2010, is the Campania region
(ITF3), while the best ratings were achieved in the Umbria region (ITE2). A high variability was also observed in Romania, France and the Netherlands. Rating corruption at the national level can be particularly misleading for these countries. In the Czech Republic, a middle variability of RIC values was recorded. The top rated region is Jihozápad (Southwest) (CZ03) with a value of -0.9346 and the worst rating is the capital city of Prague (CZ01) with a value of -1.9878.
In the evaluation of RIC in 2010, the NUTS II regions which placed best were the Dutch region of Groningen (NL11) with a value of 2.8867. The best ratings in 2010 were achieved generally by Dutch, Danish, Finnish and Swedish regions. In contrast, at the other end of the ranking were Romanian, Italian and Bulgarian regions.
Defi nitely the worst ranking among the NUTS II regions was the Romanian region of Bucharest (RO32) with a value of -2.7491.
Fig. 2: Box Graph of Values for the Regional Index of Corruption for 2010
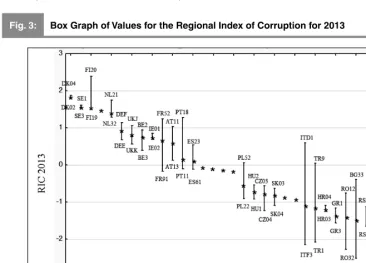
Figure 3 shows the range of values of RIC for 2013. In 2013, the region with the lowest level of corruption was the Finnish region of Aland (FI20) with a value of 2.3932. On the other hand, the most corrupt region of the European Union was the Bulgarian region of Yugozapaden (BG41) with a value of -2.5237. A high variability of data in 2013 was found again in Italy, as well as Bulgaria, Turkey and Romania. In these countries, the inhabitants of regions had different opinions on the impact of corruption in their area and the corruption
assessment may not refl ect the current situation in some regions. In contrast, in Danish, Swedish, Irish and Croatian regions only very small deviations, were detected in the values of RIC of 2013 and evaluation of the national level of corruption relevantly refl ects the evaluation of the regions. Within the Czech Republic, in 2013 the best region evaluated in terms of corruption was Jihozápad (Southwest) (CZ03) with a value of -0.5694 and the most corrupt region was Severozápad (Northwest) (CZ04) with a value of -1.2304.
The resulting RIC values demonstrate that some European Union countries show a very high degree of variability in the regional level of corruption. This confi rms the assumption that existing indices evaluating the national level of corruption can ultimately overestimate the regions more affected by corruption and underestimate the less corrupt. Defi nitely the greatest variability of the data evaluated in both years was demonstrated in the Italian regions. In Italy, as one of the smaller countries, several studies on corruption have been conducted in
various Italian regions. The authors [2] and [5] in their studies agree that the variability of the degree of corruption in the Italian regions is very high and in this country there are regions with very high levels of corruption, but also regions with much lower levels of corruption. By applying the proposed Regional Corruption Index (RIC), not only were the conclusions of the authors confi rmed regarding the Italian regions, but this conclusion is demonstrated in the majority of countries surveyed.
Fig. 3: Box Graph of Values for the Regional Index of Corruption for 2013
2.1 Verifying the Proposed Method
The proposed method of quantifying the degree of corruption at the regional level is subsequently verifi ed at national and regional level. Kendall’s coeffi cient of concordance can be used for mathematical verifi cation of the conformity of the assessment methods for the proposed RIC and existing indexes. This is a non-parametric method of mathematical statistics which is primarily used to assess the conformity of individual evaluators. The value of the coeffi cient varies between 0 (no agreement) and 1 (complete agreement) [10].2.1.1 Verifying Method at the National Level
In order to compare evaluations at the national level, two presently existing indices are selected which measure the degree of corruption in the country. These are indices that focus exclusively on quantifying the national level of corruption. The selected corruption indicators are the Corruption Perceptions Index (CPI) of Transparency International and the Control of Corruption (CC) of the World Bank [11], [27]. Given that data from the Regional government quality indicator, which was used for the construction of the RIC, has been collected among respondents since 2009 and the data
of the World Bank to evaluate the situation at the national level was drawn upon in 2008, it is appropriate, in assessing conformity of the ratings, to take into account not only data for 2010. To compare the resulting values of RIC for 2010, a time range of existing indices were selected for the years 2008–2010, which take into account the entire time period during which the data was collected for the RIC. To verify the agreement of the assessment of RIC for 2013, the time range 2011 to 2013 was chosen.
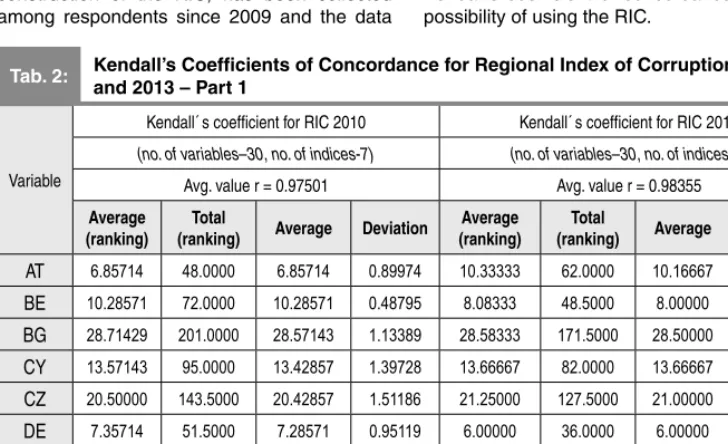
Table 2 presents the resulting calculation of Kendall’s coeffi cient of concordance ranking countries according to the RIC in 2010 and the CPI and CC from 2008 to 2010 and to the RIC 2013 and the CPI and the CPI and CC from 2011 to 2013 as evaluated by the program Statistica 12. Kendall’s coeffi cient of concordance assessing the order of the selected indices reaches around 98%. The RIC itself with each of the chosen indices for each year corellates in all cases at least at a level of 95%.
High values of the coeffi cients of concordance in both years indicate that the proposed RIC ranks countries in terms of their corruption very similarly to the currently used indices of corruption. These conclusions of Kendall’s coeffi cient of concordance verify the possibility of using the RIC.
Variable
Kendall´s coeffi cient for RIC 2010 Kendall´s coeffi cient for RIC 2013
(no. of variables–30, no. of indices-7) (no. of variables–30, no. of indices-6)
Avg. value r = 0.97501 Avg. value r = 0.98355
Average (ranking)
Total
(ranking) Average Deviation
Average (ranking)
Total
(ranking) Average Deviation
AT 6.85714 48.0000 6.85714 0.89974 10.33333 62.0000 10.16667 1.602082
BE 10.28571 72.0000 10.28571 0.48795 8.08333 48.5000 8.00000 0.632456
BG 28.71429 201.0000 28.57143 1.13389 28.58333 171.5000 28.50000 0.836660
CY 13.57143 95.0000 13.42857 1.39728 13.66667 82.0000 13.66667 1.861899
CZ 20.50000 143.5000 20.42857 1.51186 21.25000 127.5000 21.00000 1.095445
DE 7.35714 51.5000 7.28571 0.95119 6.00000 36.0000 6.00000
DK 1.14286 8.0000 1.00000 1.16667 7.0000 1.00000
EE 14.71429 103.0000 14.57143 2.22539 13.33333 80.0000 13.33333 1.032796
ES 13.85714 97.0000 13.85714 0.89974 13.66667 82.0000 13.66667 1.211060
FI 2.42857 17.0000 2.28571 0.75593 2.41667 14.5000 2.16667 0.983192
Source: Author’s own work
Tab. 2: Kendall’s Coeffi cients of Concordance for Regional Index of Corruption 2010
2.1.2 Verifying the Proposed Methods at the Regional Level
At present, virtually the only possible way to verify the proposed method at the regional level is to compare RIC with statistics of corruption offences in the regions of the Czech Republic. According to offi cial statistics of the Ministry of the Interior and the of the Czech National Police, however, only recorded cases of corruption can be traced, whose number is based on the activity of the state bodies. The strategy of the government in the fi ght against corruption for the period 2013–2014 indicates that corruption in the Czech Republic has a high degree
of latency and only a few cases have been uncovered [18]. According to the Government Programme for Combating Corruption of the Czech Republic, only one percent of corruption offences have been uncovered [19]. The actual number of these crimes that have occurred in recent years is likely to be much higher [21]. For the purposes of distinguishing the regions on the basis of corruption, without the need for a precise quantifi cation, this tool is usable.
In order to verify the Regional Corruption Index, the following corruption offences are used, related to corruption in public administration, which is defi ned by the Criminal
Variable
Kendall´s coeffi cient for RIC 2010 Kendall´s coeffi cient for RIC 2013
(no. of variables–30, no. of indices-7) (no. of variables–30, no. of indices-6)
Avg. value r = 0.97501 Avg. value r = 0.98355
Average (ranking)
Total
(ranking) Average Deviation
Average (ranking)
Total
(ranking) Average Deviation
FR 10.71429 75.0000 10.71429 0.48795 10.00000 60.0000 10.00000 0.632456
GR 26.07143 182.5000 25.85714 2.03540 28.33333 170.0000 28.33333 1.366260
HR 26.42857 185.0000 26.42857 0.78679 25.08333 150.5000 24.83333 1.329160
HU 19.28571 135.0000 19.28571 1.11269 19.50000 117.0000 19.50000 0.547723
IE 6.85714 48.0000 6.71429 0.75593 9.33333 56.0000 9.16667 0.408248
IT 23.85714 167.0000 23.85714 1.57359 25.41667 152.5000 25.33333 1.211060
LT 21.78571 152.5000 21.57143 2.99205 19.91667 119.5000 19.83333 1.940790
LU 5,00000 35.0000 5.00000 4.66667 28.0000 4.66667 0.516398
LV 21.78571 152.5000 21.57143 1.90238 22.41667 134.5000 22.16667 0.983192
MT 16.00000 112.0000 16.00000 1.41421 17.16667 103.0000 17.16667 1.329160
NL 3.92857 27.5000 3.85714 0.37796 4.33333 26.0000 4.33333 0.516398
PL 19.71429 138.000 19.57143 2.22539 17.33333 104.0000 17.33333 1.211060
PT 14.57143 102.0000 14.57143 1.81265 14.00000 84.0000 14.00000 1.673320
RO 28.14286 197.0000 28.00000 0.81649 27.41667 164.5000 27.33333 1.211060
RS 29.64286 207.5000 29.57143 0.53452 29.41667 176.5000 29.33333 0.816497
SE 2.50000 17.5000 2.42857 0.78680 2.41667 14.5000 2.33333 0.516398
SI 14.28571 100.0000 14.14286 2.11570 16.08333 96.5000 16.00000 0.894427
SK 21.64286 151.5000 21.42857 1.13389 23.33333 140.0000 23.16667 1.722401
TR 24.42857 171.0000 24.28571 1.25357 23.08333 138.5000 22.83333 1.722401
UK 8.92857 62.5000 8.85714 0.37796 7.25000 43.5000 7.16667 0.408248
Source: Author’s own work
Tab. 2: Kendall’s Coeffi cients of Concordance for Regional Index of Corruption 2010
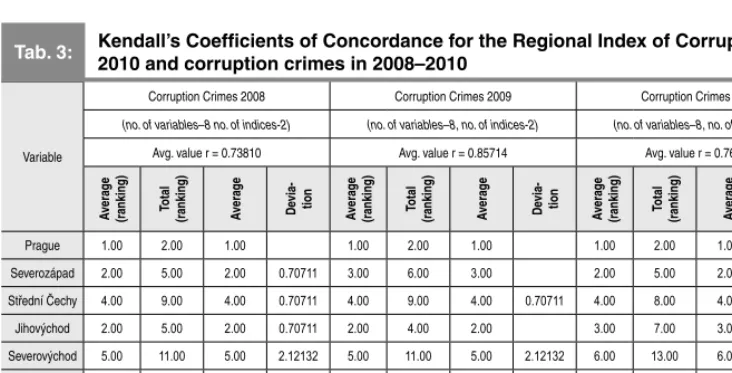
Code: accepting bribes (§ 331), bribery (§ 332) and indirect bribery (§ 333), abuse of power of offi cials (§ 329), obstruction of offi cial duties of a person by negligence (§ 330). Given that the most risky area is currently regarded to be the redistribution of public funds through procurement and auction sales, the analysis also includes the offences of manipulation of public procurement and public tenders (§ 257) and actions against public auctions (§ 258).
The following Table 3 shows the results of Kendall’s coeffi cient of concordance for the RIC of 2010 and the evaluation of the regions on the basis of crimes recorded in 2008–2010. The value of Kendall’s coeffi cient in all the years in question has a value of at least about 74%, which indicates a statistically signifi cant concordance between the assessment of the regions based on the RIC in 2010 and
rated based on police statistics. Verifi cation of conformity conclusions of RIC for 2013 and statistics of corruption offences recorded in the years 2011 to 2013 is shown in Table 4. The evaluation of RIC from 2013 coincides with police statistics of this period by at least 40%.
Verifi cation of data at the regional level is not as clear as with national data; however, the assessment of the regions on the basis of corruption offences and under the proposed Regional Corruption Index (RIC) has also been shown to coincide. The observed values of the assessed coeffi cients of concordance rank the regions based on the evaluation of police statistics and the proposed RIC confi rms the predicted use of this index as a tool for defi ning more and less corrupt areas at the regional level.
3. Quantifying the Degree of
Corruption in the Regions of the
Czech Republic
The development of RIC values for 2010 and 2013 for the regions of the Czech Republic in Table 5 show particularly evident signifi cantly worse ratings for the regions Severozápad and Moravskoslezsko between these periods. Conclusions of the RIC may support the conclusions of many organisations that deal with this issue, such. For example, according
to the non-profi t organisation Oživení, Moravskoslezsko is one of the worst regions evaluated, both in terms of transparency of public procurement, and in terms of the risk of confl ict of interest. According to research by the Industry and Transport Association, whose aim was to highlight the main issues of the business environment, companies and business owners consider corruption to be serious and a complication to their business activities mainly in the Severozápad region [22].
Variable
Corruption Crimes 2008 Corruption Crimes 2009 Corruption Crimes 2010
(no. of variables–8 no. of indices-2) (no. of variables–8, no. of indices-2) (no. of variables–8, no. of indices-2)
Avg. value r = 0.73810 Avg. value r = 0.85714 Avg. value r = 0.76190
A
vera
g
e
(ranking) Total (ranking) Avera
g
e
De
via-tion
A
vera
g
e
(ranking) Total (ranking) Avera
g
e
De
via-tion
A
vera
g
e
(ranking) Total (ranking) Avera
g
e
De
via-tion
Prague 1.00 2.00 1.00 1.00 2.00 1.00 1.00 2.00 1.00
Severo západ 2.00 5.00 2.00 0.70711 3.00 6.00 3.00 2.00 5.00 2.00 0.70711
Střední Čechy 4.00 9.00 4.00 0.70711 4.00 9.00 4.00 0.70711 4.00 8.00 4.00
Jiho východ 2.00 5.00 2.00 0.70711 2.00 4.00 2.00 3.00 7.00 3.00 2.12132
Severo východ 5.00 11.00 5.00 2.12132 5.00 11.00 5.00 2.12132 6.00 13.00 6.00 0.70711
MorSlez 6.00 13.00 6.00 2.12132 5.00 11.00 5.00 0.70711 4.00 8.00 4.00 1.41421
Jiho západ 7.00 15.00 7.00 0.70711 8.00 16.00 8.00 7.00 15.00 7.00 0.70711
Střední
Morava 6.00 12.00 6.00 6.00 13.00 6.00 0.70711 7.00 14.00 7.00 1.414211
Source: Author’s own work
Tab. 3: Kendall’s Coeffi cients of Concordance for the Regional Index of Corruption
Also, the suspension of fi nancial fl ows from EU funds to the ROP Severozápad because of a suspicion of corruption, which occurred in 2011, highlights the increased risk in this region. Greater improvements, however, were made in the Prague and Jihozápad regions. Since 2010, Prague has been one of the two regions to establish a regional anti-corruption strategy. It also seeks to fi ght against confl ict of interest by means of regularly updated codes of conduct for councillors and offi cials. The Jihomoravsko region is the second region in the Czech Republic which created its own anti-corruption strategy, in 2011. Also in the evaluation of the transparency of public tenders of the non-profi t organisation Oživení, the Jihovýchod region ranked second to Prague and in the assessment of the issue of confl ict of interest even overtook Prague and was rated as the best region struggling with this issue.
From the assessment of the Czech Republic within the RIC in 2010, it is clear that
the value of the index at the national level is considerably worsened by the Prague region. Also, the Jihovýchod and Severozápad regions reached a value lower than the Czech Republic as a whole. These three regions are ranked in the overall scale below the national assessment and can be expected to impair the national assessment of corruption in the Czech Republic as a whole. In the RIC evaluation from 2013, the Prague cohesion region is still below the national values of the RIC, although it has signifi cantly improved its score, as has the Severozápad region and now the Moravskoslezsko region. In the monitored period 2010–2013, these regions were identifi ed as regions affected by corruption more than other regions in the Czech Republic. It can therefore be assumed that the reduction of corruption in these regions would improve the assessment of the Czech Republic as a whole in the context of existing indices at the national level of corruption.
Variable
Corruption Crimes 2011 Corruption Crimes 2012 Corruption Crimes 2013
(no. of variables–8 no. of indices-2) (no. of variables–8, no. of indices-2) (no. of variables–8, no. of indices-2)
Avg. value r = 0.40476 Avg. value r = 0.71429 Avg. value r = 0.64286
A
vera
g
e
(ranking) Total (ranking) Avera
g
e
De
via-tion
A
vera
g
e
(ranking) Total (ranking) Avera
g
e
De
via-tion
A
vera
g
e
(ranking) Total (ranking) Avera
g
e
De
via-tion
Prague 2.00 4.00 2.00 1.41421 2.00 4.00 2.00 1.41421 2.00 4.00 2.00 1.41421
Severo západ 2.00 4.00 2.00 1.41421 1.00 3.00 1.00 0.70711 1.00 3.00 1.00 0.70711
Střední Čechy 3.00 6.00 3.00 1.41421 3.00 7.00 3.00 0.70711 3.00 7.00 3.00 0.70711
Jiho východ 5.00 10.00 5.00 1.41421 5.00 10.00 5.00 1.41421 5.00 10.00 5.00 1.41421
Severo východ 7.00 14.00 7.00 6.00 13.00 6.00 0.70711 6.00 13.00 6.00 0.70711
MorSlez 4.00 8.00 4.00 2.82843 3.00 7.00 3.00 2.12132 3.00 7.00 3.00 2.12132
Jiho západ 6.00 13.00 6.00 2.12132 8.00 16.00 8.00 7.00 15.00 7.00 0.70711
Střední
Morava 6.00 13.00 6.00 2.12132 6.00 12.00 6.00 1.41421 6.00 13.00 6.00 2.12132
Source: Author’s own work
Tab. 4: Kendall’s Coeffi cients of Concordance for the Regional Index of Corruption
Conclusion
In the text of this paper, the Regional Corruption Index, RIC, was proposed which, based on data from the World Bank and the European Commission, allows the level of corruption at the level of cohesion regions to be quantifi ed. The proposed index uses extensive surveys of knowledgeable institutions which deal with corruption in the long term and takes into account not only regional assessments of respondents living in a certain region, but also the national assessment of experts. It is an index that at present enriches the existing expert assessment with the views of the population in the cohesion regions, who are the users of public goods and services in the region.
With the use of a Regional Corruption Index, RIC, the regional level of corruption of all Member States of the European Union and some candidate countries was also calculated. The resulting RIC value demonstrated that some European Union countries show a very high degree of variability at the regional level of corruption. This confi rms the assumption that existing indices evaluating the national level of corruption can ultimately overestimate regions more affected by corruption and vice versa underestimate those less corrupt. Among the Member States with a very high variability of corruption within the cohesion regions are Italy, Romania and Bulgaria. Also in the Czech Republic, different corrupt activity was confi rmed within individual cohesion regions. The region most affected by corruption according to the
RIC of 2010 was the Prague cohesion region; according to the evaluation of the RIC of 2013 it was the Severozápad region. Both these indices showed the region least affected by corruption to be the Jihozápad region.
The authors of this paper believe that the new methodology for quantifying corruption at the sub-national level has the potential for broad theoretical and practical applications. Besides theoretical, scientifi c-research analysis leading to the defi nition of deviations in the regional level of corruption from the level of corruption at the national level, applying the RIC could allow the mutual comparison of individual sub-national levels of a country in terms of the degree of corruption and become a new tool for identifying the variability and intensity of corruption in a given area. Practically, it would help defi ne problem areas of a given region and facilitate direct identifi cation of anti-corruption initiatives. In this context, it is interesting that according to the last Anti-Corruption Report published by the European Commission, the Czech Republic, in drawing money from EU funds for the period 2007–2013, was rated the worst in the entire European Union. One of the key problems of drawing resources from European funds is particularly corruption. European funds so often, paradoxically, do not help remove undesirable regional disparities, but the distribution of those resources has been proven to increase opportunities for corruption, which brings additional negative economic consequences to the region, which may result in disparities within the country increasing [3].
NUTS RIC 2010 NUTS RIC 2013
Czech Republic -0.8554 Czech Republic -0.7947
1 Prague -1.5486 Severozápad -1.2304
2 Jihovýchod -0.9193 MorSlez. -1.1510
3 Severozápad -0.8958 Prague -1.0085
4 Stř. Čechy -0.8588 Stř. Čechy -0.7340
5 MorSlez. -0.7876 Stř. Morava -0.6699
6 Stř. Morava -0.7296 Jihovýchod -0.5734
7 Severovýchod -0.6218 Severovýchod -0.5715
8 Jihozápad -0.4954 Jihozápad -0.5694
Source: Author’s own work
At the current level of knowledge, the ability to quantify the extent of corruption at a sub-national level fi lls a gap that, within the general issue of corruption still exists, both in the Czech Republic and worldwide. Exposing corruption in today’s globalised environment is becoming more complex and it is an issue even for countries that generally achieve relatively good results. It is therefore necessary to continue charting corruption and prevent its further expansion. The present article only opens another direction of scientifi c research in this fi eld. It can be assumed that extending the time scale will allow the Regional Corruption Index, RIC, further research in this area, especially with regard to the need for a practical application of the proposed methodology at the level of authentic regions.
This paper was created within the project
SGSFES Scientifi c Research in Economic
Policy and Administration. Project registration number 2014002.
References
[1] BECK, P. J., MAHLER, M. W. A Comparison of Bribery and Bidding in Thin Markets.
Economics Letters. 1986, Vol. 20, pp. 1-5. ISSN 0165-1765. DOI: 10.1016/0165-1765(86)90068-6. [2] DEL MONTE, A., PAPAGNI, E. The Determinants of Corruption in Italy: Regional Panel Data Analysis. European Journal of
Political Economy. 2007, Vol. 23, pp. 379-396.
ISSN0176-2680.
[3] EUROPEAN COMISSION. Anti-corruption
report 2014 [online]. EC, 2014 [cit.
2014-06-20]. Available from: http://ec.europa.eu/dgs/ home-affairs/what-we-do/policies/organized- crime-and-human-trafficking/corruption/anti-corruption-report/index_en.htm.
[4] EUROPEAN COMISSION. Measuring Quality of Government and Sub-National Variation. Regional Policy [online]. EC, 2011 [cit. 2013-09-09]. Available from: http://ec.europa. eu/regional_policy/sources/docgener/studies/ pdf/2010_government_1.pdf.
[5] FIORINO, N., GALLI, E., PETRARCA, I. Corruption and Growth: Evidence from the Italian regions. European Journal of
Government and Economics. 2012, Vol. 1, No.
2, pp. 126-144. ISSN 2254-7088.
[6] FRIČ, P. a kol. Korupce na český způsob.
1. vyd. Prague: Nakladatelství G plus G, 1999. ISBN 80-86103-26-9.
[7] HALÁSKOVÁ, M., HALÁSKOVÁ, R. Administrative Territorial Structures in EU Countries and their Specifi cs. Scientifi c Papers of the University of Pardubice, Series D, Faculty of Economics and Administration. 2009, Vol. 15, pp. 62-71. ISBN 978-80-7395-234-1.
[8] HUNTINGTON, S. P. Political Order in
Changing Societes. New Haven: Yale University
Press, 1968. ISBN 0-300-01171-7.
[9] CHMELÍK, J. Pozornost, úplatek a korupce. Prague: Linde Prague, 2003. ISBN 80-7201-434-X.
[10] CHRÁSKA, M. Metody pedagogického
výzkumu. Prague: Grada Publishing, 2007.
ISBN 978-80-247-1369-4.
[11] KAUFMANN, D., KRAAY, A. and MASTRUZZI, M. Governance Matters IV: Governance Indicators for 1996-2004
[online]. [cit. 2014-06-20]. Available from: http://siteresources.worldbank.org/INTRES/ R e s o u r c e s / 4 6 9 2 3 2 - 1 1 0 7 4 4 9 5 1 2 7 6 6 / GovMattersIV_main.pdf.
[12] LEFF, N. H. Economic Development
through Bureaucratic Corruption. Political
Corruption-A Handbook. Iss. 5. New Brunswick:
Transaction Publisher, 1989. ISBN 0-88738-163-4.
[13] LEITE, C., WEIDMANN, J. Does Mother Nature Corrupt – Natural Resources, Corruption
and Economic Growth [online]. Washington:
International Monetary Fund, 1999 [cit. 2014-06-20]. IMF Working Paper No. 85. Available from: http://www.imf.org/external/pubs/ft/ wp/1999/wp9985.pdf.
[14] LIEN, D. H. D. Asymmetric information in competitive bribery games. Economics Letters.
1987, Vol. 23, Iss. 2, pp. 153-156. ISSN 0165-1765. DOI: 10.1016/0165-1765(87)90029-2. [15] LUI, F. T. An Equilibrium Queuing Model of Bribery. Journal of Political Economy. 1985, Vol. 93, Iss. 4, pp. 760-781. ISSN 0022-3808.
[16] MAURO, P. Corruption and Growth.
Quarterly Journal of Economics. 1995, Vol.
110, No. 3, pp. 681-712. ISSN0033-5533. DOI: 10.2307/2946696.
[17] MAURO, P. The Effects of Corruption on Investment, Growth and Government Expenditure [online]. Washington: International Monetary Fund, 1996 [cit. 2014-06-20]. IMF Working Paper No. 98. Available from: http://www. imf.org/external/pubs/ft/wp/1996/wp0098.pdf. [18] MINISTERSTVO VNITRA ČR. Strategie
vlády v boji proti korupci na období let 2013
2014-04-20]. Available from: http://www.mvcr.cz/ clanek/boj-proti-korupci-strategie-vlady-v-boji-proti-korupci.aspx.
[19] MINISTERSTVO VNITRA ČR. Vládní program boje proti korupci [online]. Praha: MVČR, 2006 [cit. 2014-04-18]. Available from: http:// kormoran.vlada.cz/usneseni/usneseni_webtest. nsf/0/37116E873678ACFFC12571B6006D4474. [20] NYE, J. S. Corruption and Political Development: A Cost-Benefi t Analysis. The
American Political Science Review. 1967, Vol.
61, Iss. 2, pp. 417-427. ISSN 0003-0554. DOI: http://dx.doi.org/10.2307/1953254.
[21] POLICIE ČR. Statistické přehledy kriminality [online]. Praha: PČR, 2014 [cit. 2014-05-18]. Available from: http://www.policie.cz/ statistiky-kriminalita.aspx.
[22] SVAZ PRŮMYSLU A DOPRAVY ČR.
Šetření v krajích [online]. SPADČR, 2013 [cit.
2014-04-18]. Available from: http://www.spcr.cz/ ankety/setreni-v-krajich-2013.
[23] TANZI, V., DAVOODI, H. Corruption,
Growth and Public Finances [online].
Washington: International Monetary Fund, 2000 [cit. 2014-06-20]. IMF Working Paper 00/182. Available from: http://www.imf.org/external/ pubs/ft/wp/2000/wp00182.pdf.
[24] TANZI, V., DAVOODI, H. Corruption, Public
Investment, and Growth [online]. Washington:
International Monetary Fund, October 1997 [cit. 2014-06-20]. IMF Working Paper 97/139. Available from: http://www.imf.org/external/ pubs/ft/wp/wp97139.pdf.
[25] TARANTOLA, S., SALTELLI, A. Composite indicators: the art of mixing apples and oranges. Statistisches Bundesamt [online]. 2008 [cit.
2015-03-04]. Available from: http://kolloq. destatis.de/2007/abstr_ueb.htm;%20http:// kolloq.destatis.de/2007/tarantola.pdf. ISSN 1653-8919.
[26] THE QUALITY OF GOVERNMENT INSTITUTE. From Aland to Ankara: European
Quality of Government index [online]
University of Gothenburg, 2013 [cit. 2014-03-09]. Available from: http://www.qog.pol. gu.se/digitalAssets/1455/1455551_2013_11_ charron.pdf. ISSN 1653-8919.
[27] TRANSPARENCY INTERNATIONAL.
Corruption Perceptions Index 2012 [online]. TI, 2013 [cit. 2013-03-07]. Available from: http://cpi. transparency.org/cpi2012/.
[28] VOLEJNÍKOVÁ, J. Transparentnost ekonomického prostředí nových členských států EU a alokace PZI. E+M Ekonomie
a Management. 2006, Vol. 9, Iss. 2, pp. 15-34.
ISSN 1212-3609.
[29] VOLEJNÍKOVÁ, J. Korupce v ekonomické teorii a praxi. Prague: Professional Consulting, 2007. ISBN 978-80-7259-055-1.
Ing. et Ing. Veronika Linhartová, Ph.D. University of Pardubice Faculty of Economics and Administration Institute of Economic Sciences [email protected]
Abstract
QUANTIFYING CORRUPTION AT A SUBNATIONAL LEVEL
Veronika Linhartová, Jolana Volejníková
Regarding the fact that bribery and other methods of corruption are illegal in most countries, their participants try to hide them very carefully and uncovering corruption is often almost impossible. Despite that a high number of specifi c procedures exist nowadays. A common feature of these methods is however that they focus on the corruption rate at the level of countries. Quantifi cation of the corruption rate in smaller regional areas is still a considerably unexplored territory not only in the Czech Republic but also all over the world. Also the defi nition of the potential impacts of corruption or their precise quantifi cation is an area that was investigated only in general level of state. Detailed analysis of corruption still lacks regional dimension. Subnational distinction of a territory in terms of the corruption rate could provide a completely new extension of theories of reasons and consequences of regional disparities. There are several reasons why to focus on this issue. Perhaps the strongest reason is that if corruption is one of the variables that have an effect of reducing economic performance, the elimination of corruption in certain regions may be the key to the elimination of regional economic disparities and thus increase the economic performance of the state.
The main goal of the presented article is formulated in this connection. It consists of a proposal of a methodology for quantifying the corruption rate in individual regions of the Czech Republic. It will be possible to mutually compare individual regions and at the same time defi ne the rate of deviation of a region from “surface” corruption rate in a country. Defi nition of these regional disparities in corruption will be a benefi t mainly for anti-corruption policies of a country.
Key Words: Corruption, region, regional disparities, Transparency International, Corruption
Perception Index.
JEL Classifi cation: D73, H11.