III
UNIV E R
S
I
D
A
D
· C
A RL O S I II ·
DE
M
A D R
ID
:
UNIVERSITY CARLOS III OF MADRID
Department of Telematics Engineering
Master of Science Thesis
Control Theoretic Optimization of 802.11 WLANs:
Implementation and Experimental Evaluation
Author: Andrea Mannocci M.Sc. in Computer Science Engineering
Supervisors: Albert Banchs Roca, Ph.D. Vincenzo Mancuso, Ph.D.
In 802.11 WLANs, the dynamic adaptation of the contention parameters along network condi-tions results in relevant performance improvements. Despite the ability to change these parameters has been available in standard devices for years, no adaptive mechanism using this functionality has been validated in a realistic deployment so far.
In our work, we report our experiences related to the implementation and evaluation of two adaptive algorithms based on control theory, one centralized and one distributed, in a large-scale testbed consisting of eighteen commercial off-the-shelf devices. We conduct extensive measure-ments under non-ideal channel condition, considering the impact of different network scenarios in terms of number of active nodes and traffic generated. We show that both algorithms significantly outperform the standard configuration in terms of total throughput. We also expose the limita-tions inherent to distributed schemes, and demonstrate that the centralized approach substantially improves performance under a broad variety of scenarios, which confirms its suitability for real deployments.
Table of Contents
1 Introduction 1
2 Background 3
2.1 IEEE 802.11 EDCA . . . 3
2.2 Optimal Point of Operation of the WLAN . . . 4
2.3 Centralized Adaptive Control Algorithm . . . 4
2.4 Distributed Adaptive Control Algorithm . . . 6
3 Implementation Details 9 3.1 Implementation Overview . . . 9
3.2 Estimation of pobs . . . 10
3.3 Estimation of pown . . . 10
3.4 Contention Window Update . . . 11
4 Testbed Description and Validation of the Implementation 13 4.1 Testbed Description . . . 13
4.2 Validation of the Algorithms . . . 16
5 Performance Evaluation 18 5.1 UDP Throughput . . . 18
5.2 Impact of SNR on Throughput . . . 20
5.3 Hidden Nodes Scenario . . . 21
5.4 Impact Network Size . . . 21
5.5 TCP Throughput . . . 22
5.6 TCP Transfer Delay . . . 25
6 Related Work 28
7 Conclusions 29
References 30
2.1 Retry flag marking upon collisions. . . 3
2.2 CAC algorithm. . . 5
2.3 DAC algorithm. . . 7
3.1 CAC and DAC implementations. . . 10
4.1 Deployed testbed. . . 14
4.2 SNR of the links between each node and the Access Point. . . 14
4.3 CWminused by four selected nodes and the estimatedpobsandpownwith DAC. . 15
4.4 AnnouncedCWminand observed collision probability with CAC. . . 15
5.1 Total throughput with UDP traffic. . . 19
5.2 Throughput per station with UDP traffic. . . 19
5.3 Throughput obtained vs. SNR. . . 20
5.4 Performance with hidden nodes. . . 21
5.5 Total throughput for different number of stations. . . 23
5.6 Fairness for different number of stations. . . 23
5.7 Total throughput of FTP-like traffic. . . 24
5.8 Throughput per station with FTP-like traffic. . . 24
5.9 TCP delay performances. . . 26
5.10 Upload tranfers duration for the three mechanisms (λ= 1/30s). . . 27
Chapter 1
Introduction
The IEEE 802.11 standard for Wireless LANs [14] has become one of the most commonly used technologies to provide broadband connectivity to the Internet. The default channel access mechanism employed in IEEE 802.11 networks is based on a CSMA/CA scheme, regulated by a set of parameters that determines the aggressiveness of the stations when trying to access the channel. In particular, the contention window (CW) parameter controls the probability that a station defers or transmits a frame once the medium has become idle, and therefore has a key impact on the WLAN performance.
Commercial devices implement a fixedCW configuration, which is known to yield suboptimal performance. Indeed, for a fixedCW, if too many stations contend the collision rate will be very high, while if few stations are backlogged the channel will be underutilized most of the time. This behavior has been analyzed by several works in the literature, e.g. [3], which have shown that adapting theCW to the number of backlogged stations significantly improves performance.
Following the above result, an overwhelming number of solutions have proposed to adapt the 802.11 MAC behavior to the observed network conditions with the goal of maximizing the WLAN performance [8, 20, 12, 16, 24, 23, 17, 22, 2, 6, 7]. However, as we detail in the related work chapter, these previous works suffer from at least one of these two limitations: (i) their performance has not been assessed with real deployments, and therefore lack experi-mental evidences gathered from scenarios with non-ideal channel effects and implementation con-straints [8, 20, 16, 24, 23, 17, 6, 7]; or (ii) they rely on non-standard capabilities, or functionality that is not supported by existing wireless devices, and therefore would require complex modifica-tions to be implemented [8, 12, 16, 22, 2, 6, 7]. Furthermore, most of them are based on heuristics and lack the mathematical foundations to guarantee optimal performance [8, 20, 12, 16, 2].
In this thesis we present our experiences with the implementation of two adaptive algorithms, namely the Centralized Adaptive Control (CAC) [18] and the Distributed Adaptive Control (DAC) [19], both based on a Proportional Integrator (PI) controller that dynamically tunes theCW con-figuration to optimize performance. In contrast to previous proposals, both algorithms are sup-ported by solid theoretical foundations from control theory and can be easily implemented with unmodified existing devices.
We first provide a detailed description of the implementation of our adaptive mechanisms, which run as user space applications and rely on standardized system calls to estimate the con-tention level in the WLAN and adjust theCW configuration of 802.11 stations. We also provide insights into the differences between the theoretical design and the practical implementation of the
algorithms, caused by the inherent limitations of the real devices. Furthermore, we demonstrate the feasibility of utilizing these algorithms with commercial off-the-shelf (COTS) hardware and open-source device drivers.
By conducting exhaustive experiments in a large-scale testbed consisting of 18 devices, we evaluate the performance of our proposals under non-ideal channel effects and different traffic conditions. Additionally, we compare the performance of our algorithms against the default IEEE 802.11 configuration, and identify those scenarios where a network deployment can benefit from using such adaptive algorithms.
Our results confirm that both approaches outperform the standard’s default scheme, improving the performance by up to 50%. Our experiments also reveal that the distributed algorithm suffers from a number of problems with heterogeneous radio links, which are inherent to its distributed nature and the limitations of the wireless interfaces. In contrast, the centralized scheme exhibits remarkable performances under a wide spectrum of network conditions. The conclusions drawn from our analysis prove the feasibility of using adaptive MAC mechanisms in realistic scenarios and provide valuable insights for their design.
Chapter 2
Background
This chapter briefly summarizes the behavior of IEEE 802.11 EDCA mechanisms and the ideas on which the two adaptive protocols implemented and assessed here are based on.
2.1
IEEE 802.11 EDCA
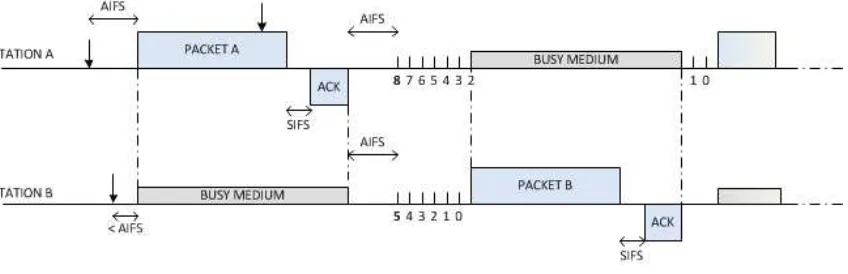
The IEEE 802.11 Enhanced Distributed Channel Access (EDCA) mechanism is a CSMA/CA-based protocol that operates as follows. As depicted in Fig. 2.1, upon the availability of a frame to be transmitted, a station is allowed to send it on air only after having sensed the channel idle for a period of time equal to the arbitration interframe space parameter (AIF S). Otherwise, if the channel is found busy (either immediately or during theAIF Speriod), the station continues to monitor the medium until it is sensed idle for anAIF S interval, and then enters in a backoff process.
Upon starting the backoff process, a station computes a random integer uniformly distributed in the range[0, CW−1], and initializes its backoff time counter with this value. TheCW value is called the contention window, and depends on the number of failed transmission attempts. For the first transmission attempt the minimum contention window (CWmin) is used. In case of a
colli-sion, its value doubles, up to a maximum valueCWmax. The backoff time counter is decremented
once every time slot if the channel is sensed idle and frozen when an ongoing transmission is
de-Figure 2.1: Retry flag marking upon collisions.
tected on the channel. Finally, when the backoff time counter reaches zero, the station transmits its frame in the next time slot.
When two or more stations start transmitting simultaneously, a collision occurs. Acknowledg-ment (ACK) frames are used to notify a transmitting station of successfully received frames. In the case of a failed transmission, the station doubles itsCW and executes the backoff process again. Once a frame has been successfully transmitted or the retry limit has been exceeded,CW is set again toCWmin. To prevent duplicates, the standard provides a retry flagRin order to mark those
frames that are being retransmitted, i.e., the flag is set to 0 on the first transmission attempt, and set to 1 on every subsequent retransmission (see Fig. 2.1). As we discuss later, our algorithms exploit this functionality to infer the network conditions and adapt theCW of the stations accordingly.
To support service differentiation, EDCA implements different access categories (ACs) at ev-ery station, each having a different backoff configuration. The parameters of each AC are an-nounced by the Access Point using the Beacon Frames. In the rest of the tractation we do not consider service differentiation and assume that all stations only execute the Best Effort AC.
2.2
Optimal Point of Operation of the WLAN
Both CAC and DAC share the goal of adjusting theCW to drive the WLAN to the optimal point of operation that maximizes the total throughput given the observed network conditions. Let pdenote the probability that a transmission attempt collides. Following [3], we have shown in [18, 19] that the optimal collision probability in the WLANpoptcan be approximated by
popt≈1−e−
q
2Te
Tc , (2.1)
whereTeis the duration of an idle slot (a PHY layer constant) andTc is the average duration of
a collision. Therefore,popt does not depend on the number of stations, but only on the average
duration of a collision Tc. Given the average length E[L]of the longest packet involved in a
collisions,Tccan be computed using
Tc =TP LCP +
E[L]
C +EIF S.
whereTP LCP is the duration of the Physical Layer Convergence Protocol (PLCP) preamble and
header,Cis the modulation rate andEIF Sis a PHY layer constant.
2.3
Centralized Adaptive Control Algorithm
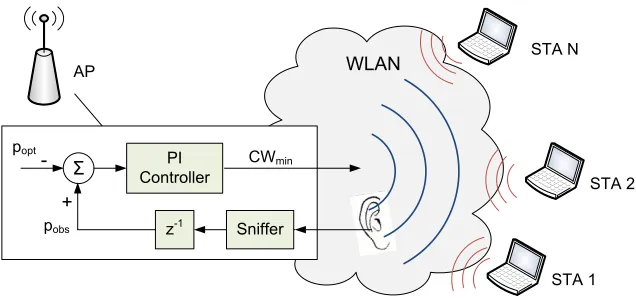
The Centralized Adaptive Control (CAC) algorithm [18], illustrated in Fig. 2.2, is based on a PI controller located at the Access Point (AP). This controller computes the configuration of the CWminparameter, whileCWmaxis set asCWmax= 2mCWminin order to benefit from the
fea-tures of the binary exponential backoff algorithm (withmbeing set as in the default configuration, which ism= 6for IEEE 802.11a).
Following the above, the controller performs two tasks every beacon interval (approx. 100 ms): (i) it estimates the current point of operation of the WLAN as given by the observed collision probabilitypobs, and (ii) based on this estimation andpopt, it computes theCW configuration to
5 Chapter 2. Background WLAN PI Controller Ȉ -popt z-1 pobs + CWmin AP STA 1 STA 2 STA N Sniffer
Figure 2.2: CAC algorithm.
The computation ofpobsis based on the observation of the retry flag of successful frames. Let
us denote byR1(R0) the number of observed frames with the retry bit set (unset) during a beacon interval. Assuming that no frames exceed the retry limit given by theMAX RETRY parameter,1 and that transmissions attempts collide with a constant and independent probability,2the observed probability of a collision in the WLAN can be estimated with (see [18]):
pobs = R1 R0+R1
. (2.2)
The error signalefed into the PI controller to calculate the newCWmin is computed as the
difference between the observed collision probabilitypobsand the target valuepopt:
e=pobs−popt. (2.3)
In this way, when the observed collision probability is above the target value, the error signal will be positive and trigger an increase of theCWmin, and consequently a decrease of the collision
rate in the next beacon interval. Similarly, when the collision probability is below the target value, CWminis decreased in order to increase the activity on the channel.
The {KP, KI}parameters of the PI controller are obtained using the Ziegler-Nichols rules,
to achieve a proper trade-off between stability and speed of reaction to changes, and are given by (see [18] for the details):
KP = p2 0.8
opt(1+poptPm−
1
k=0 (2popt)k)
;
KI = 0.85·p2 0.4
opt(1+poptPmk=0−1(2popt)k) .
(2.4)
The operation of CAC is summarized in Algorithm 1.
1Note that this assumption is accurate as in an optimally configured WLAN the collision probability is very low. 2
Algorithm 1 Centralized Adaptive Control algorithm.
1: while true do
2: repeat
3: if new frame sniffed then
4: retrieve retry flag
5: if retry flag is set then
6: IncrementR1
7: else
8: IncrementR0
9: end if
10: end if
11: until new beacon interval
12: computepobs[t]using (2.2)
13: e[t] =pobs[t]−popt
14: CWmin[t] =CWmin[t−1] +KP ·e[t]+
15: +(KI −KP)·e[t−1]
16: send beacon with newCW configuration
17: end while
2.4
Distributed Adaptive Control Algorithm
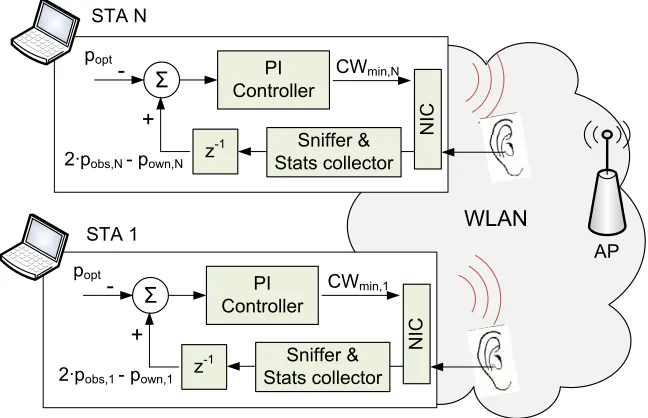
The Distributed Adaptive Control (DAC) algorithm [19] employs an independent PI controller at each station to compute itsCW configuration, to drive the overall collision probability to the target valuepopt. As illustrated in Fig. 2.3, each controller computes theCWmin value employed
by its Network Interface Card (NIC), based on the locally observed network conditions. Similarly to CAC,CWmaxis set asCWmax = 2mCWmin.
While with centralized approaches all stations use the same configuration provided by a single entity, and therefore fairly share the channel, with distributed approaches this is not necessarily the case. To guarantee a fair throughput distribution, the error signal utilized in DAC consists of two terms: one to drive the WLAN to the desired point of operation, and another one to achieve fairness between stations. More specifically, the error signal at stationiis given by
ei =ecollision,i+ef airness,i. (2.5)
The first term of (2.5) ensures that the collision probability in the network is driven to the target value:
ecollision,i=pobs,i−popt, (2.6)
wherepobs,i denotes the collision probability as measured by stationi. When the collision
prob-ability observed by stationiis larger than the target value, the above term yields a positive error that increases theCW of stationi, thereby reducing the collision probability.
The second term of (2.5) is computed as
ef airness,i=pobs,i−pown,i, (2.7)
where pown,i is the collision probability experienced by station i. The purpose of this second
7 Chapter 2. Background
WLAN
PI Controller Ȉ
-popt
z-1 2·pobs,1 - pown,1
+
AP STA 1
STA N
PI Controller Ȉ
-popt
z-1 2·pobs,N - pown,N
+
CWmin,N
N
IC
Sniffer & Stats collector
CWmin,1
N
IC
Sniffer & Stats collector
Figure 2.3: DAC algorithm.
CWmin, the lower the number of collisions caused, and thereby, the lower the observed collision
probabilitypobs,i is. Therefore, a station will increase itsCWminif it experiences less collisions
than the others.
To compute the error signal, each station needs to measure pobs,i andpown,i. The former is
computed aspobsin CAC. For the computation ofpown,i, we rely on the following statistics which
are readily available from wireless cards: the number of successful transmission attemptsT and the number of failed attemptsF. With these statistics,pown,iis computed as:
pown,i =
F
F+T. (2.8)
Each station will estimatepobs,iandpown,iand compute the error signalei, which is provided
to the PI controller for the computation of the newCWmin,i. Like in CAC, we choose to trigger an
update of theCWmin,ievery beacon interval, as this is compatible with existing 802.11 hardware,
which is able to update the EDCA configuration at the beacon frequency.
Although the analysis of DAC, based on multivariable control theory, significantly differs from the analysis of CAC, based on standard control theory, the{KP, KI}parameters that each
Algorithm 2 Distributed Adaptive Control algorithm.
1: while true do
2: repeat
3: if new frame sniffed then
4: retrieve retry flag and
5: incrementR0orR1accordingly
6: end if
7: until beacon received
8: computepobs,iusing (2.2)
9: fetchT andF from driver stats
10: computepown,iusing (2.8)
11: e[t] = 2·pobs,i[t]−pown,i[t]−popt
12: CWmin[t] =CWmin[t−1] +KP ·e[t]+
13: +(KI −KP)·e[t−1]
14: update the localCW configuration
Chapter 3
Implementation Details
A major advantage of CAC and DAC is that they are based on functionalities already available in IEEE 802.11 devices, and therefore can be implemented with COTS hardware. In this chapter, we describe the hardware used in our deployment and the implementation of the functionality required by CAC and DAC.
3.1
Implementation Overview
We have implemented our algorithms using Soekris net4826-48 devices.1 These are low-power, low-costs computers equipped with 233MHz AMD Geode SC1100 CPUs, 2 Mini-PCI sockets, 128 Mbyte SDRAM and 256 Mbyte compact flash circuits for data storage. To accom-modate the installation of current Linux distributions, we have extended the storage capacity of the boards with 2 GB USB drives. As wireless interfaces, we used Atheros AR5414-based 802.11a/b/g devices.
As software platform we installed Gentoo Linux OS (kernel 2.6.24) and the popular MadWifi open-source WLAN driver2 (version v0.9.4), which we modified as follows: (i) we enabled the dynamic setting of the EDCA parameters for the best effort access category, which is in line with the standard specifications but disabled by default in the driver, (ii) we overwrote the drivers’ EDCA values for the best-effort traffic with the standard recommended ones [14], and (iii) for the case of DAC we modified the driver to enable the stations to employ the locally computed EDCA configuration using standardized system calls (as described in Section 3.4). The source code of the modified drivers and our implemented prototypes is available online.3
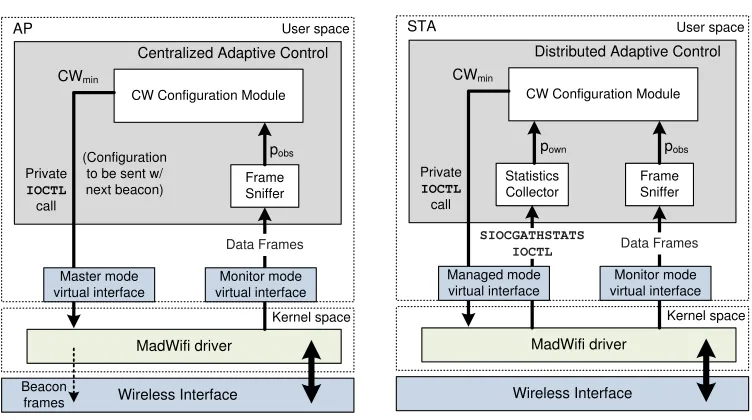
Fig. 3.1 illustrates the main modules of our implementation of CAC and DAC. The algo-rithms do not require introducing modifications to the hardware/firmware nor have tight timing constraints, and therefore they can run as user-space applications that communicate with the driver by means ofIOCTLcalls. We also take advantage of the ability of the MadWifi driver to support multiple virtual devices using different operation modes (master/managed/monitor) with a single physical interface. In the following we detail the implementation of the different modules.
1
http://www.soekris.com/ 2
http://madwifi-project.org/
3http://www.hamilton.ie/ppatras/\#code
Wireless Interface
Kernel space User space
MadWifi driver
Centralized Adaptive Control
Frame Sniffer CW Configuration Module CWmin Private IOCTL call Data Frames pobs Master mode virtual interface Monitor mode virtual interface Wireless Interface Kernel space User space MadWifi driver
Distributed Adaptive Control
Frame Sniffer Statistics
Collector
CW Configuration Module CWmin
Private IOCTL call
SIOCGATHSTATS
IOCTL Data Frames
pobs pown Managed mode virtual interface Monitor mode virtual interface (Configuration
to be sent w/ next beacon)
Beacon frames
STA AP
Figure 3.1: CAC and DAC implementations.
3.2
Estimation of p
obsBoth algorithms require to estimate the collision probability observed in the WLAN. For the case of CAC this is performed only at the AP and results inpobs, while for the case of DAC this is
performed independently at each stationiand results inpobs,i. The estimators are computed with
(2.2), which relies on observing the retry flag of the overheard frames. We next explain how these values are obtained from a practical perspective.
To overhear frames, we utilize a virtual device operating in the so called monitor mode with promiscuous configuration. With this configuration, the device passes all traffic to user-space applications, including frames not addressed to the station. We also configure the device to pass the received frames with full IEEE 802.11 link layer headers, such that the Frame Control field of the frames (where the retry flag resides) can be examined.
With this set-up, the algorithms open arawsocket to the driver, which enables the reception of Layer 2 frames. Through this socket the algorithms listen for transmitted frames and process their headers in an independent thread (the “Frame Sniffer” module of Fig. 3.1). For every observed frame, one of the counters used in the estimation of the collision probability is incremented:R0if the retry flag was unset,R1if the retry flag was set. Every beacon interval the computation ofpobs
orpobs,iusing (2.2) is triggered, and then the counters are reset to zero.
3.3
Estimation of p
ownIn addition to the observed collision probabilitypobs,i, the DAC algorithm requires to estimate
the experienced collision probabilitypown,i. We perform this computation in the “Statistics
config-11 Chapter 3. Implementation Details
ured inmanagedmode, and perform aSIOCGATHSTATS IOCTLrequest. Upon this request, the driver populates anath statsdata structure, which contains detailed information about the transmitted and received frames since the Linux kernel has loaded the driver module. Out of the statistics retrieved, the records that are of particular interest for our implementation are:
• ast tx packets: number of unique frames sent to the transmission interface.
• ast tx noack: number of transmitted frames that do not require ACK.
• ast tx longretry: number of transmission retries of frames larger than the RTS
thresh-old. As we do not use the RTS/CTS mechanisms, this is the total number of retransmissions.
• ast tx xretries: number of frames not transmitted due to exceeding the retry limit,
which is set by theMAX RETRYparameter.
To computepown,i we need to count the number of successful transmissions and the number
of failed attempts. To compute the former, we subtract from the number of unique frames those that are not acknowledged (e.g., management frames) and those that were not delivered,
Successes =ast tx packets − ast tx xretries − ast tx noack.
Similarly, to compute the number of failed attempts, out of the total number of retransmissions we do not count those retransmissions caused by frames that were eventually discarded because the
MAX RETRYlimit was reached, therefore,
Failures =ast tx longretry − ast tx xretries · MAX RETRY.
With the above, the termsF andT of (2.8) used to estimatepown,iare computed as
F[t] = Failures[t] - Failures[t-1], T[t] = Successes[t]- Successes[t-1],
wheretdenotes the time of the current beacon interval andt−1the previous one.
3.4
Contention Window Update
With the estimated collision probabilities, CAC and DAC compute the error signal at the end of a beacon interval according to (2.3) and (2.5), respectively. Depending on this value, the PI controller triggers an update of theCWmin to be used in the next beacon intervalt, according to
the following expression:
CWmin[t] =CWmin[t−1] +KP ·e[t] + (KI −KP)·e[t−1].
To ensure a safeguard against too large and too smallCWmin values we impose lower and
upper bounds for theCWmin. We set these bounds to the defaultCWminDCF andCWmaxDCF values
specified by the standard, which are 16 and 1024, respectively, for IEEE 802.11a [13].
The algorithms assume that the CWmin can take any integer value in the [16,1024]
range. However, with our devices only integer powers of 2 are supported (i.e., CWmin ∈ {16,32, . . . ,1024}). Therefore, the value actually used is obtained as:
whererint(x)is a function that returns the integer value nearest tox.
To commit the computedCWconfiguration, first we retrieve the list of privateIOCTLs sup-ported by the device to search for the call that sets theCWmin. Once this call has been identified,
Chapter 4
Testbed Description and Validation of
the Implementation
In this chapter we first describe our testbed. Then we analyze the link qualities between each node and the AP and show that our set-up is able to mimic a realistic deployment with significant differences in terms of SNR. Finally, we confirm that, despite the constrains imposed by the devices and the realistic radio conditions, both CAC and DAC are able to drive the WLAN to a stable point of operation.
4.1
Testbed Description
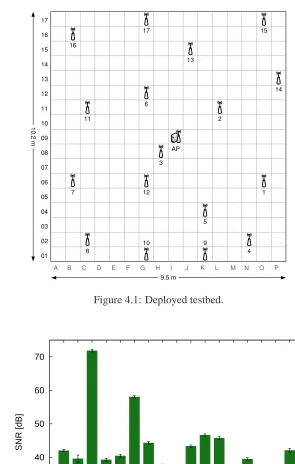
Our testbed is located in the Torres Quevedo building at University Carlos III de Madrid. It consists of 18 devices deployed under the raised floor, a placement that provides physical protec-tion as well as radio shielding to some extent (see [21]).
Fig. 4.1 illustrates the location of the nodes. We placed one node (denoted as AP) towards the center of the testbed, thus following the placement of an Access Point in a realistic deploy-ment, while the other stations (numbered from 1 to 17 in no particular order) are distributed at different distances from this node. All nodes are equipped with 5 dBi omnidirectional antennas and are configured to operate on channel 64 (5.32 GHz) of IEEE 802.11a standard [13], where no other WLANs were detected. All nodes use the 16-QAM modulation and coding scheme, which provides 24 Mbps channel bit rate, as calibration measurements showed that this was the highest rate achievable by the node with the worst link to the AP (node 15). Additionally, we disabled the RTS/CTS, rate adaptation, turbo, fast frame, bursting and unscheduled automatic power save delivery functionality, as well as the antenna diversity scheme for transmission/reception.
17 16 15 14 13 12 11 10 09 08 07 06 05 04 03 02 01
A B C D E F G H I J K L M N O P
8 10 7 AP 3 1 11 6 2 4 9 5 9.5 m 1 0 .2 m 12 13 14 15 16 17
Figure 4.1: Deployed testbed.
20 30 40 50 60 70
1 2 3 4 5 6 7 8 9 10 11 12 13 14 15 16 17
SNR [dB]
Station index
15 Chapter 4. Testbed Description and Validation of the Implementation
0 0.25 0.5 0.75 1
0 5 10 15 20 25 30
Collision probability
time [s]
pown
pobs
popt 16
32 64 128 256
CW
min
CWmin,2
CWmin,3
CWmin,8
CWmin,9
Figure 4.3:CWminused by four selected nodes and the estimatedpobsandpownwith DAC.
0 0.25 0.5 0.75 1
0 5 10 15 20 25 30
Collision probability
time [s]
pobs
popt 16
32 64 128 256
CW
min
Unless otherwise specified, all nodes use the same transmission power level of 17 dBm. Given the node placement of Fig. 4.1, this setting results in very dissimilar link qualities between each station and the AP (e.g., node 3 is extremely close). To confirm this link heterogeneity, we de-signed the following experiment. For a given node, we ran a 10-secondpingtest between the sta-tion and the AP, recording the SNR values of the received frames as obtained by thewireshark packet analyzer1from theradiotapheader.2 This test was performed on a node-by-node basis, and repeated for 18 hours. The average and standard deviation of the SNR for each link are shown in Fig. 4.2.
From the figure we confirm that the use of a fixed power setting in the considered deployment results in very diverse radio links between the AP and the stations. Note that, throughout the reported experiments, we periodically repeated the above measurement in order to confirm that the radio conditions did not change.
4.2
Validation of the Algorithms
Our first set of experiments aims at confirming that the good operation properties of CAC and DAC, obtained analytically and via simulations in [18, 19], are also achieved in a real testbed. Specifically, we want to confirm that the use of the algorithms results in stable behavior despite the described hardware/software limitations and the impairments introduced by the channel con-ditions, and also assess their resource consumption in terms of CPU and memory usage.
Point of operation. We consider a scenario withN = 10stations, constantly backlogged with
1500 B UDP frames, that send data to the AP utilizingiperf.3 For the case of the centralized algorithm (CAC) we log its key variables, namely, theCWannounced in beacon frames and the observed collision probabilitypobs. Both are obtained every 100 ms and depicted in Fig. 4.4.
As the figure shows, CAC drives the WLAN to the desired point of operation. Indeed, the announcedCWoscillates between the two allowed values closest to the optimalCWmin, whilepobs
fluctuates stably around the desiredpopt given by (2.1). We conclude that, despite the hardware
limitations imposed on the values ofCWand the channel impairments, CAC is able to drive the WLAN to the desired point of operation.
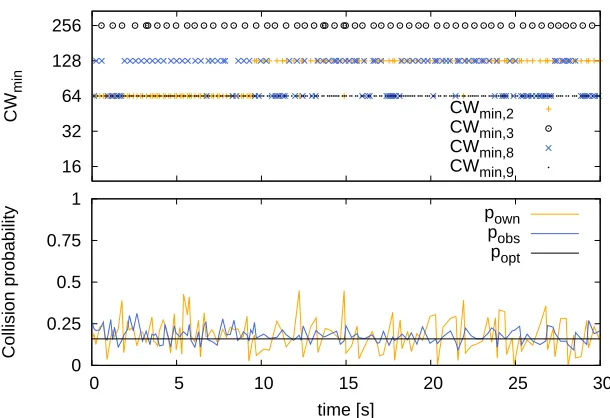
Next we validate the operation of the distributed algorithm (DAC). We consider the same scenario as before, logging the key parameters of the algorithm at each station, namelyCWmin,i,
pown,iandpobs,i. In Fig. 4.3 we depict in the upper subplot the evolution of theCWminused by
four representative nodes (namely 2, 3, 8 and 9), while in the lower subplot we show the collision probabilities estimated by node 2 (pobs,2andpown,2).
From the two subplots we see that DAC also drives the average collision probability in the WLAN to the desired value. However, there is a key difference as compared to the previous case: while with CAC all stations use the sameCWminvalue, with DAC they operate at different
averageCWmin. Indeed, the four stations considered in the experiment use averageCWminvalues
of 92, 300, 92 and 64, respectively. As we will explain in Section 5.2, this behavior is caused by the relative differences in link qualities, already identified above, combined with the inability of the wireless interface to identify the reasons for a packet loss.
1http://wireshark.org
2
With theradiotapoption, the driver provides additional information about received frames to user-space appli-cations, including the signal-to-noise ratio.
17 Chapter 4. Testbed Description and Validation of the Implementation
Performance Evaluation
We next assess the performance of the algorithms under a large number of different scenarios and compare their performance against the default EDCA configuration, which we use as a bench-mark. Each considered experiment runs for 2 minutes and is repeated 10 times to obtain average values of the measured metrics with good statistical significance.
5.1
UDP Throughput
We first measure the achievable throughput between the nodes and the AP when all the stations are transmitting UDP traffic at the same time. Fig. 5.1 plots the average and standard deviation of the total throughput obtained with each mechanism. We observe that the EDCA default configu-ration achieves around 11 Mbps, while the use of DAC and CAC results in a performance gain of approximately 45%. Therefore, we confirm that both approaches, by properly adapting theCW configuration to the number of contending stations, achieve a much higher efficiency.
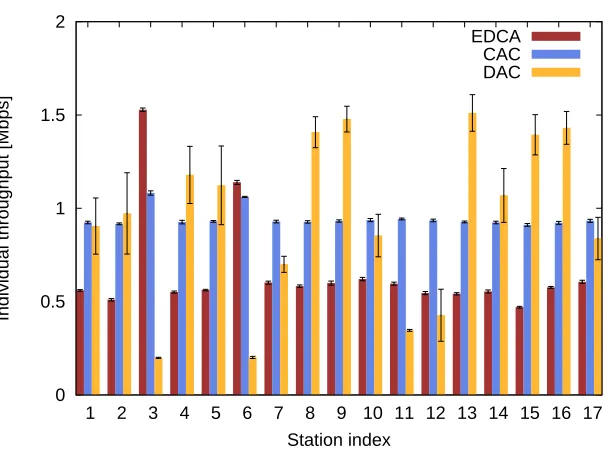
To further examine the performance of the algorithms, we plot the per-station throughput in Fig. 5.2. According to the figure, the use of the EDCA recommended values not only provides the lowest overall throughput figures, but also fails to provide a fair sharing of the available bandwidth. Indeed, it can be seen that, e.g., the node with the best link quality to the AP (node 3) achieves more than three times the throughput obtained by the station with the poorest link (node 15).
While DAC provides a larger total throughput than EDCA, it does not improve the level of fairness. Actually, it results in a somehow opposite performance as the one obtained with EDCA: stations that obtained a relatively large bandwidth with EDCA (e.g., nodes 3, 6) now obtain a relatively small bandwidth with DAC. The use of CAC, on the other hand, provides the best per-formance both in terms of total throughput and fairness, as it provides all stations with very similar throughput values.
To quantify the throughput fairness achieved by the considered mechanisms we compute the Jain’s fairness index (JFI) [15]. The resulting JFI values are 0.865, 0.997 and 0.817 for the case of EDCA, CAC and DAC, respectively. These figures confirm the good fairness properties of CAC, and shows that DAC and EDCA suffer from a higher level of unfairness, a result that we analyze next.
19 Chapter 5. Performance Evaluation
0 5 10 15 20
EDCA CAC DAC
Total throughput [Mbps]
Figure 5.1: Total throughput with UDP traffic.
0 0.5 1 1.5 2
1 2 3 4 5 6 7 8 9 10 11 12 13 14 15 16 17
Individual throughput [Mbps]
Station index
EDCA CAC DAC
0 0.5 1 1.5 2
30 40 50 60 70
Per node throughput [Mbps]
SNR [dB]
EDCA CAC DAC
Figure 5.3: Throughput obtained vs. SNR.
5.2
Impact of SNR on Throughput
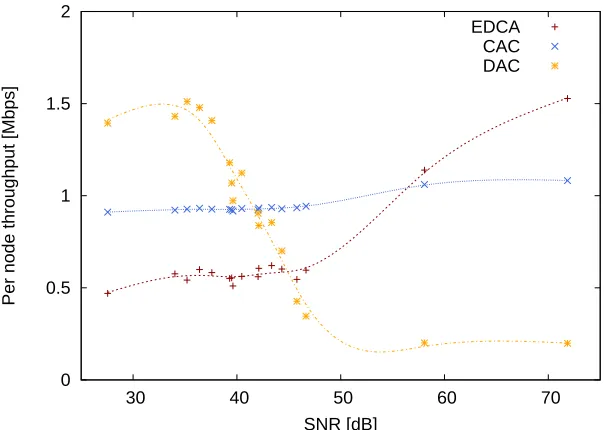
We have seen that link quality impacts the obtained throughput distribution, in particular for EDCA and DAC. To analyze this impact, we plot in Fig. 5.3 the average UDP throughput per station vs. the SNR of the link between the station and the AP. Note that for ease of visualization we also plot natural smoothing splines over the data points.
From the figure we observe that: (i) for EDCA there is a noticeable and positive correlation between SNR and throughput; (ii) for CAC, performance is not much affected by SNR dissimilar-ities, as significantly better link qualities result in very small throughput improvements; (iii) for DAC there is a large and negative correlation between SNR and throughput, with small differences in terms of SNR causing large differences in terms of throughput.
For the case of EDCA, the positive correlation is caused by the capture effect. With this effect, in case of a collision the receiver can decode the packet with the higher SNR. As a result, stations with better link quality obtain higher throughput. In contrast, the use of CAC reduces the number of collisions in the WLAN, and therefore the impact of the capture effect is significantly reduced. For the case of DAC, the negative correlation is also driven by the capture effect as follows. Nodes with high capture probability will experience smaller collision rates than the others, and therefore will havepown,i smaller than pobs,i. This will cause a positive error signal according
to theef airness,iterm in (2.7), which will result in largeCWmin values. Conversely, nodes with
low capture probability will experience largerpown,i values and smallerpobs,iones, and therefore
will have smaller CWmin configurations. In this way, capturing nodes will transmit less often
21 Chapter 5. Performance Evaluation
0 1 2 3 4 5 6
STA #2 STA #8
Throughput [Mbps]
EDCA CAC DAC
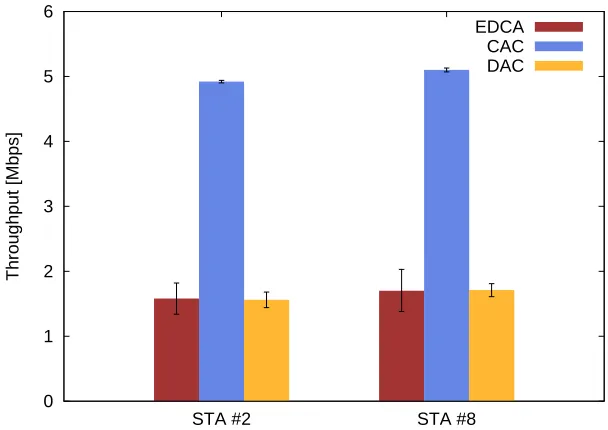
Figure 5.4: Performance with hidden nodes.
5.3
Hidden Nodes Scenario
Our adaptive algorithms have been designed for scenarios where all stations are in radio range of each other and coordinate their transmissions by means of carrier sensing. However, in real deployments hidden nodes may be present, and therefore we want to investigate their behavior under such circumstances.
To this aim, we ran extensive measurements, selecting different topologies and different trans-mission power settings, to determine the most pathological scenario. This is obtained when node 3 acts as AP, and nodes 2 and 8 act as stations, using a transmission power level of 5 dBm. With this setting, each EDCA station transmitting in isolation (i.e., with the other station silent) obtains about 16.3 Mbps of UDP throughput, while if both stations transmit simultaneously the throughput of each one drops to 1.6 Mbps. Thereby we managed to reproduce a hidden node scenario.
We then repeated the experiment with CAC and DAC, and obtained the results depicted in Fig. 5.4. We observe that the use of DAC does not improve performance over EDCA. In contrast, CAC provides a dramatic throughput increase, i.e., more than three times the throughput attained with the other mechanisms. We conclude that CAC detects the large collision rate and commands hidden nodes to be less aggressive by announcing a higherCWmin, which lessens (but does not
eliminate) the hidden node problem. On the other hand, a station running DAC is not able to overhear MAC (re-)transmissions from hidden nodes, and hence cannot correctly estimate the collision probability in the network.
5.4
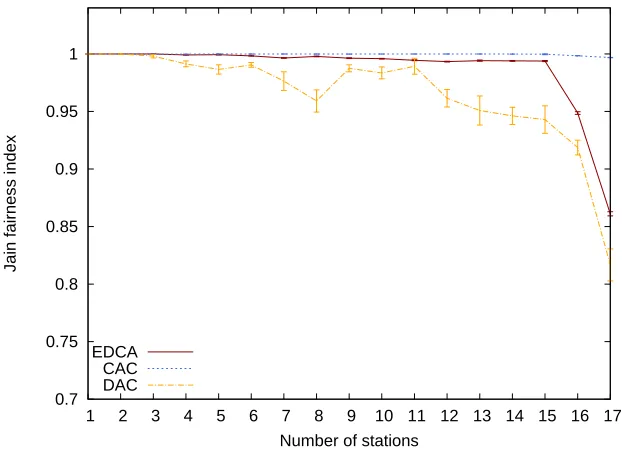
Impact Network Size
adding new stations in ascending order of their link quality. We plot the throughput and fairness results in Fig. 5.5 and Fig. 5.6 respectively.
We observe that for both DAC and CAC the total throughput performance is substantially flat, regardless of the number of stations. This result confirms that both approaches are able to adapt theCW to the number of stations present in the WLAN.
For the case of EDCA, performance degrades with the number of stations, which is the ex-pected result from the use of a fixed set of (relatively small) contention parameters. However, for N >15the total throughput performance slightly grows again, a behavior caused by the capture effect as the last nodes to be added in our experiments are the ones experiencing better link quali-ties (nodes 3 and 6). This is confirmed by the fairness values, as forN >15there is a drop in the JFI for the case of EDCA. JFI values also confirm that DAC is more sensitive to heterogeneous link conditions, as its performance noticeably degrades withN. In contrast, with CAC the fairness index is practically constant for allN values.
5.5
TCP Throughput
We next evaluate performance in a scenarios in which stations use TCP. We start by evaluating the throughput and fairness performance when all stations are constantly backlogged sending TCP traffic to the AP, replicating bulky FTP transfers. Note that this scenario is substantially different from the ones considered in the previous sections, as TCP congestion control1introduces a “closed loop” that can lead to extreme unfairness conditions and even starvation [10].
We plot in Fig. 5.7 the total throughput values for the three mechanisms. According to the results, both CAC and DAC significantly outperform EDCA, improving throughput by 50% and 40%, respectively.
The per-station throughput distribution is depicted in Fig. 5.8. With EDCA, the node with the poorest link quality (node 15) suffers from a large performance degradation, this being worse than in the UDP case (see Fig. 5.1). The use of DAC with TCP traffic also exacerbates the unevenness in the traffic distribution, with node 15 clearly outstanding among the other nodes. DAC results also present a large deviation, caused by relatively frequent TCP timeouts from nodes with weak radio link (e.g., node 15). Conversely, CAC yields a remarkable fair and stable throughput distribution. Like in the UDP case, we compute the JFI values for the resulting throughput distributions. In this case, the values for EDCA, CAC and DAC are 0.787, 0.996 and 0.692, respectively. We conclude that, as expected, the performance of EDCA and DAC worsens with TCP, while CAC preserves its good properties in this scenario.
1
23 Chapter 5. Performance Evaluation
9 10 11 12 13 14 15 16 17 18
1 2 3 4 5 6 7 8 9 10 11 12 13 14 15 16 17
Total throughput [Mbps]
Number of stations EDCA
CAC DAC
Figure 5.5: Total throughput for different number of stations.
0.7 0.75 0.8 0.85 0.9 0.95 1
1 2 3 4 5 6 7 8 9 10 11 12 13 14 15 16 17
Jain fairness index
Number of stations EDCA
CAC DAC
0 5 10 15 20
EDCA CAC DAC
Total throughput [Mbps]
Figure 5.7: Total throughput of FTP-like traffic.
0 0.5 1 1.5 2 2.5 3 3.5 4
1 2 3 4 5 6 7 8 9 10 11 12 13 14 15 16 17
Individual throughput [Mbps]
Station index EDCA
CAC DAC
25 Chapter 5. Performance Evaluation
5.6
TCP Transfer Delay
We finally consider a scenario involving finite-size TCP connections. More specifically, all stations alternate periods of activity—during which a transmission of 10 MB occurs—with silent periods exponentially distributed with mean1/λ [1]. We consider three different values for λ, corresponding to three different levels of activity, namely high, moderate and low. For each case we ran 1-hour experiments, logging all transfer durations and computing the per-station average delay. We use a box-and-whisker diagram to illustrate the distribution of the average delay among nodes: we provide the median, first and third quartiles of the average delay, as well as its maximum and minimum values.
Results are depicted in Fig. 5.9. As shown in Fig. 5.9(a), withλ= 1/30s, which corresponds to high activity, we see that CAC provides the smallest and most uniform distribution of transfer delay among nodes, with practically no difference between the best and worst performing node. In case of EDCA, the delay shows a larger median and higher variability. However, the small distance between the first and third quartiles shows that most of the stations experience similar performance. Finally, for the case of DAC, despite the median is similar to the one of CAC, results show a much larger dispersion.
As can be seen in Fig 5.9(b), when the traffic activity is moderate (λ= 1/60s), the absolute values decrease, but the relative results are similar, i.e., CAC provides again the smallest and most uniform delays among nodes. Finally, as depicted in Fig 5.9(c), when the activity of the nodes is low (λ = 1/90s), medians are very similar, but CAC still provides the most fair distribution of the transfer delays. From these experiments, we conclude that CAC also provides the best performance under dynamic traffic scenarios.
0 100 200 300 400 500 600 700
Transfer time [s]
EDCA CAC DAC
(a) λ= 1/30s
0 100 200 300
Transfer time [s]
EDCA CAC DAC
(b)λ= 1/60s
0 10 20 30 40 50 60
Transfer time [s]
EDCA CAC DAC
(c) λ= 1/90s
27 Chapter 5. Performance Evaluation 1 2 3 4 5 6 7 8 9 10 11 12 13 14 15 16 17
0 500 1000 1500 2000 2500 3000 3500
Station ID time [s] 25 22 44 21 23 38 22 25 23 22 25 22 25 19 10 24 24 # uploads (a) EDCA 1 2 3 4 5 6 7 8 9 10 11 12 13 14 15 16 17
0 500 1000 1500 2000 2500 3000 3500
Station ID time [s] 33 34 38 38 37 37 37 33 35 36 33 37 32 38 36 36 36 # uploads (b) CAC 1 2 3 4 5 6 7 8 9 10 11 12 13 14 15 16 17
0 500 1000 1500 2000 2500 3000 3500
Station ID time [s] 37 52 4 41 30 4 33 25 46 59 20 14 29 29 61 56 20 # uploads (c) DAC
Related Work
The scientific literature offers many examples of MAC optimization approaches. Many of them are based on a centralized entity, responsible for monitoring system performance and adapt-ing the system parameters to current conditions. Other works focus on distributed approaches to adapt MAC parameters. Very little experimental work is available, and it is based on complex algorithms, non-standard functionality and small-sized networks. In the following we review the most significant contributions in each of these areas and describe the novelty of our work.
Centralized approaches. A significant number of approaches exists in the literature [16, 8, 18, 22] that use a single node to compute the set of MAC parameters to be used in the WLAN. With the exception of our CAC algorithm [18], the main drawbacks of these approaches are that they are either based on heuristics, thereby lacking analytical support for providing performance guarantees [16, 8], or they do not consider the dynamics of the WLAN under realistic scenarios [22].
Distributed approaches. Several works [24, 17, 4, 5, 12] have proposed mechanisms that independently adjust the backoff operation of each stations in the WLAN. The main disadvantages of these approaches are that they change the rules of the IEEE 802.11 standard and therefore require introducing significant hardware or firm-ware modifications.
Implementation experiences. Very few schemes to optimize WLAN performance have been developed in practice [22, 9, 2]. While the idea behind Idle Sense [12] is fairly simple, its im-plementation [9] entails a significant level of complexity, introducing tight timing constrains that require programming at the firmware level. The same limitation holds for the approach of [2], which introduces changes to the MAC protocol that require redesigning of the whole NIC imple-mentation. Finally, the work of [22] does not propose or evaluate any adaptive algorithm to adapt the CW but just evaluates the performance of static configurations. Additionally, all of these works rely on testbeds substantially smaller than ours.
Chapter 7
Conclusions
In this thesis, we prototyped two adaptive mechanisms capable of tuning the contention win-dow along the network conditions. In contrast to other proposals which require complex mod-ifications, these mechanisms rely on standard functionalities already supported by COTS hard-ware/firmware, and do not introduce any extension to the IEEE 802.11 MAC. We extensively evaluated the performances of the two mechanisms in a 18-nodes testbed, considering a wide spectrum of network conditions. With our experimental study we identified the key limitations of the distributed scheme, inherent to realistic scenarios, and we confirmed that the centralized mechanism significantly improves network throughput, transfer delay and fairness under a broad variety of circumstances, including the pathological case of hidden nodes.
A major conclusion from our work is that, by simply adding a few lines of code at the AP to exploit the functionality readily available, we can achieve performance improvements of up to 50%. We do believe that the results drawn herein advocate a widespread adoption of the central-ized mechanism. Finally, we also think that a centralcentral-ized scheme should be adopted for future proposals design, while a distributed approach is nothing but a necessary fallback for those cases in which any node has a centralized and complete view of the network.
[1] P. Barford and M. E. Crovella. Generating representative web workloads for network and server performance evaluation. In Proceedings of ACM SIGMETRICS, pages 151–169, 1998.
[2] R. Bernasconi, S. Giordano, A. Puiatti, R. Bruno, and E. Gregori. Design and Implementa-tion of an Enhanced 802.11 MAC Architecture for Single-Hop Wireless Networks. EURASIP Journal on Wireless Communications and Networking, 2007.
[3] G. Bianchi. Performance analysis of the IEEE 802.11 distributed coordination function. IEEE Journal on Selected Areas in Communications, 18(3):535–547, Mar 2000.
[4] L. Bononi, M. Conti, and E. Gregori. Runtime optimization of ieee 802.11 wireless lans performance. IEEE Transactions on Parallel and Distributed Systems, 15(1):66–80, Jan. 2004.
[5] F. Cali, M. Conti, and E. Gregori. IEEE 802.11 protocol: design and performance evaluation of an adaptive backoff mechanism. IEEE Journal on Selected Areas in Communications, 18(9):1774–1786, Sept. 2000.
[6] L. Chen, S. H. Low, and J. C. Doyle. Joint congestion control and media access control design for wireless ad hoc networks. In Proc. IEEE INFOCOM, Miami, Florida, march 2005.
[7] L. Chen, S. H. Low, and J. C. Doyle. Random access game and medium access control desig. IEEE Transactions on Networking, 18(4):1063–6692, dec. 2010.
[8] J. Freitag, N. L. S. da Fonseca, and J. F. de Rezende. Tuning of 802.11e Network Parameters. IEEE Communications Letters, 10(8):611–613, 2006.
[9] Y. Grunenberger, M. Heusse, F. Rousseau, and A. Duda. Experience with an implementation of the Idle Sense wireless access method. In Proceedings of the ACM CoNEXT conference, pages 1–12, New York, New York, 2007.
[10] O. Gurewitz, V. Mancuso, J. Shi, and E. Knightly. Measurement and modeling of the origins of starvation of congestion-controlled flows in wireless mesh networks. IEEE Transactions on Networking, 17(6), dec. 2009.
[11] S. Ha, I. Rhee, and L. Xu. CUBIC: a new TCP-friendly high-speed TCP variant. ACM SIGOPS Operating Systems Review, 42:64–74, July 2008.
31 REFERENCES
[12] M. Heusse, F. Rousseau, R. Guillier, and A. Duda. Idle sense: an optimal access method for high throughput and fairness in rate diverse wireless LANs. In Proc. ACM SIGCOMM, pages 121–132, Philadelphia, PA, USA, 2005.
[13] IEEE 802.11. Supplement to Wireless LAN Medium Access Control and Physical Layer specifications: high-speed physical layer in the 5 GHz band. IEEE Std 802.11a, 1999.
[14] IEEE 802.11. Wireless LAN Medium Access Control (MAC) and Physical Layer (PHY) Specifications. Revision of IEEE Std 802.11-1999, 2007.
[15] R. Jain, Chiu, D.M., and W. Hawe. A Quantitative Measure of Fairness and Discrimination for Resource Allocation in Shared Systems. DEC Research Report TR-301, 1984.
[16] A. Nafaa, A. Ksentini, A. A. Mehaoua, B. Ishibashi, Y. Iraqi, and R. Boutaba. Sliding Con-tention Window (SCW): Towards Backoff Range-Based Service Differentiation over IEEE 802.11 Wireless LAN Networks. IEEE Network, 19(4):45–51, Jul 2005.
[17] Q. Ni, I. Aad, C. Barakat, and T. Turletti. Modeling and Analysis of Slow CW Decrease for IEEE 802.11 WLAN. In Proc. IEEE Personal, Indoor, and Mobile Radio Communications Conference (PIMRC), Beijing, 2003.
[18] P. Patras, A. Banchs, and P. Serrano. A Control Theoretic Approach for Throughput Opti-mization in IEEE 802.11e EDCA WLANs. Mobile Networks and Applications (MONET), 14(6):697–708, Dec 2009.
[19] P. Patras, A. Banchs, P. Serrano, and A. Azcorra. A Control Theoretic Approach to Dis-tributed Optimal Configuration of 802.11 WLANs. IEEE Transactions on Mobile Comput-ing, 10(6):897–910, Jun 2011.
[20] L. Scalia, I. Tinnirello, J. Tantra, and C. H. Foh. Dynamic MAC Parameters Configuration for Performance Optimization in 802.11e Networks. In Proc. GLOBECOM, pages 1–6, San Francisco, CA, USA, Dec 2006.
[21] P. Serrano, C. J. Bernardos, A. de la Oliva, A. Banchs, I. Soto, and M. Zink. FloorNet: Deployment and Evaluation of a Multihop Wireless 802.11 Testbed. EURASIP Journal on Wireless Communications and Networking, 2010.
[22] V. A. Siris and G. Stamatakis. Optimal CWmin selection for achieving proportional fairness in multi-rate 802.11e WLANs: test-bed implementation and evaluation. In Proceedings of the 1st international workshop on Wireless network testbeds, experimental evaluation & characterization, pages 41–48, Los Angeles, CA, USA, 2006.
[23] Q. Xia and M. Hamdi. Contention Window Adjustment for IEEE 802.11 WLANs: A Control-Theoretic Approach. In Proc. International Conference on Computer Communi-cations (ICC), Istanbul, Turkey, Jun 2006.