IJEDR1802009
International Journal of Engineering Development and Research (
www.ijedr.org
)
52
Technique for Interactive Visualization of Large
Flow Data Set of CFD Simulation
1Renu Singh, 2Dr. S. P. Pandey
1Research Scholar, Department of Mathematics, Singhania University, Rajasthan, 2Head, Department of Mathematics , BDIT, Ghaziabad, U.P
_____________________________________________________________________________________________________
Abstract - The Modern computational fluid dynamics simulations that simulate fluid flow in detail. Output data sets, these simulations are very large and informative. The Data visualization was clearly recognized in the presentation and data set. In order to gain new insights of the current nature, interactive visualization methods are essential. Our goal is to develop a fluid dynamics expert to analyze the environment of very large flow fields. This article stimulated the need for an interactive visual environment. In the design environment, building around two basic beliefs like First, the environment should be read in conjunction with modeling and visualization. Second, interactive visualization is necessary and this exploration is exciting. We discuss two interactive visualization methods and apply them to the flow field of direct numerical simulation. In our opinion, we talk about the working method in this article, which is a typical future visualization environment.
Keywords: CFD, Interactive Scientific Visualization, visualization procedure, high performance computing, direct numerical simulation
____________________________________________________________________________________________
1. Introduction of Data Visualization
The Data visualization has been clearly recognized in scientific calculations. The simulation results show that the exploration of large data sets and the interactive guidance of the demand for certain components in the visualization. However, these requirements are imposed on modern large-scale computational fluid dynamics simulations of today's visual system with serious limitations of Computational Fluid Dynamics (CFD) modeling to accurately simulate fluid flow. The resulting data set, this simulation is very large and informative this trend will continue as a solution to the problem, the higher the number, the higher the resolution. It is impossible to solve these problems because your computer has become more powerful and numerical solvers are improving. An effective visualization technique for large dataset analysis.
The image is displayed around a square cylinder; one can clearly see that the turbine is in the rear cylinder. The Fluid dynamics experts want to know more about the transition of turbulence. The Traditional visualization methods are not suitable for analyzing these phenomena from such a large and detailed data set to need more advanced visualization and data management methods.
2. Demanding of Flow Visualization
The goal of our work is to develop a fluid dynamics expert to analyze the visual environment of a very large flow field. In the design environment, around two basic beliefs: First, the environment should be read together with modeling and visualization. Finally, we assume that visualization will become an integral part of the entire process, namely the modeling of complex movements. Second, interactive visualization is very important to explore these data sets. Interaction is necessary. This is not a priori aware of this phenomenon of interest. The implementation environment involves several aspects, including high-performance computing technologies, including advanced data display and navigation technology support, efficient data management, high-bandwidth parallel input/output, scalable distributed visualization technology, and convergence of new display technologies.
This article inspires and explains how to apply our visual environment to flow analysis an important consideration is a process visualization environment, a collection of visualization methods, and the effectiveness of these methods. Issues related to user interaction are equally important, especially for large data sets architect systems analyze the 3D flow field as described before and perform large-scale CFD simulations on a large amount of information
3. Flow Observable Fact
Although the data set contains only values such as speed and pressure, flow experts are interested in the phenomenon of flow at higher levels, such as flow separation, reattachment, vortex formation, and the like trying to extract these methods the phenomenon from the data. The difficulty is that these phenomena themselves are not well understood Extracted and Showing these phenomena from the underlying data in the required details is still an unresolved issue.
3.1 Dimension Level
The area of circulation is characterized by a wide range of flow patterns at different temporal and spatial scales. In advanced simulations, the pattern size can vary by three orders of magnitude. The visualization method should be able to handle these different levels of scale.
3.2 Advanced Visualization Technology Level
IJEDR1802009
International Journal of Engineering Development and Research (
www.ijedr.org
)
53
visualization techniques are needed. The management philosophy that led to the development of all visualization technologies is that in the analysis process, users begin to perform global review of data at a relatively low level, and continue to advance to higher level concepts. There are two ways to solve this problem
3.3 Texture Based Visualization Technique
The texture-based visualization method maps vector fields to textures. The main advantage compared to other flow visualization techniques is that the texture can provide a continuous view of the field opposite to the visualization in discrete locations, such as Use arrows to draw or simplify. The visual effect of the direction in the texture is achieved by the line structure in the direction Vector field. These lines are the result of the consistency between adjacent pixels in the texture. In consistency the texture in the direction of the vector field will be higher than in other directions.
4. High Performance Computing Based Visualization Technique
The role of high-performance computing and advanced CFD simulation networks can generate several gigabytes of data. High-performance computing and networks play an important role in providing near-real-time response and processing these data sets. Interactive response time is critical when you need to explore data sets. Two High Performance Computing Related Issues to Consider
4.1. Data Movement Technology
Distributed computing allows separate visual computing and storage resources in the resource file. Although allocation provides an intuitive map of machine resources, it is not without cost. The performance of these systems largely depends on the system's ability to transfer large amounts of data visualization tools. These tools must be designed to effectively handle data management and utilize high-bandwidth parallel input/output.
4.2 Visualization Technology
To Continuous visualization techniques are not sufficient to provide very large data sets. Technology should be designed to perform parallel machines and must be extended to the size of the data set. Another problem is when a single data set is larger than the main memory capacity. Unfortunately, most of the vision
5. Technique for High Performance Visualization
In this section, we will briefly discuss the two visualization technology. These can be used as a plug-in technology that can be used to explore a large number of flows.
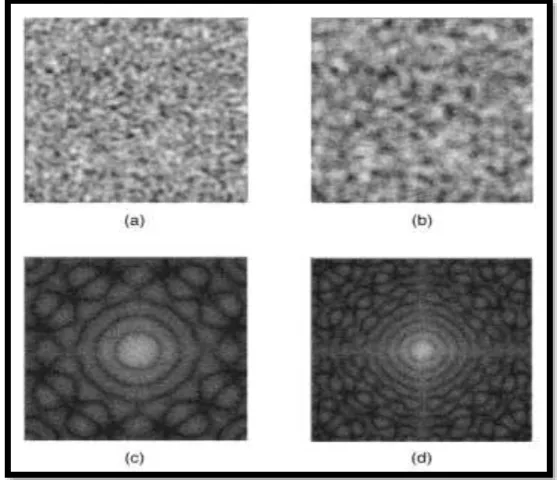
Interactive point noise is noise is a texture synthesis technology that can be used to present a comprehensive understanding of the field. In the spot noise small icon, known as the zebra crossing, deformed, in accordance with the underlying data is used to display a Flow field. If you have a lot of attractions are also used to indicate the flow of various attractions will no longer be able to see and texture is considered instead. This is shown in Figure 1. One point noise texture is characterized by a scalar function f position x. It is defined as:
For one hour (x) is the name of the function. This is a function of zero, in addition to an area that is small compared to the size of the texture. ai Is a random scaling factor is zero, xi it is meant to be a random location. The random spots on the strength of the drawing and mixed together in a random location on a flat surface.
Figure 1: ShowingSpot and Generated Textures
IJEDR1802009
International Journal of Engineering Development and Research (
www.ijedr.org
)
54
The high quality of the generation speed can be used to interactively adjust the speckle noise parameters to highlight certain aspects of the work process or to amplify the details of the process. In addition, time-related animation traffic is dynamically generated.
5.1The interactive hierarchical topological
Vector field topology describes helman. It provides basic information about the use of areas of inflow at critical points, and this is simplified. The key point is that one point in the velocity vector is equal to zero Points where these media do not move can be divided into behavior-based traffic that is close to it. For this type of velocity gradient tensor characteristic values. The Jacobian velocity gradient tensor is defined as following.
In this way the cursor indicates that the portion of the derivative financial instruments. Based on these two may be complicated by the eigen value, five different cases, horse riding, the imaginary part is zero and the actual part has the opposite sign. Click the check node, the imaginary part is zero and the real parts are positive. Attracting node, the imaginary part is zero and the real part is negative. Click the back focus, the imaginary part is a non-zero real part are positive. To attract the focus, the imaginary part is a non-zero real part is negative. If true, the eigenvalues to zero, the key point is that the type of higher order terms of the approximate value of the flow of traffic in the neighborhood.
Figure 2: ShowingDifferent Types of Critical Points
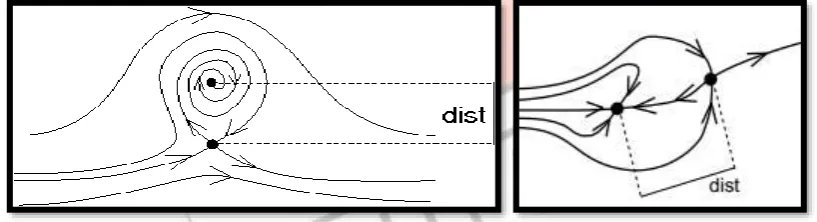
In the process, some of the key points can be very large. 500 critical points of a single slice are not unusual. In addition, some of the key points may be different, as time went by very quickly. Many of the key point were caused by flow control and, to a lesser time and spatial scales. This is not only expensive, but also clutters display distracting attention from the main structure of the flow.
Figure 3: ShowingDifferent Types of Critical Points Pairs
A large number of key points are only a local effect on circulation. The global structure is determined by a few critical points. The critical point is based on the current regional associated with the source and receiver type of key points. This method proved to be too slow, interactively with a great deal of time-related data sets. We want to limit the number of threshold; it will be shown for those who are interested in a certain degree of scale in the interactive speed. To achieve this goal, we have three strategies. Each policy is controlled by a parameter that assigns a weight factor, all the key points. Through the interaction of different parameters, the user can manipulate some of the key points are displayed.
1. Sub sampling data: a large structure is not limited to a few cell data. By looking at key points of data, which is a sub sampled in the Flow Control feature, in a broader context will be
2. The Persistence: The key point of the pop-up window for a time, through the traffic, and will disappear. By keeping track of key points with the passage of time, life time to determine. This strategy can be achieved through a vision of the buffer to store the number of time steps. The control parameter is the smallest of the life cycle of a key point. 3. The Data management with a common architecture has been emphasized in the context of flexible data management
IJEDR1802009
International Journal of Engineering Development and Research (
www.ijedr.org
)
55
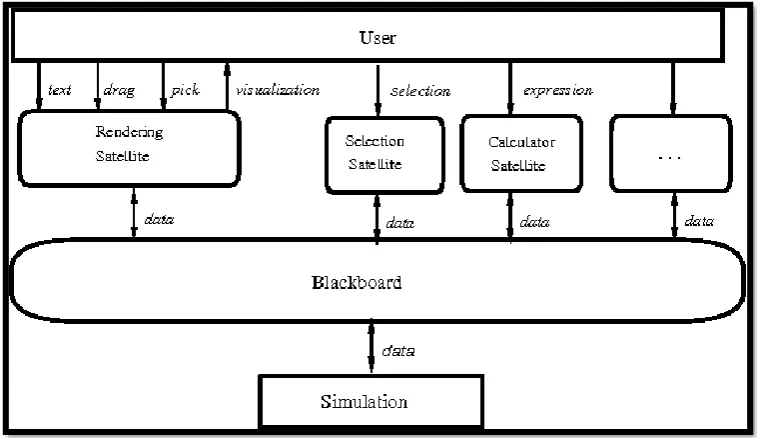
Figure 4: Showing Distributed Blackboard ArchitectureIts purpose is to divide the data manager into two parts. First, it allows you to manage variable databases. Processes can create, open, close, read, and write variables. Second, the data manager is part of the event notification manager. Processes can subscribe to status changes in data management. When this state changes, the process will receive a notification from the data manager. For example, a process that subscribes to a mutation event on a specific variable data manager will be notified whenever the process variable value changes. Figure 4 shows a sample configuration. This configuration includes two data management via network connection and four visualization processes: renderer, data slicer, calculator, card reader and data. The user interacts visually or enters text with pick/drag geometries. The process for data management exchanges data for reading and writing variables. Data management is consistent. Many other processes can be attached to data management. There are many different advantages of how to handle this task related to architecture data management. First, data management, data storage, and efficient local shared memory processes. Second, data flow is effective. Processes reading and writing data in parallel from the data manager. In addition, readers can perform parallel input/output to disk. Third, the data of mobile data can only be conducted in the context of manager's needs, so as to minimize the data volume of the entire network.
6. Direct Numerical Simulation of Turbulence
The Problems and data sets verstappen, veldman, to discuss ways to direct numerical simulation (DNS) of the turbulence. DNS is the most accurate, but it is also the most expensive way to calculate the turbulence. In this particular case the DNS of turbulent flow around a rectangular cylinder, then to zero = 22,000 (angle of attack) has been performed. Of particular interest are the detailed visualization of vortex formation and the transition of the turbulence. Current expert would like to use visualization as a tool to test assumptions about the flow phenomena and After a detailed examination of the animation - as a means of introducing new hypotheses.
As a result , the visualization of the aim is to make the interactive and detailed animation, this data set. In contrast, pre-recorded video clips, interactive animations, and the user can repeatedly to select the visual mapping, and then play the part of the data set.
Figure 5: Showing Three global perspectives Spot noise square cylinder
IJEDR1802009
International Journal of Engineering Development and Research (
www.ijedr.org
)
56
traffic and contains all the data. In the upper right corner of the image is displayed in the topology. A complete set of key points, as shown in the figure. The small color icons are used to represent a set of key points: a spiral-shaped yellow icon indicates that a focus, a blue cross said a saddle stitch points and cyan/magenta indicates that the disks back/attract nodes. The red simplifies the icon for the connection.The environment is to generate the images in an interactive, thus enabling the animation on the fly. This includes the read data from the disk, transfer of data visualization engine, map the data to the geometry, and that the final image. Evaluation of the application visible benefit, value-added of interactive Flow Visualization environments. This data set contains a wealth of detailed information. Interaction is necessary, because it is not an a priori known what aspects of traffic are very important.The combination of the spot noise and current topology technology provides a more in-depth understanding, it is very difficult to obtain, and only one method is used. Through the use of traditional Topology Visualization Methods, these data sets, excessive cluttering inevitable. Using a layered approach, a simplified view of the topology can be obtained without cluttering. In addition, as a result of interactive zoom), topology information can be obtained at various levels.
7. Conclusions
This article inspired the need for an interactive visual environment for 3D flow analysis. In the design environment, building around two basic beliefs: First, the environment should be read in conjunction with modeling and visualization. Finally, we assume that visualization will become an integral part of the entire process, namely the modeling of complex movements. Second, interactive visualization is crucial to gaining new insights into the nature of traffic.
The High-performance computing plays an important role in process visualization. First of all, because simulation traffic is becoming more detailed and advanced visualization methods, you need to include this information in the database. Second, in order to transmit data visualization pipelines at a constant rate, very large data sets are managed to efficiently use high-bandwidth networks and parallel input /output.
The implementation of two visualization techniques has been discussed point noise and hierarchical flow topology both of these techniques are well suited for big data sets. The interactive use of these technologies, especially in scaling, makes it a useful exploration. Although there is still a lot of work to be done in a 3D environment, we believe that this approach discussed in this article is useful for the design of future visualization environments.
References
[1] P.R. Woodward. Interactive Scientific Visualization of Fluid Flow. IEEE Computer, 13–25, October 2013.
[2] J.J. van Wijk, A.J.S. Hin, W.C. de Leeuw, and F.H. Post. Three Ways to Show 3D Fluid Flows. IEEE Computer
Graphics & Applications, 33–39, September -2014.
[3] L. Hesselink and T. Delmarcelle. Visualization of Vector And Tensor Data Sets. In L.J.
[4] Rosenblum et al., editors, Scientific Visualization: Advances and Challenges, pages 415–423. Academic press, 2015. [5] B. Cabral and L. Leedom. Imaging vector Fields Using Line Integral Convolution. Computer Graphics (SIGGRAPH
’2013 Proceedings), 263–272.
[6] J.L. Helman and L. Hesselink. Visualizing Vector Field Topology in Fluid Flows. IEEE Computer Graphics and
Applications, 38–48, May 2011.
[7] D. Silver, N. Zabusky, V. Fernandez, and M. Gao. Ellipsoidal Quantification of Evolving Phenomena. In Scientific
Visualization of Physical Phenomena, pages 563–578. Springer Verlag, 2011.
[8] M.B. Cox and D. Ellsworth. Application-Controlled Demand Paging For Out-Of-Core Visualization. In R. Yagel and H. Hagen, editors, Proceedings Visualization ’2017, pages 239–264. IEEE Computer Society Press, 2017.
[9] W.C. de Leeuw and R. van Liere. Divide And Conquer Spot Noise. In Proceedings Super Computing ’2017 .
[10] W.C. de Leeuw and R. van Liere. Collapsing Flow Topology Using Area Metrics. In D. Ebert, M. Gross, and B. Hamann, editors, Proceedings Visualization ’2009, pages 338–348. IEEE Computer Society Press, 2009.
[11] Nielson, H. Muller and H. Hagen, editors, Scientific Visualization: Overviews, Methodologies, and Techniques, 2016. [12] 12. R. van Liere, J.A. Harkes, and W.C. de Leeuw. Distributed blackboard architecture for interactive data