Published online October 20, 2014 (http://www.sciencepublishinggroup.com/j/ijepe) doi: 10.11648/j.ijepe.s.2014030601.13
ISSN: 2326-957X (Print); ISSN: 2326-960X (Online)
Evaluation on the blackout consequences of different
fault objects in distribution network based on AHP and
improved GCDM model
Na-na Li, Hui-ru Zhao
School of Economics and Management, North China Electric Power University, Beijing, 102206, China
Email address:
[email protected] (Na-na Li)
To cite this article:
Na-na Li, Hui-ru Zhao. Evaluation on the Blackout Consequences of Different Fault Objects in Distribution Network Based on AHP and Improved GCDM Model. International Journal of Energy and Power Engineering. Special Issue: Electricity Demand Characteristic. Vol. 3, No. 6-1, 2014, pp. 13-18. doi: 10.11648/j.ijepe.s.2014030601.13
Abstract:
In order to estimate and evaluate the blackout consequence in distribution network, a comprehensive evaluation index system including seven indexes was built, in which the blackouts loss for both users and power companies are fully considered. A comprehensive evaluation model based on AHP and improved grey clustering decision model was provided to evaluate the blackout consequence of different fault objects in distribution network. The improved GCDM model which can overcome the limitations of traditional whiten function, clustered different evaluation indexes and improved utilization of information and evaluation result. Finally, taking a distribution network as numerical example, AHP and improved GCDM model was implemented to evaluate and analyze the blackout consequences of different objects in distribution network. The results screen the differences in blackout consequence degree of fault objects effectively, indicating that this evaluation model is feasible and evaluation result can be referenced for power companies.Keywords:
Evaluation of Blackout Consequence, Improved Grey Clustering Decision Model, Analytic Hierarchy Process1. Introduction
It is a key target for power enterprise to provide users safe, economical, reliable and high-quality electricity. However, in the process of actual operation, the shortage or outage of power supply causes a great deal of losses to the national economy as well as people’s daily lives. Statistics show that, among the different reasons cause power outage, the distribution network fault has the greatest impact on the reliability of power supply which nearly accounts for 80% [1]. Therefore, it is quite crucial to study the impacts of distribution network fault, which has great significance for the evaluation and optimization of power system reliability and the rational planning of distribution network.
A lot of researches of the distribution network fault are mainly on the consequence analysis of users’ power failure consequences, and many evaluation models have been put forward. Through visiting to important power users who face short-term power loss, Xu Xiao et al has proposed a short power loss function to evaluate the loss of power failure of distribution network. Li Tianyou et al has
constructed power customer interruption cost functions (PCICF) and Interrupted Energy Assessment Rate (IEAR) and put forward two methods on power loss estimation, and the feasibilities have been proved by practices. Li Rui et al realized the estimation for losses of significant power users through power loss model under the load point power outage cost assessment rate. Based on the analysis about the working mechanism of the main feeder disconnect switches, Wan Guanquan et al put forward the users’ power loss calculation model which considered the facultative switch settings and the feeder automation. Taking the uncertainty influences of power loss between different users into consideration, Aaron J et al proposed an assessment method for blackout consequences based on the investigation and Monte Carlo simulation. Chun-Lien Su et al showed the relationships among power loss, feeder topology, customer type, maintain time and recovery time through the formula method. In addition, a DA system for economic analysis aim at expressly estimate of power loss has been provided.
the user's power loss without taking the influences of power company tariff revenue, power supply units, corporate brand value and other aspects into account [7]. The fault equipment in distribution network can be divided into different types. In this paper, they are subdivided into five categories, which are on-pole transformer, pole equipment, cable lines, overhead lines and station equipment. Simultaneously, the consequences of blackout of these five kinds of equipment would be analyzed.
For a scientific blackout consequence evaluation of different fault objects, firstly, a comprehensive and scientific evaluation index system for blackout consequences in distribution network has been constructed which comprehensively overcame the one-sidedness of the previous studies; then AHP method is introduced to determine the index weight according to the correlation between indexes. The grey clustering decision model can cluster different objects to be evaluated and the improved exponential whitened function can overcome the shortcomings of traditional gray triangle whiten function. Therefore, a new comprehensive evaluation model based on AHP and improved gray decision model is constructed to evaluate the blackout consequence of fault objects in distribution network. Through computing the integrated clustering coefficient of the blackout consequences of different fault objects, the level of blackout consequences of different fault objects can be scientifically reflected, which can provide reference for the power distribution companies in improving power grid reliability and lowering the effect level of power failures.
2. The Establishment of Evaluation
Index System on the Blackout
Consequences in Distribution
Network
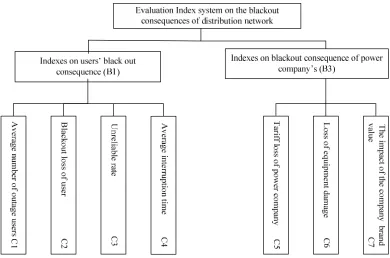
The evaluation on the blackout consequences of different fault objects in the distribution network should consider the loss of users and power companies. Based on the statistics and regulations about distribution network reliability in literature [8], the number of outage users, average interruption time, unreliable rate, and users’ power interruption cost are selected as sub-indexes of users’ blackout consequence. The main impacts of distribution network fault to the power company includes electricity loss caused by supply reducing, fees of equipment maintenance and repair and the impact of the company's brand value caused by power failures. The final index system is composed by two second grade indexes, namely the user's blackouts consequences and the power company’s blackout consequence, and seven third grade indexes [9] , shown in Figure 1.The indexes are calculated as follows:
The number of users in each outage Average number of outage users =
Outage frequency
∑
(1)
Average time of outage Power supply unreliable rate =
Duration 1
-time (2)
Outage time Average interruption time =
Outage frequency ∑
(3)
Tariff revenue loss = Power supply loss × Electricity retail price (4)
The user's power loss is calculated by indirect estimation method, which consider power as a production input factor and other factors are constant, the economic expenditure of each electricity unit would be obtained [10]. Electricity supply equipment damaged by the fault is calculated by equipment repairing fees. The impact of corporate brand value is represented by the number of users’ complaints.
3. Comprehensive Evaluation Model
Based on AHP and Improved GCDM
Model
3.1. Analytic Hierarchy Process
AHP is a applied multi-objective decision method which combines the qualitative analysis and quantitative analysis, can solve complex system problems constituted by interrelated factors [11]. According to decision objectives and characteristics of multiple criteria problem, all effective factors are divided into three levels in Analytic Hierarchy Process, namely, the target layer, criteria layer and sub-criteria level. The 1-9 scale method is used to compare the importance of the various elements, and the judgment matrix of each factor related to the upper layer is constructed. The eigenvector of the judgment matrix corresponding to the largest eigenvalue is the local weight for each element [12]. In order to ensure the coordination of importance between various elements, the consistency of the judgment matrix should be tested. Only when the random consistency ratio CR is less than 0.1, the judgment matrix has satisfactory consistency. The overall weight of index is multiplied by its local weights in criteria layer and sub-criteria level [13] .
3.2. Analysis of Grey Clustering Decision Model
Grey Clustering Decision is an important part of gray system theory which is based on the whitening function of gray number. This method will cluster different indexes into N gray classes according to the index value, and the gray class of evaluated object can be obtained. However, the traditional model of Grey Clustering Decision has some limitations and shortcomings, mainly:
(1) Whitened function is piecewise linear structure, and each level of whitening function is only related to the adjacent two levels. When the actual value is outside of these two levels, whitening function value is 0. So the coverage of the triangle whiten function is limited, and the result will loses a lot of useful information.1
(2) Since the range difference between different indicators with each level, the slope of the whitened function is quite different which affects the fairness of the evaluation.
For the above two shortcomings, this paper referred to the curved whitened function in references [ 14,15 ] and establish an exponential function so that the whitened
functions of each level can hold affiliations with all levels. Hence, the coverage of the whitening function could be expanded effectively, and the utilization of information could be greatly improved. Meanwhile, the exponential function curve is smoother to reflect the steady changes in membership relationship.
3.3. The Decision Model Based on AHP and Gray Clustering
The basic idea of evaluation method based on AHP- Grey Clustering decision model is as follows. Firstly, the evaluation object is divided into several levels according to the relevant national standards; Secondly, the whitened function of each index for each level is established; Then, using AHP to determine the weight of each index, and substitute the evaluation index values into a collection of various grades to calculate the integrated clustering coefficient. The greater its value is, the degree of compliance belong to this level is the greater [16]. The specific steps are as follows:
Suppose there are m objects to be evaluated, n evaluation indicators and p different gray types q (q = 1,2 ..., p). The value of index j about object i to be evaluated is
x
ij (i = 1,2 ..., m; j = 1,2 ..., n).(1) Determine the evaluation gray classes and whitening functions
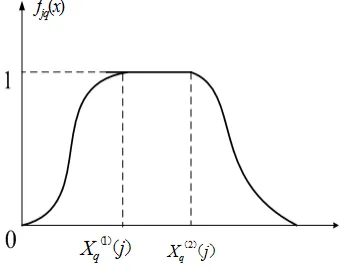
Divide the number of grey class p according to the requirements of assessing; namely, determine the level of evaluation gray class. Considering the limitation of traditional gray clustering model for linear whitened function, exponential whitened function is constructed and shown in Figure 2 :
Figure 2. Curved whitened function
In order to make sure that each level of whitening function would has affiliation with all levels , the exponential whitened functions is constructed as follows:
When q = 1 , the whitened function is:
(1) 2 1
(1) 1
1 ( ( )) (1)
1
1 0 ( )
( )
( )
j
j
j x x j
j
x x j
f x
x x j
e−α −
≤ ≤
=
>
When
2
≤ ≤ −
k
p
1
, the whitened function is:(1) 2 ( 1)
(1) 2
( ( )) (1)
( 1)
(1) (2)
( 1)
(2)
( ( ))
0
( )
( )
1
( )
j q
jq
x x j
j q
jq j k jq
x x j
jq
e
x x
j
f
x
x
j
x x
x x
e
α α − − − − − − −
≤ ≤
=
≤ ≤
>
(6)When q = p, the whitened function is:
(1) 2
( 1) (2)
( ( ))
( 1) (2) ( 1)
0
( )
( )
( )
1
j p
x x j
j p jp
j p
x x
j
e
f
x
x
x
j
α − − − − −
≤ ≤
=
>
(7)Where fjq( )x is the whitened function of index j in gray
class; a is the index coefficient, ( 2 1
*( 1) =
1
4*[ ( )]
p jq q p p x p α = +
∑
) .(2) Determine the weight of evaluation index on the consequences of blackouts
Use the Analytic Hierarchy Process to determine the weight of each index.
(3) Calculate the integrated clustering coefficient Calculate the integrated clustering coefficient of object i related to the gray class q.
1
*
n q
i jq ij j
j
f
x
σ
η
=
=
∑
(
)
(8)Where f(jq xij)is the whitened function of object i
related to index j belongs to the gray class q; ij
x
is thevalue of object i toward index j , is the weight of index j . (4) Determine the grey class.
According to max
{ }
*1
q q
i i
q p=
σ
=σ
≤ ≤ , object i to be
evaluated, belongs to gray class * q .
4. Empirical Analyze
The comparison of the outage consequences between different fault objects in distribution network can conduce the power company make reasonable adjustments for monitoring and repairing objects and improve the distribution network reliability. Therefore, a power company intends to comprehensively evaluate the outage consequences of different fault objects. Specific steps are as follows:
(1) Establish an evaluation index system on the blackout consequences of Distribution Network, which is shown in figure 1.
(2) Data processing.
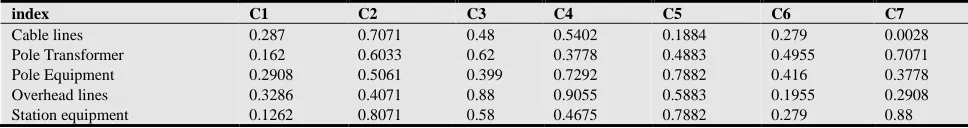
The empirical analysis data is actual values of evaluation indexes derived from this distribution network from 2010 to 2012. The grey clustering decision model requires unit consistency of each index, so the dimensionless process is necessary between different indexes. The index value is the average based on the actual data from 2010 to 2012 which is shown in Table 1.
Table 1. The average value of each index
index C1 C2 C3 C4 C5 C6 C7
Cable lines 0.287 0.7071 0.48 0.5402 0.1884 0.279 0.0028 Pole Transformer 0.162 0.6033 0.62 0.3778 0.4883 0.4955 0.7071 Pole Equipment 0.2908 0.5061 0.399 0.7292 0.7882 0.416 0.3778 Overhead lines 0.3286 0.4071 0.88 0.9055 0.5883 0.1955 0.2908 Station equipment 0.1262 0.8071 0.58 0.4675 0.7882 0.279 0.88
(3) Determine evaluation gray class and whitened function of each index.
The processed index values are all in [0,1] and the golden ratio model driven method [14] is introduced to divide each index into different gray class, as shown in Table 2:
Table 2. The gray class of each evaluation index
Very low low high Very high
(0,0.39) (0.39,0.5) (0.5,0.691) (0.691,1)
According to the range of the each gray class and exponential whitened function form, the whitened function of each grey class are shown as follows:
2
1 12( 0.39)
1
0
0.39
( )
0.39
j xx
f
x
x
e
− −
≤ ≤
=
>
(9)2 2 12( 0.39) 2 12( 0.5) 0 0.39
( ) 1 0.39 0.5
0.5
x
j
x
e x
f x x
x e − − − − ≤ ≤ = ≤ ≤ > (10) 2 2 12( 0.5) 3 12( 0.691) 0 0.5
( ) 1 0.5 0.691
0.691
x
j
x
e x
f x x
x e − − − − ≤ ≤ = ≤ ≤ > (11) 2 12( 0.39) 4
0
0.691
( )
0.691
1
x jx
e
f
x
x
− −
≤ ≤
=
>
(12)(4) Determine the index weight
Step1: The construction of hierarchical model
The hierarchy structure of evaluation on the consequences of Distribution Network fault is shown in Figure 1.
Step2: Build judgment matrix and consistency test The judgment matrix of indexes for assessing the consequences of distribution system fault are determined by the 1-9 scale by the experts, the consistency of test results of each judgment matrix are shown as follows:
Since there are only two elements in criterion level, the weights of these two elements are 0.725(B1) and 0.275(B2) determined through expert scoring.
Table 3. Judgment matrix
B1 C1 C2 C3 C4 Local weight
C1 1.00 0.50 3.00 2.00 0.269 C2 2.00 1.00 5.00 3.00 0.479 C3 0.33 0.20 1.00 0.33 0.079 C4 0.50 0.33 3.00 1.00 0.172 CR=0.0219
Table 4. Judgment matrix
B3 C5 C6 C7 Local weight
C5 1.00 0.333 0.1667 0.091 C6 3.00 1.00 0.25 0.218 C7 6.00 4.00 1.00 0.691 CR=0.046225
The CR values of judgment matrixes are both less than 0.1, so the judgment matrixes is consistent and logical.
Step3. Calculate the local weights and overall weight. Calculate eigenvector corresponding to the maximum eigenvalue of judgment matrix, we can get the local weight of each index in criteria layer and sub-criteria layer, the overall weight is the product of local weight of criteria layer and sub-criteria layer. As shown in Table 5:
Table 5. Index Weights Table
criteria layer
Local weight
sub-criteria
layer Local weight
Overall weight
(B1)
0.725 C1 0.269 0.195025 C2 0.479 0.347275 C3 0.079 0.057275 C4 0.172 0.1247
(B5)
0.275 C5 0.091 0.025025 C6 0.218 0.05995 C7 0.691 0.190025
(5) Calculate the integrated clustering coefficient of each fault object
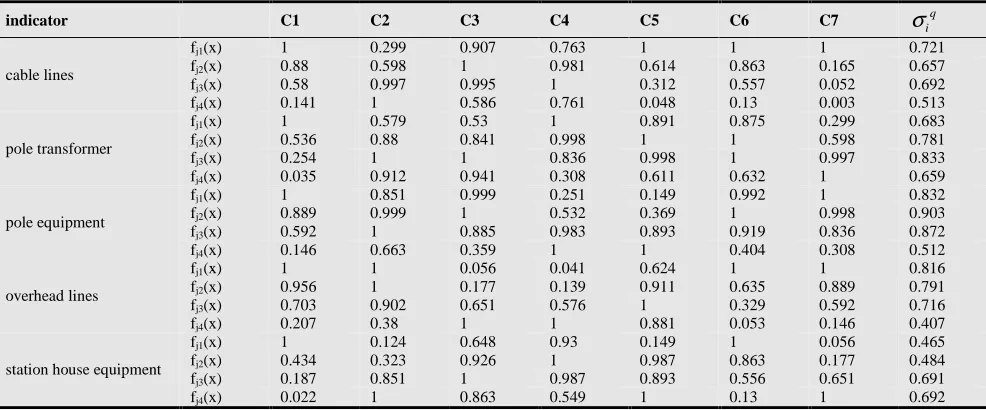
Substitute the index values of the different power failure objects into the whitened functions above to calculate the whitened function value of each index related to each gray class and integrated clustering coefficient, as shown in Table 6:
Table 6. Whitened function values and integrated clustering coefficients of different failure objects
indicator C1 C2 C3 C4 C5 C6 C7
σ
iqcable lines
fj1(x) 1 0.299 0.907 0.763 1 1 1 0.721
fj2(x) 0.88 0.598 1 0.981 0.614 0.863 0.165 0.657
fj3(x) 0.58 0.997 0.995 1 0.312 0.557 0.052 0.692
fj4(x) 0.141 1 0.586 0.761 0.048 0.13 0.003 0.513
pole transformer
fj1(x) 1 0.579 0.53 1 0.891 0.875 0.299 0.683
fj2(x) 0.536 0.88 0.841 0.998 1 1 0.598 0.781
fj3(x) 0.254 1 1 0.836 0.998 1 0.997 0.833
fj4(x) 0.035 0.912 0.941 0.308 0.611 0.632 1 0.659
pole equipment
fj1(x) 1 0.851 0.999 0.251 0.149 0.992 1 0.832
fj2(x) 0.889 0.999 1 0.532 0.369 1 0.998 0.903
fj3(x) 0.592 1 0.885 0.983 0.893 0.919 0.836 0.872
fj4(x) 0.146 0.663 0.359 1 1 0.404 0.308 0.512
overhead lines
fj1(x) 1 1 0.056 0.041 0.624 1 1 0.816
fj2(x) 0.956 1 0.177 0.139 0.911 0.635 0.889 0.791
fj3(x) 0.703 0.902 0.651 0.576 1 0.329 0.592 0.716
fj4(x) 0.207 0.38 1 1 0.881 0.053 0.146 0.407
station house equipment
fj1(x) 1 0.124 0.648 0.93 0.149 1 0.056 0.465
fj2(x) 0.434 0.323 0.926 1 0.987 0.863 0.177 0.484
fj3(x) 0.187 0.851 1 0.987 0.893 0.556 0.651 0.691
fj4(x) 0.022 1 0.863 0.549 1 0.13 1 0.692
(6) Grey cluster of different fault objects and analysis for the consequences.
{ }
1max
0.721 1
q j q p=
σ
=≤ ≤ means that the consequence of pole equipment outages is very low.
{ }
2max
0.833 1
q j q p= σ =
≤ ≤ means that the consequence of station house equipment outages is high.
{ }
3max
0.903 1
q j q p=
σ
=≤ ≤ means that the consequence of
pole transformer outages is very low.
{ }
4max
0.816 1
q j
q p= σ =
≤ ≤ means that the consequence of
cable lines outages is very low.
{ }
max0.692 5
1
q j q p= σ =
≤ ≤ means that the consequence of overhead lines outages is very high.
which indicated that the station equipment of the distribution network might be old and the daily inspection of overhead lines might be omit and emergency power configuration may be unreasonable. Therefore, the distribution network should take the consequences level of different faults object into consideration and identify the critical objects. These critical objects should be regularly checked and updated so as to reduce the probability of distribution network failure.
5. Conclusions
An evaluation index system on the consequences of Distribution Network fault and a blackout consequence evaluation model based on AHP-GCDM was put forward. AHP is used to determine the weight, which could fully consider the correlation between indicators; gray decision model based on exponential whitened function is introduced to make full use of information of different faults objects and evaluate the blackout consequences objectively. The final results of empirical analyze are basically in different gray classes; hence effectively screen the consequences of power failure of different fault objects, indicating that the model is certainly feasible.
An evaluation on the consequences of a distribution network fault on different objects showed that: outages out of overhead lines and power stations could cause higher consequences in this region while outages out of pole transformer, cables lines and poles equipment could cause lower consequences. Therefore, the power company should strengthen the inspection, repairing and replacement for overhead lines and the station equipment.
Acknowledgements
This study is supported by The National Natural Science Foundation of China (71373076); State Grid Corporation of projects funded (contract number: 2012 - Technology -88)
References
[1] Tian-you Li, Hui-ru Zhao, et al. Short interruption and its cost appraisal [J]. Automation of Electric Power Systems.2012,36(20):59-63.
[2] Xiao Chen, Jian-xing Wang, et al. Research on the power outage cost and its estimation in the electric power network[J]. Kunming Polytechnic University School Report,2003,28(1):53-58.
[3] Rui Li, Yue Li. Power supply interruption cost of important power consumers in distribution network and its emergency management [J]. Power system technology, 2011,35(10):170-176.
[4] Guan-quan Wan, Zhen Ren. Calculation of customer’s outage cost considering feeder automation. Power system technology.2005,29(1):24-31.
[5] Aaron J. Praktiknjo, Alexander Hahnel. Assessing energy supply security: Outage costs in private households[J].Energy Polocy.2011,(39)12: 7825–7833 [6] Chun-Lien Su, Jen-Ho Teng. Outage costs quantification for
benefit–cost analysis of distribution automation systems[J]. Electrical Power and Energy Systems.2007,29:767-774 [7] An-jia Mao, Chao-zhong Xiong, et al. Research on load
outage cost assessment based on the improved Tobit model[J]. Automation of Electric Power Systems.2010,34(9):29-33 [8] Chang Xin. Electric Reliability management infrastructure
[M]. China Electric Power Press .2012:8-22.
[9] Hui-ru Zhao, Na-na Li, Tian-you Li, et al. Outage consequence assessment for distribution network failure objects based on AHP and Cloud model[J]. East China Electric Power. 2013(7): 1456-1460.
[10] Jing Li. Power off loss in distribution system and its estimation methods[J].Agricultual science and technology and equipment.2008,5:38-41.
[11] Morteza Pakdin Amiri. Project selection for oil-fields development by using the AHP and fuzzy TOPSIS methods [J]. Expert Systems with Applications.2010, 37:6218-24. [12] Maggie C.Y. Tama, V.M. Rao Tummala. An application of
the AHP in vendor selection of a telecommunications system [J]. Omega 2001,29: 171-182.
[13] Ling-ling Li, Li-xin Liu. The Comprehensive Evaluation of Smart Distribution Grid Based on Cloud Model [J]. Energy Procedia. 2012,17: 96 – 102.
[14] Tao Wang, Ji Zhang, Lin-li Wu, et al. Comprehensive assessment on air quality of urban road environment based on improved gray- clustering method [J]. Environmental Engineering.2009,27(2):38-41.
[15] Yan-qin Ma. Assessment of city atmospheric environment quality by improved gray cluster relation analysis method[J].
Journal of Shandong polytechnic
university.2013,27(2):63-65.