Development of a Maintenance Schedule Plan to Improve the Equipment
Efficiency of an Industry: A Case Study
A. T. Shams, Md. F. Rabby, Md. N. Istiak
19 Azimpur, New Market, Lal Bag Dhaka-1205.
A B S T R A C T
The aim of this study is to implement Total Productive Maintenance (TPM) in a continuous injection molding industry. By implementing TPM, the industry can increase their Overall Equipment Effectiveness (OEE) and productivity. Before implementing TPM, overall equipment efficiency, availability rate, performance rate, and quality rate of the injection molding machine were 74.9%, 88.54%, 88.5%, and 95.6%, respectively. It needs to be improved for good operating condition of machines. In this paper, some tools are suggested to improve their productivity and maintenance procedure. These tools are cause and effect diagram, Pareto chart, WWBLA, and preventive maintenance schedule. TPM program is to change the culture of the company maintenance policy with involvement of all employees toward the maintenance system of the company. Through the proper planning of maintenance schedule, productivity can be improved. This schedule helps to maintain machines in good operating conditions as well as a good OEE value, and a world class standard OEE is achieved.
Keywords: TPM, Cause and effect diagram, Pareto chart.
Article history: Received: 12 March 2018 Revised: 11 June 2019 Accepted: 20 June 2019
1. Introduction
TPM involves a newly defined approach for maintaining plants and equipment in good working condition. All sections in regard to a manufacturing process is kept under consideration to reduce equipment losses to maximize OEE by using the tools and techniques of TPM. After finding all the causes of rejections, the most significant losses are identified and the causes for occurring such rejection are eliminated and the OEE improves [1]. It is necessary to implement some manufacturing excellences to produce good product without defects, minimize cost, good quality in order to maximize profits without increasing sales price. As the complexity and competition increase, the efficiency and effectiveness can be increased mainly by improving existing
Corresponding author
E-mail address: [email protected] DOI:10.22105/riej.2019.174907.1082
International Journal of Research in Industrial
Engineering
maintenance policy and operation effectiveness. The purpose of the maintenance management system is not to increase production or make system lean but also at the same time to bust up the employee morale and job satisfaction [2]. By involvement of all employees and by all departments, this system does not only give healthy environment but also makes system lean [3]. The thesis data is upon the Injection Molding Machine (IMM) which produces various plastics product. The product quality made by the injection molding machine is not consistent and reliable [4]. Today’s global competition, demands the highest product quality and performance to be delivered at the shortest cycle time and the lowest unit cost [5]. An injection molding machine, also known as an injection press, is a machine which manufactures plastic products by process of injection molding. It consists of two main parts, one named injection unit and the other is clamping unit. Material granules for the part is fed via a hopper into a heated barrel, melted using heater bands, and the frictional action of a reciprocating screw barrel. The plastic is then injection through a nozzle into a mold cavity where it cools and hardens to the configuration of the cavity [6]. This injection molding machine has two ancillary machines names, compound machine and autoloader. Compound machine is used for proper mixture of raw materials according to their percentage which results raw materials in granular shape [7]. Autoloader is a machine which is used for loading the raw materials in the hopper of injection molding machine [8]. But the output do not cope with the approximated value. Some defects continuously affect the productivity which causes loss to company. Air bubbles, black spot, color change due to over-heat, shrinkage, extra-flash, etc. are the main problems. This paper therefore provides a method to identify the root cause of defects and maintenance policy to overcome this problems in an injection molding industry (RFL Plastics Ltd.) in Bangladesh.
TPM integrates production and quality systems through the machines, equipment, and processes that add business value to the organization. It focuses on keeping all equipment in perfect working condition to avoid breakdowns and delays in the manufacturing process. In addition, it do not tolerate any small stops or slow running and no defects during production; as well as a safe working condition for manufacturing process is also established by a TPM policy [8]. TPM stands on 8 pillars. Among these, the third pillar, Kaizen, fourth pillar, planned maintenance, and sixth pillar, education and training are used in this study. All these pillar aimed at reducing losses in the workplace that affect the efficiencies [9].
The use of injection molding machine is increasing significantly in producing plastic products [10]. If the defected product is produced, many problems are induced, and at last, productivity decreases. After identified rejection reasons and eliminating them, OEE can be increased. The objective of this paper is as follows:
Identification of major losses.
Identification of significant losses by Pareto analysis. Calculation of Overall Equipment Efficiency (OEE).
Further OEE calculation and comparing it with international standard [1].
Rest of the paper is arranged in six section. The first Section covers literature review. The second Section describes research gap of this type of study. The third one provides methodology which describes some steps of this work. The fourth Section consists of data analysis and calculation of OEE. Finally, remained sections discuss the discussion and conclusion of this study.
2. Literature Review
TPM is a philosophy of continuous improvement and team work that focuses on how an equipment’s basic condition can be sustain in order to enhance its life span [11]. The fast and foremost goal of TPM is to bring competitive, prestigious advantages to organizations, to promote quality products, and to reduce the cost of production line tremendously. Overall Equipment Efficiency (OEE) can be easily obtained which can be used to monitor the maintenance progress after implementing TPM successfully [12]. Productivity can be increased by reducing defects that results in minimizing the wastage of raw materials [13]. Researchers have given emphasis in increasing equipment effectiveness. Following works have been done so far in regard to TPM and OEE.
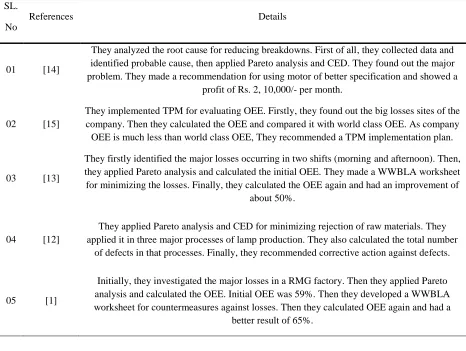
Table. References as reported in the literature.
3. Problem Statement
From previously mentioned paper, we can see that all of them found a way to increase productivity by using various tools of TPM. Researchers have used one or two tools of TPM. The higher accuracy that we get, depends on how many TPM tools are used. They did not use three or four tools of TPM together. Therefore we want four tools so that the analysis is easily understandable and the result will be accurate. No one still showed the preventive maintenance schedule to minimize the rejection reasons. When we use the preventive maintenance plan then the machine needs not to be a victim to frequent breakdown and the condition of machine can be easily understandable; it is a KAIZEN policy. Continuous improvement of the machines will result in higher productivity and it will reduce loss and breakdown of machines. A comprehensive plan has been made to identify root causes by using cause and effect diagram, Pareto chart, and made a maintenance policy by WWBLA and preventive maintenance schedule. No one still did the preventive maintenance schedule for an injection molding industry.
SL. No
References Details
01 [14]
They analyzed the root cause for reducing breakdowns. First of all, they collected data and identified probable cause, then applied Pareto analysis and CED. They found out the major problem. They made a recommendation for using motor of better specification and showed a
profit of Rs. 2, 10,000/- per month.
02 [15]
They implemented TPM for evaluating OEE. Firstly, they found out the big losses sites of the company. Then they calculated the OEE and compared it with world class OEE. As company OEE is much less than world class OEE, They recommended a TPM implementation plan.
03 [13]
They firstly identified the major losses occurring in two shifts (morning and afternoon). Then, they applied Pareto analysis and calculated the initial OEE. They made a WWBLA worksheet for minimizing the losses. Finally, they calculated the OEE again and had an improvement of
about 50%.
04 [12]
They applied Pareto analysis and CED for minimizing rejection of raw materials. They applied it in three major processes of lamp production. They also calculated the total number
of defects in that processes. Finally, they recommended corrective action against defects.
05 [1]
Initially, they investigated the major losses in a RMG factory. Then they applied Pareto analysis and calculated the OEE. Initial OEE was 59%. Then they developed a WWBLA worksheet for countermeasures against losses. Then they calculated OEE again and had a
4. Methodology
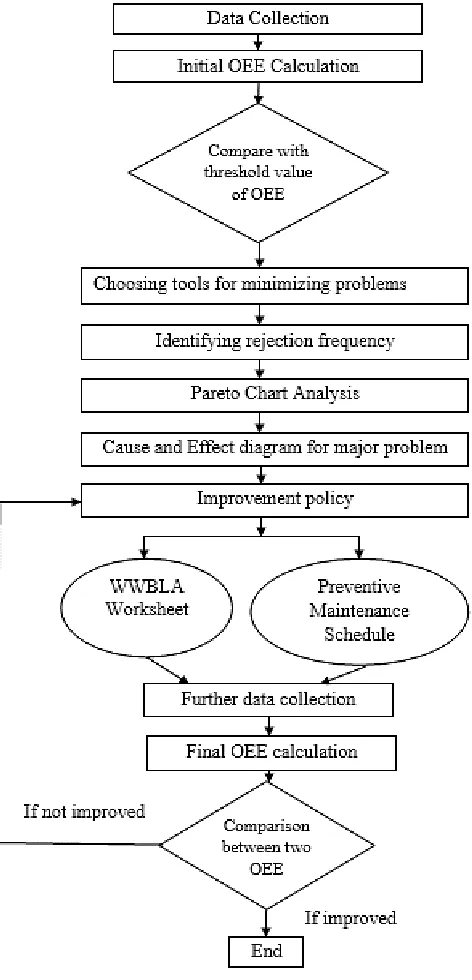
Concept of TPM is applied to the plastic company by investigating the previous performance of the production line preliminarily with a view to improving the existing production techniques. The plant’s past production data were analyzed and recorded [14]. Even after producing 24 hours a day and 7 days in a week, the company is unable to meet rapid growing market demand. So, the firm has to reduce the unwanted and unplanned stoppages of production in order to ensure a steady production level and to meet the market requirements. Production may be stopped due to many reasons like machine breakdown, maintenance work of machine or production floor, labor issues, insufficient material supply, machine trouble shooting problems, problems in manufacturing process, etc. [15]. Finally, the methodology of doing work is shown in Figure 1.
5. Data Analysis
5.1. Rejection Reasons
Various problems are associated with the rejection of products. We have found out twelve major problems behind the rejection of final products. These are such as:
Table 2. Rejection reasons.
Serial number Rejection Reason
1 Operator activeness
2 Raw material proper preheating problem
3 Mold load-unload time takes more
4 Proper equipment lack during mold load unload
5 Machine parameter setting/machine trouble shooting time length
6 Power problem
7 Mold ejector pin broken problem
8 Recycle material over use
9 Not maintain material recipe
10 Machine heater damage or uncertain problem
Figure 1. Process flow diagram of methodology.
It is also noticed that there is no preventive maintenance schedule in production floor of injection molding and lack of proper working condition for employees and workers.
5.2. Data Collection
molding machine is vastly used for their plastics production. For thesis purpose their factory have been visited twice. First time one of their factories is visited which have 66 injection molding machines in twelve lines and around 400 molds. Their production runs about 24 * 7 in a week. Our thesis data was collected from a production floor that produces sanitary fittings of about various sizes, shapes and quantity in the month of December. Our collected data was about 3 inch elbow fittings. Its cycle time is 55 seconds. Second time we visited there and noted down some rejection reasons and problems associated with IMM and other relevant machine i.e. Compound machine and Autoloader. The frequency of rejection is identified by the information based on Maintenance section. Then root causes of rejection is found out initially and finally make a solution of these problems. By this process initial OEE is calculated. After observing so much ins and outs, an effective and feasible maintenance plan is recommended which results in better OEE.
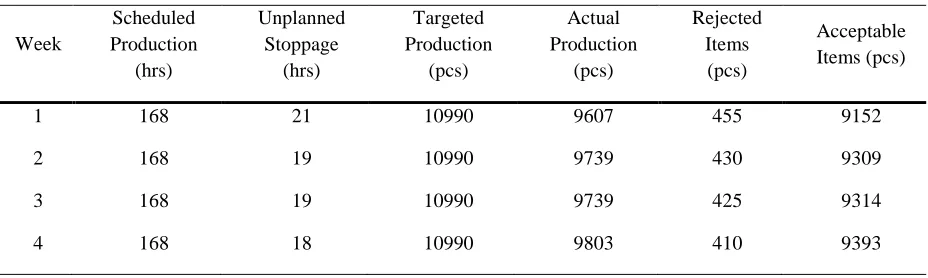
Initial data is collected from factory. For OEE calculation various data are needed. These are collected by visiting factory and inspecting production floor. It’s a continuous production factory so machine runs almost 24*7. Data on scheduled production, unplanned stoppage, targeted production, actual production, rejected items and acceptable items are collected separately. These are given below in Table 3.
Table 3. Data on various criteria.
5.3. Initial OEE Calculation
The calculations for Overall Equipment Efficiency (OEE) of the machines follow the subsequent formula:
Overall Equipment Efficiency (OEE) = Availability * Performance Rate * Quality Rate where,
Availability (%) = ∑𝑆𝑐ℎ𝑒𝑑𝑢𝑙𝑒𝑑𝑝𝑟𝑜𝑑𝑢𝑐𝑡𝑖𝑜𝑛𝐸𝑓𝑓𝑒𝑐𝑡𝑖𝑣𝑒𝑟𝑢𝑛𝑛𝑖𝑛𝑔𝑡𝑖𝑚𝑒 *100
= ∑𝑆𝑐ℎ𝑒𝑑𝑢𝑙𝑒𝑑𝑝𝑟𝑜𝑑𝑢𝑐𝑡𝑖𝑜𝑛−𝑈𝑛𝑝𝑙𝑎𝑛𝑛𝑒𝑑𝑠𝑡𝑜𝑝𝑝𝑎𝑔𝑒𝑠𝑐ℎ𝑒𝑑𝑢𝑙𝑒𝑑 𝑟𝑢𝑛𝑛𝑖𝑛𝑔 𝑡𝑖𝑚𝑒 *100 Week
Scheduled Production
(hrs)
Unplanned Stoppage
(hrs)
Targeted Production
(pcs)
Actual Production
(pcs)
Rejected Items
(pcs)
Acceptable Items (pcs)
1 168 21 10990 9607 455 9152
2 168 19 10990 9739 430 9309
3 168 19 10990 9739 425 9314
Performance Rate (%) = ∑𝑇𝑎𝑟𝑔𝑒𝑡𝑒𝑑𝑝𝑟𝑜𝑑𝑢𝑐𝑡𝑖𝑜𝑛𝐴𝑐𝑡𝑢𝑎𝑙 𝑝𝑟𝑜𝑑𝑢𝑐𝑡𝑖𝑜𝑛 *100
Quality Rate (%) = 𝐴𝑐𝑡𝑢𝑎𝑙𝑝𝑟𝑜𝑑𝑢𝑐𝑡𝑖𝑜𝑛𝐴𝑐𝑐𝑒𝑝𝑡𝑎𝑏𝑙𝑒𝑖𝑡𝑒𝑚𝑠 *100
= 𝐴𝑐𝑡𝑢𝑎𝑙𝑝𝑟𝑜𝑑𝑢𝑐𝑡𝑖𝑜𝑛−𝑅𝑒𝑗𝑒𝑐𝑡𝑒𝑑𝑖𝑡𝑒𝑚𝑠𝐴𝑐𝑡𝑢𝑎𝑙𝑝𝑟𝑜𝑑𝑢𝑐𝑡𝑖𝑜𝑛 *100.
Calculations are given in Table 4.
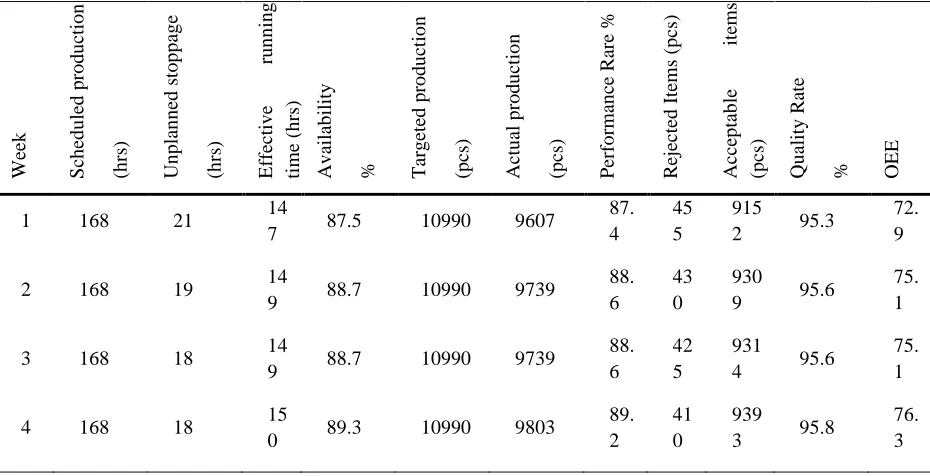
Table 4. Initial OEE calculation.
So OEE for one month (4 weeks) is 74.9%.
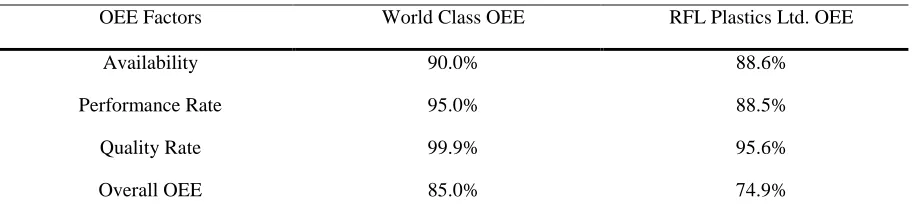
5.4. Comparison
A table showing comparison between world class OEE and RFL’s OEE is developed below:
W ee k Sch ed u led p ro d u ctio n (h rs ) Un p lan n ed s to p p ag e (h rs ) E ff ec tiv e ru n n in g tim e (h rs ) Av ailab ilit y
% Tar
g eted p ro d u ctio n (p cs) Actu al p ro d u ctio n (p cs) Per fo rm an ce R ar e % R ejec ted I tem s (p cs) Acc ep tab le item s (p cs) Qu ality R ate % OE E
1 168 21 14
7 87.5 10990 9607
87. 4
45 5
915
2 95.3
72. 9
2 168 19 14
9 88.7 10990 9739
88. 6
43 0
930
9 95.6
75. 1
3 168 18 14
9 88.7 10990 9739
88. 6
42 5
931
4 95.6
75. 1
4 168 18 15
0 89.3 10990 9803
89. 2
41 0
939
3 95.8
Table 5. Comparison between world OEE and RFL’s OEE (4 weeks).
OEE Factors World Class OEE RFL Plastics Ltd. OEE
Availability 90.0% 88.6%
Performance Rate 95.0% 88.5%
Quality Rate 99.9% 95.6%
Overall OEE 85.0% 74.9%
From the above table, it is seen that RFL’s all OEE factors are less than world class OEE factors. Moreover, overall OEE of RFL is 74.9%, which is much less than the world class OEE of 85%. So, remedial action and as well as corrective and preventive action should be patronized in order to improve the OEE value.
5.5. Problems Minimizing Tools
For improvement in TPM, some analytical techniques are basically used. These are:
WWBLA (Why Why Because Logical Analysis).
P-M analysis. Why-Why analysis. Fault tree analysis.
Failure mode effect analysis cause and effect diagram. Pareto analysis.
SPC, etc.
These tools are used for minimizing losses. We used WWBLA, Pareto chart, cause and effect diagram and P-M analysis/preventive maintenance schedule for our solution [1].
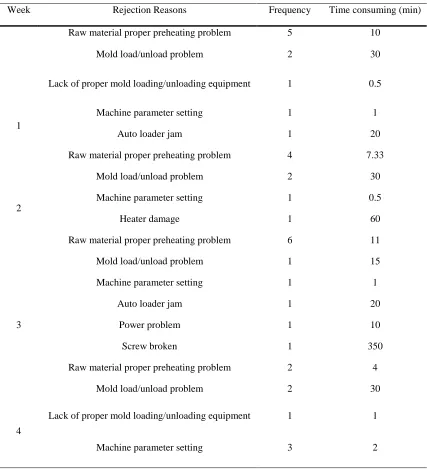
5.6. Frequency of Individual Reason with Consuming Time
Table 6. Reasons for Rejection of Products for Several Weeks (4 weeks).
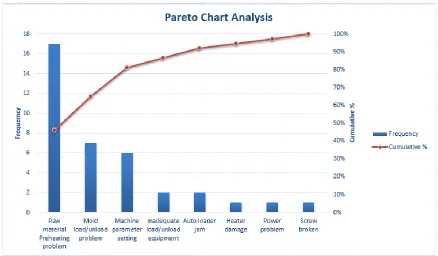
5.7. Pareto Chart Analysis
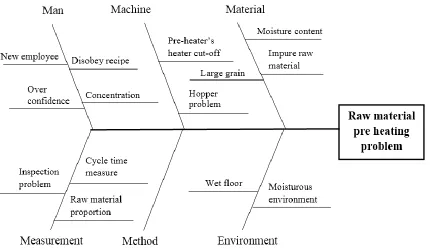
Now, from Pareto analysis, it is seen that major reasons for rejection is in raw materials preheating problem which has the highest frequency of occurrence comprising of about 46% of cumulative occurrence. So, it is necessary to eliminate this major problem first to increase the OEE. The main causes of this problem is due to preheater’s heater cut off and hopper problem. Now, WWBLA technique is used for identifying the countermeasures with a view to minimize the causes of problem [1].
Week Rejection Reasons Frequency Time consuming (min)
1
Raw material proper preheating problem 5 10
Mold load/unload problem 2 30
Lack of proper mold loading/unloading equipment 1 0.5
Machine parameter setting 1 1
Auto loader jam 1 20
2
Raw material proper preheating problem 4 7.33
Mold load/unload problem 2 30
Machine parameter setting 1 0.5
Heater damage 1 60
3
Raw material proper preheating problem 6 11
Mold load/unload problem 1 15
Machine parameter setting 1 1
Auto loader jam 1 20
Power problem 1 10
Screw broken 1 350
4
Raw material proper preheating problem 2 4
Mold load/unload problem 2 30
Lack of proper mold loading/unloading equipment 1 1
Figure 2. Pareto chart analysis.
5.8. Identifying Causes behind Most Frequent Problem
Figure 2. Cause and effect diagram.
5.9. Improvement Poly
After identifying the major reasons for rejection and major problems, now remedial actions should be accelerated. For directing remedial action, two solutions are proposed. One is WWBLA worksheet which comprises countermeasures for problems and other is preventive maintenance schedule for better maintenance of machines.
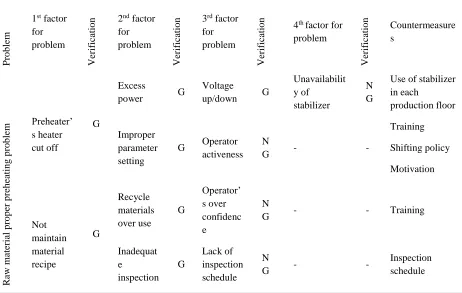
5.9.1. WWBLA (Why-Why because logical analysis) worksheet
Table 7. WWBLA Worksheet.
Pro
b
lem
1st factor
for problem
Ver
if
icatio
n 2nd factor
for problem
Ver
if
icatio
n 3rd factor
for problem Ver if icatio n
4th factor for
problem Ver if icatio n Countermeasure s R aw m ater ial p ro p er p reh ea tin g p ro b lem Preheater’ s heater cut off G Excess
power G
Voltage
up/down G
Unavailabilit y of
stabilizer
N G
Use of stabilizer in each
production floor
Improper parameter setting
G Operator
activeness N
G - -
Training Shifting policy Motivation Not maintain material recipe G Recycle materials over use G Operator’ s over confidenc e N
G - - Training
Inadequat e inspection G Lack of inspection schedule N
G - -
Inspection schedule
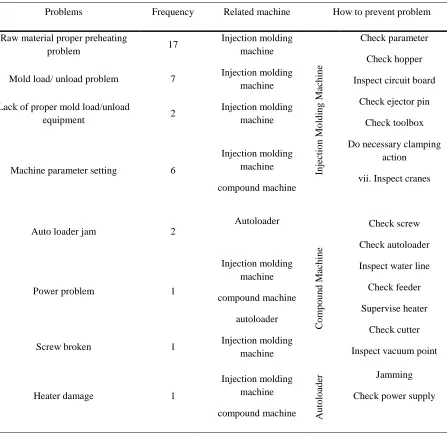
5.9.2. Preventive maintenance schedule
Table 8. Problems related to each machine.
Problems Frequency Related machine How to prevent problem
Raw material proper preheating
problem 17
Injection molding machine In jectio n Mo ld in g Ma ch in e Check parameter Check hopper Inspect circuit board
Check ejector pin Check toolbox Do necessary clamping
action vii. Inspect cranes
Mold load/ unload problem 7 Injection molding
machine Lack of proper mold load/unload
equipment 2
Injection molding machine
Machine parameter setting 6
Injection molding machine compound machine
Auto loader jam 2
Autoloader C o m p o u n d Ma ch in e Check screw Check autoloader Inspect water line
Check feeder Supervise heater
Check cutter Inspect vacuum point
Power problem 1
Injection molding machine compound machine
autoloader
Screw broken 1 Injection molding
machine
Heater damage 1
Injection molding machine
compound machine Au
to
lo
ad
er Jamming
Check power supply
Figure 3. Preventive maintenance schedule plan.
5.10. OEE Calculation after Adopting Maintenance Plan
Table 9. Final OEE calculation.
So, final OEE for 1 month (4 weeks) is 83.85%.
5.11. Comparison between Initial OEE and Final OEE
Comparison between previous OEE and conclusive OEE is shown in Table 10 below.
Table 10. Comparison between Initial OEE and Final OEE.
Wee k
Initial OEE Final OEE
Availabili ty %
Performan ce Rate %
Qualit y Rate % Overa ll OEE Availabili ty % Performan ce Rate %
Qualit y Rate % Overa ll OEE
1 87.5 87.4 95.3 72.9 91.7 91.6 97.8 82.1
2 88.7 88.6 95.6 75.1 91.7 91.6 98.1 82.4
3 88.7 88.6 95.6 75.1 92.9 92.8 98.5 84.9
4 89.3 89.2 95.8 76.3 93.5 93.4 98.5 86.0
6. Discussion
Total productive maintenance integrates all activities of a manufacturing system with maintenance department .It also involves the operators in maintenance activities. It provides a scheduled work to do maintenance policy effectively. In this study, firstly cause effect diagram
W ee k Sch ed u led p ro d u ctio n (h rs ) Un p lan n ed s to p p ag e (h rs ) E ff ec tiv e ru n n in g tim e (h rs ) Av ailab ilit y % T ar g eted p ro d u ctio n (p cs) Actu al p ro d u ctio n (p cs) Per fo rm an ce R ar e % R ejec ted I tem s (p cs) Acc ep tab le item s (p cs) Qu ality R ate % OE E
1 168 14 15
4 91.7 10990 10065
91. 6
22 0
984
5 97.8
82. 1
2 168 14 15
4 91.7 10990 10065
91. 6
19 0
987
5 98.1
82. 4
3 168 12 15
6 92.9 10990 10196
92. 8
15 4
100
42 98.5
84. 9
4 168 11 15
7 93.5 10990 10261
93. 4
15 0
101
11 98.5
for each rejection reason is identified. Then problem associated with only machines is identified. From that it is seen that raw material proper preheating problem, mold load/unload problem, lack of proper mold load/unload equipment, machine parameter setting, power problem, screw broken, heater damage come from injection molding machine. Machine parameter setting, power problem, heater damage come from compound machine. Auto loader jam, power problem come from autoloader. As there was no daily maintenance policy, the condition of equipment was poor and shortage of spare parts. In RFL industry, the Overall Equipment Effectiveness (OEE) of the injection molding machine was 74.9% where the availability was 88.54% of the production time and the performance was 88.5%, while the quality rate was 95.6%. After adopting some set of techniques like preventive maintenance activities and some counter-measures, the productivity is subjected to an improvement. After adopting above techniques, the Overall Equipment Effectiveness (OEE) of the injection molding machine become 83.8% where the availability becomes 92.4% of the production time and the performance becomes 92.3% while the quality rate becomes 98.2%. This improved OEE not only increase productivity but also keep pace with international standards of OEE which was discussed before. The improvement policy includes continuous improvement, empowering the employee, and standardizing every activity to prevent sudden breakdown. Thus, from this research work, it can be expected that the OEE could be increased to a very high content by implementing TPM to an industry.
7. Conclusions
Nowadays, production systems must be highly competitive, so the resources administration is for the company survival in order to obtain as much benefits as they can [16]. By adopting this process, a company can easily increase its productivity. This process will help to maintain the machine condition good and empower employees. But this policy should be maintained properly thoroughly the whole production process and the production engineers must supervise the maintenance policy at a fixed time interval. Although this experiment increases OEE in a great content, but there are some barrier and condition to this method. This process needs a continuous production line. Fault tree analysis could be used for identifying rejection reasons. SPC could be used to minimize losses. Overall, this process will be effective in a continuous production line and this should be subjected to further improvement.
References
Masud, A. K. M., Al-Khaled, A., Jannat, S., Khan, A. S. A., & Islam, K. J. (2007). Total productive maintenance in RMG sector a case: burlingtons limited, Bangladesh. Journal of mechanical
engineering, 37, 62-65.
Aspinwall, E., & Elgharib, M. (2013). TPM implementation in large and medium size organisations. Journal of manufacturing technology management, 24(5), 688-710.
Yadav, S., Singh, R. K., & Kumar, P. (2017). Justification of maintenance management: AHP approach. 2017 IEEE international conference on industrial engineering and engineering
Cho, S. W., Gällstedt, M., Johansson, E., & Hedenqvist, M. S. (2011). Injection-molded nanocomposites and materials based on wheat gluten. International journal of biological
macromolecules, 48(1), 146-152.
Rao, K. R., & Ravishankar, V. (2016). Parametric design for quality improvement of injection-moulded product in a consumer electronics conglomerate. International journal of experimental design
and process optimisation, 5(1-2), 41-52.
Injection molding machine. (n.d). Retrieved July 22, 2019 from
https://en.wikipedia.org/wiki/Injection_molding_machine
Rahman, C. M., Hoque, M. A., & Uddin, S. M. (2014). Assessment of total productive maintenance implementation through downtime and mean downtime analysis (case study: a semi-automated manufacturing company of Bangladesh). Assessment, 4(09).
Graisa, M., & Al-Habaibeh, A. (2011). An investigation into current production challenges facing the Libyan cement industry and the need for innovative total productive maintenance (TPM) strategy. Journal of manufacturing technology management, 22(4), 541-558.
Chandna, P., & Chandra, A. (2009). Quality tools to reduce crankshaft forging defects: an industrial case study. Journal of industrial and systems engineering, 3(1), 27-37.
Ng, K. C., Goh, G. G. G., & Eze, U. C. (2011, December). Critical success factors of total productive maintenance implementation: a review. 2011 IEEE international conference on industrial engineering
and engineering management (pp. 269-273). IEEE.
Paropate, R. V., & Sambhe, R. (2013). The implementation and evaluation of total productive maintenance–a case study of mid-sized Indian enterprise. International journal of application or
innovation in engineering & management (IJAIEM), 2(10).
Ahmed, M., & Ahmad, N. (2011). An application of Pareto analysis and cause-and-effect diagram (CED) for minimizing rejection of raw materials in lamp production process. Management science and
engineering, 5(3), 87.
Ohunakin, O. S., & Leramo, R. O. (2012). Total productive maintenance implementation in a beverage industry: a case study. Journal of engineering and applied science, 7(2), 128-133.
Kiran, M., Mathew, C., & Kuriakose, J. (2013). Root cause analysis for reducing breakdowns in a manufacturing industry. International journal of emerging technology and advanced engineering,
3(1).
Nahar, K., Islam, M. M., Rahman, M. M., & Hossain, M. M. (2012). Evaluation of OEE for implementing total productive maintenance (TPM) in sewing machine of a knit factory. Proceedings
of the global engineering, science and technology conference (pp. 28-29).
Ireland, F., & Dale, B. G. (2001). A study of total productive maintenance implementation. Journal of