Computerized Automatic Three Phase Data
Logger for Power Stations
Nkolika O. Nwazor1, Ugochukwu Elele2
1,2
Electrical/Electronic Engineering Department, University of Port Harcourt, Nigeria
Abstract
This paper is on the Design of a Computerised Automatic Three Phase Data Logger with Computer Interface for Power Stations. Currently, power stations in Most developing nations collect data like voltage, current and frequency measurements manually from their different measuring instruments leading to loss of man-hour, exposure of the operators to risks for instruments located in hazardous areas, and possible introduction of errors to the readings obtained from the instruments. The automatic three phase data logger proposed in this work comes as a solution to these challenges faced by Most developing nations’ power stations. The work involves the design and construction of a system capable of measuring voltage, current, and frequency. A computer graphical user interface was designed for the system for easier man machine interaction. The hardware part of the system is made up of five major components namely: Power supply, Sensor, Display, Control, and a Work Station. This three Phase data logger basically reads in the voltage, current and frequency of a three phase supply as analog signals; processes them, and display these data on the liquid crystal display and computer screen (mimicked by the virtual terminal of the Proteus ISIS environment. The displayed data on the computer screen is be stored into the computer hard-disk with the help of a freeware software known as “Coolterm” through a wired serial connection. It logs data every second, being a prototype model
.
Keywords — data logger, computerised, automatic, three phase, power, instrument
I. INTRODUCTION
A data logger (or a data recorder) is an electronic device that records data over time or in relation to location either with a built-in instrument or sensor or via external instruments and sensors [1]. They are based on digital processor (or computer). They are generally small, battery powered, portable, and equipped with a microprocessor, internal memory for data storage, and sensors (depending on the type of data logger). Some data loggers are interfaced with a personal computer and utilize software to activate, view, and analyse the collected data, while others have a local interface device, like the LCD, and could be used as stand-alone devices, [1]. The magnitude of
current flow in a station, the voltage across the incomer, the amount of energy consumed by the feeders and the frequency are relevant data to the systems operation engineer in any power station. Other relevant readings include transformer temperature reading: the winding temperature and the transformer oil temperature. All these readings are of paramount importance to the systems engineer. It helps in determining the amount of energy consumed and in detecting system faults. Some of these quantities are usually measured with the help of instrument transformers feeding the digital/analog Voltmeter or Ammeter.
These readings are taken as a way of accessing the amount of energy that is received by and transmitted from a power station. In Most developing nations, these readings are recorded and sent to the regional headquarters and National Control Centre (NCC) monthly and annually. They help in decision making and form a concrete tool for power flow studies, which can be used for future expansion of a given power station. It is important that these readings are taken on time and without error. This can also be a way of checking fraud especially in areas where power is sold from the generating stations to the transmission stations, and/or from the transmission stations to the distribution stations. This is because in most power stations today, the payment made per consumption is not uniform.
obtained readings acquired automatically in a computer for future use.
II. LITERATUREREVIEW
A lot of researchers have worked on data collection instruments in the past. [2] constructed a multichannel temperature data logger. His data logger could measure and record temperature from up to four channels and from range 0 to 400 degree centigrade, display the readings on an LCD and also store them in a removable memory card so that retrieval can be made easily. He had to combine three microcontrollers using peripheral interfaces so that he could have an efficient system. The researchers in [3] worked on a low cost solar data logger. The authors in [4] worked on a data logger that acquires the data from the power network (data acquisition) for monitoring. The software was developed to perform
all the manipulations and the system parameters can be viewed in different forms (analog, digital, graphical). The work [5] is on a general purpose data logger that is compatible with a variety of transducers, potentially permitting the measurement and recording of a wide range of phenomena The recorded data can be retrieved to a PC via an RS PC via an RS- PC via an RS-232 serial port
III. SYSTEMDESIGN
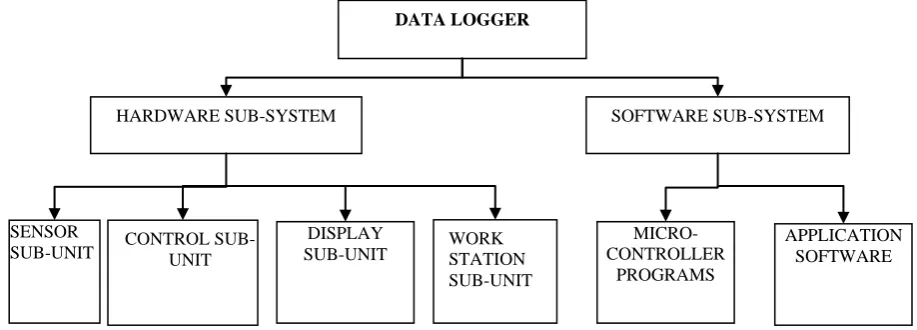
The entire system can be grouped under two major systems as shown in fig. 1. The hardware sub-system comprises the power supply, control, sensing, display and work station modules while the software sub-system is made up of the microcontroller programs and the application software for the hardware-computer interface.
Fig. 1: Block Diagram Overview of the Entire System
A. Hard Ware Sub-System
The hardware sub-system as shown in fig.1 comprises of the following modules:
1)Display:
A 20x2 liquid crystal display (LCD) was used in this work for the display of the readings/data generated. The data to be displayed on the LCD is sent to it via the microcontroller after every proper connection has been made. The data is also stored in the computer memory.
2)The Workstation:
The work station shows the real time log of voltage, current, and frequency, coming from the supply. Based on the set instruction, the user can set the logging time interval to be 5, 10, 15, 30, 60, or 120 minutes. The workstation is basically the monitor placed in the operator’s office. While the LCD displays just the instantaneous readings, the workstations displays the readings over time as much as can be contained on the screen and also saves all that have been logged that day with time/date stamp in its memory. These functions of the work station
are made possible with software known as “Coolterm”, as opposed to the serial monitor software provided by Arduino. This logging is via wired connection provided by the USB cable connected from the data logger to the serial port of the workstation.
3)The Sensor:
This work used ACS712-30A current sensor which possesses a sensitivity of 66mV/A. This means that for every 1A increase in the current, the output voltage rises by 66mV. The sensor is powered by 5V dc supply, and gives an output voltage of 2.5V for no current flow. When connected to a voltage source, a load must be placed in series with it to enable current flow. It is this current that the sensor detects, and outputs voltage based on Hall Effect. For a DC supply, the output voltage is proportional to the input current; this is however not the same for an AC supply, as used in this project. For an AC supply, some re-calibration must be made seeing that the amplitude of an AC supply is not constant. The input voltage is gotten as a product of the input current and the load resistance causing the
DATA LOGGER
SENSOR
SUB-UNIT CONTROL SUB-UNIT
DISPLAY
SUB-UNIT WORK STATION SUB-UNIT
SOFTWARE SUB-SYSTEM HARDWARE SUB-SYSTEM
MICRO-CONTROLLER
PROGRAMS
current flow. The microcontroller computes the input current from the Hall voltage, sensor supply voltage, and the sensitivity as illustrated in equation (1)
(1)
The sensor supply voltage (Vcc) is usually 5V and at no supply, the sensor gives a default output of 2.5V; thus the microcontroller outputting 0A for no current. In a typical power station, the sensor is replaced with a current transformer.
4)The Power Supply:
The sensor and the microcontroller both need a DC supply of 5V. This 5V can be supplied by connecting to the computer USB host, therefore doubling the function of the serial port: Serial Communication and Voltage Supply.
5)The Control Sub-Unit
The Arduino Uno microcontroller was used as for the control function in this system. Arduino is a low power CMOS 8-bit microcontroller based on AVR enhanced RISC architecture. The execution of instructions in a single clock cycle leads to the achievement of 1 MIPS, allowing the designer to optimize power consumption and processing speed. The arduino has an inbuilt Analog-to-Digital Converter (ADC) which converts analog voltage on a pin to a digital number. The analog pins on the Arduino Uno Microcontroller (A0 to A5) are connected to the ADC. The ADC on the Arduino is a 10-bit ADC, meaning it has the ability to detect 1024 (210) discrete analog levels. Since the ADC can read
1024 discrete values, which is equivalent to 0 to 1023 discrete values; the ADC assumes 5V to be 1023 and anything less than 5V to be a ratio of 5V and 1023. The mathematical formula used to achieve this is:
(2) Analog-to-Digital conversions are dependent on the system Voltage. 10-bit ADCs are predominantly used on a 5V system thus equation 2 can be further expressed as:
if an analog voltage is 2.12V, the ADC report is simply:
The ADC reading is therefore equal to:
On Arduino, the keyword “analogRead” reads in the ADC value and transfers it to a declared variable. Thus, the actual voltage across the input is gotten from the equation below:
(3) The Arduino voltage is usually 5V, while the resolution of the ADC is 10-bit, which is equivalent to 1023. This analog voltage is used to calculate the input current, according to equation 1, and the input current is then used to calculate the source voltage, and then displayed on the LCD.
The complete circuit diagram for the system is shown in fig. 2.
B. Software Sub-System
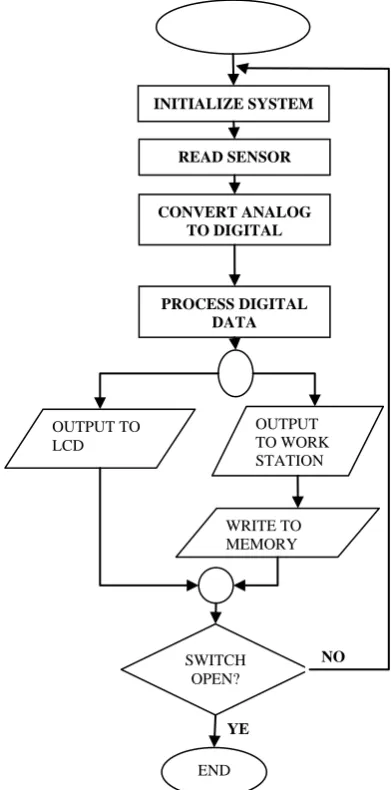
The flow chart for the software program for the microcontroller is shown in figure 3. The design was implemented using embedded C-language programming
IV.RESULTS
On running the Arduino codes that were used to process the analog input and further display this value on the LCD and computer terminal with the Arduino Uno embedded C compiler, coupled with Proteus
ISIS schematics, the following data were obtained for different voltage sources as shown in table 1
.
Table 1 Results
Source Voltage (V) Input Resistance (Ω) Displayed Current (A) Displayed RMS Voltage (V)
100 24 3.40 81.7
110 24 3.46 83.1
240 24 7.54 181.1
START
Figure 3: Flowchart for the Control System Program
YE S
INITIALIZE SYSTEM
READ SENSOR VALUES
CONVERT ANALOG TO DIGITAL
PROCESS DIGITAL DATA
OUTPUT TO LCD
OUTPUT TO WORK STATION
WRITE TO MEMORY
SWITCH OPEN?
END
0 24 0 0
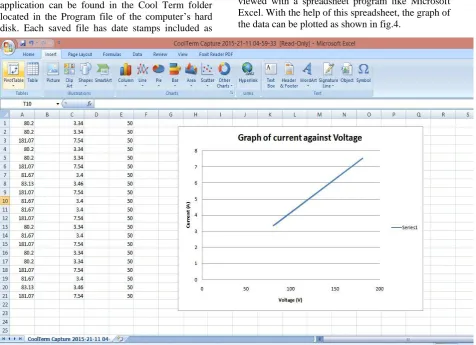
The saved logged-in data by the CoolTerm application can be found in the Cool Term folder located in the Program file of the computer’s hard disk. Each saved file has date stamps included as
part of its file name. These logged data can be viewed with a spreadsheet program like Microsoft Excel. With the help of this spreadsheet, the graph of the data can be plotted as shown in fig.4.
Figure 4: Plot of Results
From the graph above, the current and voltage plot is linear which forms a parallel with Ohms law.
V. CONCLUSIONS
Three phase data logger is a very important system needed in power stations. Just very few stations in Most developing nations use automated data logging system, the rest still use the manual method which is not efficient. Manual data logging is prone to errors and its method of storage is not reliable, as data can be lost easily. Most stations today hire personnel to key in the recorded data into the computer for better storage and accessibility. Although this is a way to by-cut some disadvantages in choosing manual data logging method, it is rather stressful and also prone to error from the personnel transferring the data. A three phase data logger solves this problem as it ensures timely and accurate data acquisition and automatic storage in a computer memory. This three Phase data logger basically reads in the voltage, current and frequency of a three phase supply as analog signals; processes them, and display these data on the LCD and computer screen
(mimicked by the virtual terminal of the Proteus ISIS environment. The displayed data on the computer screen can be stored into the computer hard-disk with the help of freeware software known as “Coolterm” through a wired serial connection. It logs data every second, being a prototype model. It is rugged and can stand unfavourable climatic conditions
.
REFERENCES
[1] https://en.wikipedia.org/wiki/Data_logger
[2] Stephen Chin Wey, “Multichannel Temperature Logger”Project report, 2011
[3] S. K. Tripathi, K. A. Singh, P. Ojha and A. K. Baliyan, “Solar Data Logger”, IJSTE,2017
[4] Swarup, Shanti & Uma Mahesh, P. (2006). Computerized data acquisition for power system automation. 2006 IEEE Power India Conference. 2005. 7 pp.. 10.1109/POWERI.2006.1632484.