INTERNATIONAL JOURNAL OF PHARMACEUTICAL, CHEMICAL AND BIOLOGICAL SCIENCES
Available online at
www.ijpcbs.com
A SIMPLE, SENSITIVE, SELECTIVE AND HIGH THROUGHPUT
LIQUIDCHROMATOGRAPHY/TANDEM MASS SPECTROMETRY
(LC/MS/MS)ASSAY OF EXEMESTANEIN HUMAN PLASMA
Abhishek Gandhi
1,2, Swati Guttikar
1and Priti Trivedi
2*1Bioanalytical Research, Veeda Clinical Research, Ahmedabad-380 059, Gujarat, India. 2Departmentof Pharmaceutical Chemistry, K. B. Institute of Pharmaceutical
Education and Research, KadiSarvaVishawavidyalaya, Gandhinagar-382 023, Gujarat, India.
1. INTRODUCTION
Aromatase is the principal enzyme that converts androgens to estrogens both in pre and postmenopausal women. While the main source of estrogen (primarily estradiol) is the ovary in premenopausal women, the principal source of circulating estrogens in postmenopausal women is from conversion of adrenal and ovarian androgens (androstenedione and testosterone) to estrogens (estroneand estradiol) by the aromatase enzyme in peripheral tissues. Estrogen deprivation through aromatase inhibition is an effective and selective treatment for postmenopausal patientswith hormone-dependent breast cancer. Exemestane is an irreversible, steroidal aromatase inactivator, structurally related to the natural substrate androstenedione. It acts as a false substrate for
the aromatase enzyme, and is processed to an intermediate that binds irreversibly to the active site of the enzyme causing its inactivation, an effect also known as “suicide inhibition.” Exemestane significantly lowers circulating estrogen concentrations in postmenopausal women, but has no detectable effect on the adrenal biosynthesis of corticosteroids or aldosterone. Following oral administration to healthy postmenopausal women, exemestane is rapidly absorbed.Exemestane is extensively distributed and is cleared from the systemic circulation primarily by metabolism1, 2.
Evaluation of bioequivalence required pharmacokinetic plotting of time-concentration profile to be accurate. Method for extraction was required to selectively extract analyte of interest without co-extracting conjugated metabolites of
Research Article
ABSTRACT
A simple, sensitive and specific liquid chromatography–tandem mass spectrometry method was developed and validated for quantification of exemestane.Exemestane is an irreversible, steroidal aromatase inactivator and it is indicated for adjuvant treatment of postmenopausal women with estrogen-receptor positive early breast cancer.The analyte and internal standard (IS)(exemestane-D2) were extracted by liquid-liquid extraction withethyl acetate: n-Hexane (80:20v/v) solvent mixture. The chromatographic separation was performed on a reverse phase Kinetex 2.6µ C18, 50 × 4.6 mm column with a mobile phase of 0.01% (v/v) acetic acid in water andacetonitrilein gradient composition.Exemestane was quantitated in positive ionization by multiple-reaction-monitoring with a mass spectrometer. The mass transitions m/z 297.4 → 121.2 and m/z 299.4 → 123.2 were used to measure exemestane and exemestane-D2 respectively.The assay exhibited a linear dynamic range of 0.100–40.0 ng/ml for exemestane in human plasma. The lower limit of quantitation achieved was 0.100ng/mL for exemestanewith a relative standard deviation of less than 20%. Acceptable precision and accuracies were obtained for concentrations over the standard curve ranges.A run time of 8.0 minutes for each sample made it possible to analyze more than 100 human plasma samples per day. The validated method has been successfully used to analyze human plasma samples for application in pharmacokinetic and bioequivalence studies.
these drugs which can be converted back to parent drug.
2. MATERIALS AND METHODS 2.1 Chemicals and materials
Reference standard of exemestane (Lot No.: G0M518; 99.7%)was obtained from USP(Rockville, USA)andexemestane-D2 (98.3%) was obtained from Clearsynth Labs Limited (Mumbai, India).Acetic acid GR grade was procured from S.d. Fine Chem Private Limited. (Mumbai, India).HPLC grade ethyl acetate,n-Hexane, acetonitrile and methanol were procured from J.T. Baker Private Limited (Mumbai, India).Water used in the entire analysis was prepared from Milli-Q water purification system from Millipore (Bengaluru, India). Blank human plasma with K3EDTA as anticoagulant was obtained from clinical laboratory SupratechMicropath (Ahmedabad, India) and was stored at –20 C until use.
2.2 Liquid chromatography and mass spectrometry conditions
A Shimadzu HPLC 20-AD system (Kyoto, Japan) consisting of an LC-20AD pump, an SIL-HTcautosampler, a CTO-20AC column oven and a DGU-20 degasser was used for setting the reverse-phase liquid chromatographic conditions. The separation of analyte and IS from interferenceswere performed on a Phenomenex analytical column, typeKinetex C18, 50 × 4.6 mm (length × inner diameter), with 2.6µm particle size and was maintained at 40°C in column oven. The mobile phase consisted of 0.01% (v/v) acetic acid in water: acetonitrile with gradient elution from 40 to 95% of acetonitrile composition over run time of 8.0 minutes. For gradient elution, the flow rate of the mobile phase was kept at 0.7 mL/min. The total chromatographic run time was 8.0 minutes. The auto sampler temperature was maintained at 5°C and the pressure of the system was in the vicinity of 2000 psi.
Ionization and detection of analyte and IS were carried out on a triple quadrupole mass spectrometer, AB SCIEX API-4000 (Toronto, Canada), equipped with electro spray ionization (TIS interface of the API-4000) operated in positive ion mode. Parent ion scan for exemestane (m/z:297.4) and exemestane-D2 (m/z:299.4) are shown in Fig. 1 and Fig. 2. Quantitation was performed using multiple reaction monitoring (MRM) mode to monitor parent → product ion (m/z) transitions for exemestane 297.4 → 121.2 (Fig. 3) and 299.4 →
123.2 for exemestane-D2 as IS (Fig. 4).
The source dependent parameters maintained were Gas 1 (Nebulizer gas): 40.0 psig; Gas 2
(heater gas flow): 60.0 psig; ion spray voltage (ISV): 5500.0V, turbo heater temperature (TEM): 400.0°C; interface heater (Ihe): ON; entrance potential (EP): 9.0V; collisional activated dissociation (CAD): 4 psig and curtain gas (CUR), nitrogen: 25 psig. The optimum values for compound dependent parameters like declustering potential (DP), collision energy (CE) and cell exit potential (CXP) were set as65, 25 and 22V, for exemestane and itsIS. Quadrupole 1 and 3 were maintained at unit mass resolution and the dwell time was set at 200 ms for analyte and 50 ms for IS. Analyst software version 1.5.2was used to control all parameters of LC and MS. Watson LIMSsoftware version 7.3 was used for regression and final data processing.
2.3 Standard stock, calibration standards and quality control sample preparation
The standard stock solution of exemestane (0.1mg/mL)was prepared by dissolving requisite amount of standard in methanol. Calibration standards and quality control (QC) samples were prepared by spiking (2% of the total plasma volume) blank plasma with serially diluted spiking solutions. Calibration curve standards were made at 0.100, 0.200, 0.500, 1.00, 4.00, 10.0, 20.0 and 40.0 ng/mL concentrations for exemestane, while quality control samples were prepared at fiveconcentration levels, viz. 30.0 ng/mL (HQC, high quality control), 15.0/3.00ng/mL (MQC1/2, medium quality control), 0.300ng/mL (LQC, low quality control) and 0.100ng/mL (LLOQ QC, lower limit of quantification quality control) for exemestane. Stock solution (0.100mg/mL) ofexemestane-D2internal standard was prepared by dissolving 2.0 mg ofISin appropriate volume of methanol. Its working solution 20.0ng/mL for exemestane-D2 was prepared by appropriate dilution of the stock solution in methanol. All the solutions (standard stock, calibration standards and quality control samples) were stored at 2–8°C until use.
2.4Sample extraction protocols
Prior to analysis, all frozen subject samples, calibration standards and quality control samples were thawed and allowed to equilibrate at room temperature.
Sample extraction
(rotospin) for 15 minutes at 50rpm. Samples were centrifuged at 4000rpm for 5 minutes at 10°C. The organic layer(2.0 mL) was separated and evaporated to dryness in a thermostatically controlled water-bath maintained at 55°C under a gentle stream of nitrogen. The dried samples were reconstituted with 200 µL of mobile phase, vortexed to mix for 10 seconds and 10 µL was used for injection in the chromatographic system.
2.5Method validation procedures
The bioanalytical method was fully validated following the USFDA guidelines.3 System suitability experiment was performed by injecting six consecutive injectionsusing an aqueous standard mixture of analyte andISat the start of each batch during method validation. System performance was studied by injecting one extractedblank (without analyteand IS) and one ULOQ and LLOQ sample with IS at the beginning of each analytical batch and before re-injecting any sample during method validation. Carry over effect of auto sampler was checked to verify any carryover of analyte at the start and at the end of each batch. The design of the experiment comprised of the following sequence of injections viz. extracted blank sample→ ULOQ sample →two extracted blank samples→ LLOQ sample.
Selectivity of the method towards endogenous plasma matrix components was assessed in ten different batches of plasma, of which, seven were normal K3EDTAplasma and one each of lipidemic,haemolyzedand sodium heparin plasma.Selectivity of the method towards commonly used medications in human volunteers was evaluated for Acetaminophen, Cetirizine, Domperidone, Ranitidine, Diclofenac, Ibuprofen,Nicotine and Caffeinein six different batches of human plasma having K3EDTAas an anticoagulant.
The linearity of the method was determined by analysis of three linearity curves containingeightnon-zero concentrations. Area ratio responses for exemestane/exemestane-D2 obtained from multiple reaction monitoring were used for regression analysis. Each calibration curve was analyzed individually by using least square weighted (1/x2) linear regression which was finalized during pre-method validation. A correlation coefficient (r2) value >0.99 was desirable for all the calibration curves. The lowest standard on the calibration curve was accepted as the lower limit of quantitation (LLOQ), if the analyte response was atleast five times more than that of the drug free (blank) extracted plasma. In addition, the analyte peak of LLOQ sample should be
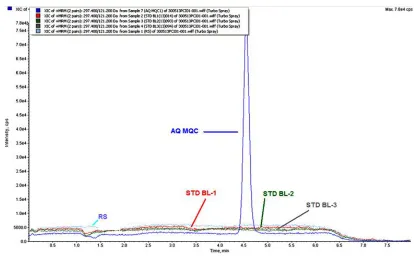
identifiable, discrete, and reproducible with a precision (%CV) not greater than 20% and accuracy within 80–120%. The deviation of the standards other than LLOQ from nominal concentration should not be more than ±15%. For determining intra-batch accuracy and precision, replicate analysis of plasma samples were performed on the same day. The run consisted of a calibration curve and six replicates of LLOQ QC, LQC, MQC2, MQC1 and HQC samples. Inter-batch accuracy and precision were assessed by analyzingthree precision and accuracy batches on three consecutive validation days. Precision (%CV) at each concentration level of the nominal concentration should not be greater than 15 %. Similarly, the mean accuracy should be within 85-115 %, except for the LLOQ where it can be from 80-120 % of the nominal concentration. Ion suppression/enhancement effects on the MRM LC-MS/MS sensitivity were evaluated by the post column analyte infusion experiment. A standard solution containing exemestane(at ULOQlevel)and ISwas infused post column via a ‘T’ connector into the mobile phase at 10µL/min employing an infusion pump. Aliquots of 10µL of extracted control plasma were then injected into the column by the autosampler.Any dip in the baseline upon injection of double blank plasma (without IS) would indicate ion suppression, while a peak at the retention time of the analyteorIS indicates ion enhancement.
Relative recovery, absolute matrix effectand process efficiency were assessed.All three parameters were evaluated at HQC, MQC1, MQC2 and LQC levels in six replicates.Relative recovery (RE) was calculated by comparing the mean peak area response of extracted samples (spiked before extraction) to that of unextracted samples (spiked after extraction) at each QC level. Recovery of IS was similarly estimated. Absolute matrix effect (ME) was assessed by comparing the mean peak area response of unextracted samples (spiked after extraction) with a mean peak area of neat standard solutions. Overall ‘process efficiency’ (%PE) was calculated as (ME x RE)/100.
cycles) stability experiments were performed at LQC and HQC level using six replicates. Freeze-thaw stability was evaluated by successive cycles of freezing (at -20°C and -70°C) and thawing (without warming) at room temperature. Long term stability of spiked plasma samples stored at -20°C and -70°C was also studied at both these levels. The samples were considered stable if the deviation from the mean calculated concentration of freshly thawed quality control samples was within ±15.0%. To authenticate ruggedness of the proposed method, it was performedwithtwoprecision and accuracy batches. The first batch was analyzed by different analyst whilethe secondbatch was studied on two different columns. Dilution integrity experiment was evaluated by spiking the QC sample at200ng/mL concentrationfor exemestanein the screened plasma. The precision and accuracy of dilution integrity standards at 1/10thdilution was determined by analyzing the samples against calibration curve standards.
2.6Bioequivalence study designand incurred sample reanalysis
The design of the study comprised of “An open label, balanced, randomized, two-treatment, two-sequence, two-period, single-dose, crossover, oral bioequivalence study of exemestane tablets, 25 mg manufactured by Indian company and Aromasin® (exemestane) tablets 25 mg in normal, healthy, adult, human, postmenopausal/surgically sterile female subjects under fasting and fed conditions.”.Plasma from the blood samples collected, was separated by centrifugation and kept frozen at -20°Ctill completion of the period and then at -70°C until analysis.An incurred sample reanalysis (assay reproducibility test) was conducted by a computerized random selection of subject samples, 10% of total sampleswere analyzed for the Incurred sample reanalysis experiment.The selection criteria included minimum two samples per period, which were near to the Cmax and the elimination phase in the pharmacokinetic profile of the drugs. The results obtained were compared with the data obtained earlier for the same sample using the same procedure. The percent change in the valueshould not be more than ±20%.
100
values
initial
and
repeat
of
Mean
value
Initial
–
ue
Repeat val
%Change
2.7 Statistical analysis
The pharmacokinetic parameters of exemestanewere estimated by non-compartmental model using WinNonlin software version 5.2.1 (Pharsight Corporation, Sunnyvale, CA, USA). The Cmax values and the time to reach the maximum plasma concentration (Tmax) were estimated directly from the observed plasma concentration vs. time data. The area under the plasma concentration–time curve from time 0 to 120 h (AUC0-120) was calculated using the linear trapezoidal rule. The AUC0-inf was calculated as:AUC0-inf = AUC0-120 + Ct/Kel,where Ct is the last plasma concentration measured and Kel is the elimination rate constant; Kel was determined using linear regression analysis of the logarithm linear part of the plasma concentration–time curve.The t1/2 was calculated as: t1/2 = ln2/Kel. To determine whether the test and reference formulations were pharmacokinetically equivalent, Cmax, AUC0-120, and AUC0-inf and their ratios (test/reference) using log transformed data were assessed; their means and 90% CIs were analyzed by using SAS® software version 9.1.3 (SAS Institute Inc., Cary, NC, USA). The drugs were considered pharmacokinetically
equivalent if the difference between the compared parameters was statistically non-significant (P ≥ 0.05) and the 90% confidence intervals (CI) for these parameters fell within 80 to 125%.
3. RESULTS AND DISCUSSION 3.1 Method development
To develop a selective, rugged and a reliable method for theestimation of exemestanein human plasma, the three commonly used extraction procedures were systematically investigated. The chromatographic and mass spectrometric conditions were suitably optimized to get the desired sensitivity, selectivity and a good linearity in regression curves.
Mass spectrometry
an intense protonated molecular ion at m/z 297.4 under positive turbo ion spray ionization. The collision-induced dissociation of this ion formed a distinctive product ion at m/z 121.2. The selected reaction monitoring, based on the m/z 297.4→ 121.2transition, was used for exemestane.This allowed for a lower limit of quantitation of 0.100ng/mL for exemestaneusing a 300μL plasma sample and
10μL injection into the Shimadzu SIL HTcautosampler coupled to a AB SciexAPI-4000triple quadrupolemass spectrometer.Interferences were separated chromatographically from exemestane by using gradient elution pattern and ultimately eliminating the background noisethat was produced from blank human plasma extraction. Initially, the precursor and product ions were optimized by infusing 200ng/mL solutions in the mass spectrometer between m/z 100 and 550 range. Q1 MS full scan spectra for exemestaneand itsIS predominantly contained protonated precursor [M+H] +ions at m/z297.2 and 299.2 respectively.The most abundant and consistent commonproduct ions in Q3 MS spectra for exemestaneand IS were observed at
m/z121.2 and 123.2by applying collision energy
of 25eV.The source dependent and compound dependent parameters were suitably optimized to obtain a consistent and adequate response for the analyte. A dwell time of 200ms for the drugand 50 ms for IS was adequate and no cross talk was observed between their MRMs.
Optimization of extraction technique
Reported procedures for the estimation of exemestane in human plasma have used either liquid-liquid extraction or solid phase extraction for sample preparation with little or no information on ion suppression or matrix interference. Considering the steroidal moiety in the chemical structure of analyteand the high logP value;liquid-liquid extraction was tried by using the various combinations of organic solvents likediethyl ether, ethyl acetate, methyl tert- butyl ether, n-Hexane and n-Heptane.Mixture of ethyl acetateand n-Hexane in proportion of 80:20%v/vgave good response and desiredrecovery.After selective extraction of analyte, the organic supernatant layer was separated and evaporated to dryness. To reconstitute the final product ammonium acetate, acetic acid and ammonium formate was tried using various combinations with acetonitrile. The samples were reconstituted with initial mobile phase composition as 0.01% (v/v)acetic acid in water: acetonitrile (20:80 %v/v) which provided help to improve the
sensitivity, compatibility and reproducible response.
Optimization of chromatographic conditions
plasma (double blank), at ULOQ and LLOQ for exemestane in Fig. 5demonstrates the selectivity of the method. The chromatograms showed acceptable peak shape for the drug.
Ideally, anisotope labeled stable standard should be the first-choice as internal standard, to minimize analytical variation due to solvent evaporation, the integrity of the chromatographic separation and ionization efficiency.Exemestane-D2was the deuterated compound selected as an internal standard in the present work. It had similar chromatographic behavior and was easily separated and eluted along with the analyte. There was no effect of IS on analyte recovery, sensitivity or ion suppression. Optimized method was evaluated for interference by the presence of Lysophospholipid(Figure not shown) and post column ionization impact as shown in Fig. 6. The method was found successfully separating the interferences causing any ionization impact.
3.2 Assay performance and validation
Throughout the method validation, the precision (%CV) of the system suitability test was observed ≤ 1.86%for analyte RT, IS RT and Area ratio of analyte andIS, whilethe signal to noise ratio for system performance was ≥ 23.9. A Carry-over evaluation was performed in each analytical run so as to ensure that it does not affect the accuracy and the precision of the proposed method. No enhancement in the response was observed in double blank (without analyte and IS) after subsequent injection of highest calibration extracted standardat the retention time of analyteand IS. All three calibration curves were linear over the concentration range of 0.100-40.0ng/mL for exemestane. A straight-line fit was made through the data points by the least square regression analysis and a constant proportionality was observed. The regression was performed by using the Watson LIMS (Laboratory Information Management System) software, version 7.3 to get higher throughput
and highest integrity of data without human intervention. The calibration curve (fitted by first order y = ax + b, where a=slope, b=intercept, x=concentration and y=peak area ratio of drug to IS) is plotted as the peak area ratio (drug to IS) on Y-axis vs. the nominal concentration of drug on X-axis.
The accuracy and precision (%CV) for the calibration curve standards were found within ±15.0% and 15.0%respectively. Thelowest concentration (LLOQ) in the standard curve that can be measured with acceptable accuracy and precision was found to be 0.100ng/mL concentrationfor exemestanein plasma at a signal-to-noise ratio (S/N) of ≥ 23.
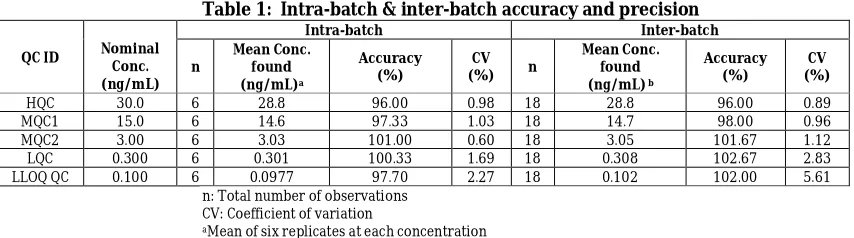
The intra-batch and inter-batch precision and accuracy were established from validation runs performed at HQC, MQC-1, MQC-2, LQC and LLOQ QC levels (Table 1). The intra-batch precision (%CV) was observed ≤ 2.27%and the accuracy was within 96.0 to 101.0%. For the inter-batch experiments, the precision was observed ≤ 5.61% and the accuracy was within 96.0 to 102.7%.
The stability ofexemestaneand IS in human plasma and stock solutions were examined under different storage conditions. Samples for short-term stability remained stableup to06h, while the stock solutions of drugand ISwere stable for minimum of 71 days at refrigerated temperature of5°C. Analytein control human plasma (bench top) was stable for at least06h at 25°C and for minimum of five freeze and thaw
cycles at –20°C and –70°C. Spiked plasma samples stored at –70°C for long term stability experiment were found stable for a minimum period of 70 days.Autosampler stability (wet extract) of the spiked quality control samples maintained at 5 °C was determined up to 91h without significant drug loss. Different stability experiments in plasma at two QC levels;with the values for percent changes are shown in Table 3.
Method ruggedness was evaluated using re-injection of analyzed samples on different column of the same make, re-injection of analyzed samples on same make Mass spectrometer coupled with HPLC and also with different analyst. The precision (%CV) and accuracy values for different column was found
≤ 2.24% and89.7 to 103.7% respectively at all four quality control levels for exemestane.The dilution integrity experiment was performed with an aim to validate the dilution test to be carried out on higher analyte concentration above the upper limit of quantification (ULOQ), which may be encountered during real subject sample analysis. The precision for dilution integrity of 1/10th dilution were 2.09%, while the accuracy result was97.5%, which is well within the acceptance limit of 15% for precision (%CV) and 85 to 115% for accuracy.
3.3 Application to a bioequivalence study and incurred sample reanalysis
The validated method has been successfully used to quantify exemestaneconcentration in human plasma samples after administration of a tablet dose of test and referenceformulation of 25 mg exemestane under fasting and fed conditions in postmenopausal or surgically sterile female volunteers. The method was sensitive enough to monitor the exemestaneplasma concentration up to 24h. In all,more than 6000subject samples,excluding the calibration, QC, volunteer samples and ISR samples were run and analyzed and the precision and accuracy were well within the acceptable limits.
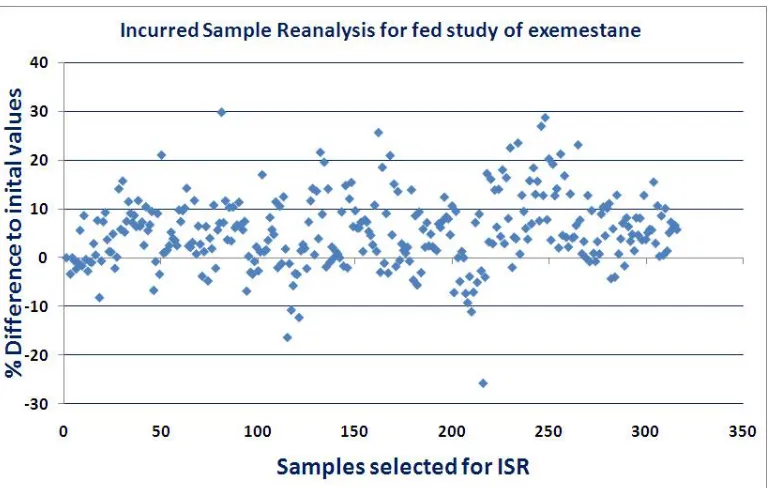
Incurred sample reanalysis (ISR) study has now become anessential part of the bioanalytical process to assess the quality of bioanalytical assays. It reaffirms the reproducibility and reliability of a validated bioanalytical method. Total 10% of samples were selected for ISR analysis.For the incurred samples studied in both fasting and fed studies, more than 92% and
95% samples,respectively;showed % change for assay reproducibility within ±20 %. This authenticates the reproducibility of the proposed method. Fig.7and Fig.8 represents the variation to initial values during ISR analysis is within the vicinity and range of ±20 % difference for more than 2/3rd samples.
3.4 Comparison with reported methods
The method presented has the highest extensive range of linearity 0.100 to 40.0 ng/mL (400 times) compared to reported methods for exemestanein human plasma without derivatization requirement4-8. The plasma volume for sample preparation is 300µL which is considerably less or similar to others reported method7-9. The stable labeled internal standard was used in this work which provided excellent data consistency in sample extraction and acquisition, which was not used in other reported methods7-8. The on-column loading of exemestaneat LLOQ was only 1.5pg per sample injection volume, which is significantly lower compared to all other reported methods8-10. The presented method was validated and its application to study sample analysis was performed by using the Watson LIMS software, which provided excellent data integrity, which are essential requirements of current regulatory bodies. None of the method and application werepresented with the same. The results and discussion of incurred sample reanalysis, which was obtained after implementing the presented method was not discussed or presentedin any of the reported methods7-10.
4. CONCLUSIONS
precision, accuracy and high throughput. Data processing was done by using the LIMS software which gives the highest data integrity during the method validation and study sample analysis. The method involved a sample preparation by liquid–liquid extraction. The analytical separation was followed bygradient chromatographic separation in 8.0minutes. The validated method was found to be specific, sensitive, accurate and precise. The established LLOQ is sufficiently low to conduct a pharmacokinetic study with 25mg test formulation of exemestane in healthy
postmenopausal/ surgically sterile female volunteers.
ACKNOWLEDGEMENTS
The authors are thankful to the Director, Mr. Apurva Shah and chief operating officer (COO) Dr. VenuMadhav of Veeda Clinical Research (India) for providing infrastructure facilities to carry out this work.The authors are thankful toscientistsMr. Dharmesh Patel, Mr. Pritesh Contractor, Mr. MahendraPateland Mr. JagdishPrajapati fortheir support and quality execution of our research work.
Table 1: Intra-batch & inter-batch accuracy and precision
QC ID Nominal
Conc. (ng/mL)
Intra-batch Inter-batch
n
Mean Conc. found (ng/mL)a
Accuracy (%)
CV
(%) n
Mean Conc. found (ng/mL) b
Accuracy (%)
CV (%)
HQC 30.0 6 28.8 96.00 0.98 18 28.8 96.00 0.89
MQC1 15.0 6 14.6 97.33 1.03 18 14.7 98.00 0.96
MQC2 3.00 6 3.03 101.00 0.60 18 3.05 101.67 1.12
LQC 0.300 6 0.301 100.33 1.69 18 0.308 102.67 2.83
LLOQ QC 0.100 6 0.0977 97.70 2.27 18 0.102 102.00 5.61
n: Total number of observations CV: Coefficient of variation
aMean of six replicates at each concentration
bMean of six replicates for three precision and accuracy batches
Table 2: Absolute matrix effect, relative recovery and process efficiency
QC ID Nominal Conc.
(ng/mL)
Intra-batch Inter-batch
n
Mean Conc. found (ng/mL)a
Accuracy (%)
CV
(%) n
Mean Conc. found (ng/mL) b
Accuracy (%)
CV (%)
HQC 30.0 6 28.8 96.00 0.98 18 28.8 96.00 0.89
MQC1 15.0 6 14.6 97.33 1.03 18 14.7 98.00 0.96
MQC2 3.00 6 3.03 101.00 0.60 18 3.05 101.67 1.12
LQC 0.300 6 0.301 100.33 1.69 18 0.308 102.67 2.83
LLOQ QC 0.100 6 0.0977 97.70 2.27 18 0.102 102.00 5.61
CV: coefficient of variation
aMean area ratio response of six replicate samples prepared in mobile phase (neat samples) bMean area ratio response of six replicate samples prepared by spiking in extracted blank plasma cMean area ratio response of six replicate samples prepared by spiking before extraction
100
A
B
d
100
B
C
e
100
=
ME
RE
100
A
C
f
Table 3: Stability results for Exemestane under different conditions (n=6)
Storage Condition Level Mean stability
sample (ng/mL) ± SD % Change
Bench top stability, 06h HQC 27.8 ± 0.223 -7.33
LQC 0.300 ± 0.00707 0.00
Dry extract stability; 88h HQC 27.9 ± 0.973 -7.00
LQC 0.302 ± 0.0208 0.67
Wet extract stability; 91 h HQC 27.9 ± 0.350 -7.00
LQC 0.307 ± 0.00789 2.33
Freeze & thaw stability; 5 Cycles, -20°C HQC 28.3 ± 1.12 -5.67
LQC 0.313 ± 0.00824 4.33
Freeze & thaw stability; 5 Cycles, -70°C HQC 28.2 ± 0.941 -6.00
LQC 0.298 ± 0.0150 -0.67
Long term stability in plasma; 70 days, -70°C HQC 26.3 ± 0.172 -12.33
LQC 0.308 ± 0.00417 2.67
Stability of Analyte in blood; 2 h HQC NA -1.98
LQC NA -1.53
SD: Standard deviation
n: Number of replicates at each level
Fig. 2: Product ion mass spectra of Exemestane
(m/z297.4 → 121.2, scan range 50-350amu) in positive ionization mode
Fig. 4: Product ion mass spectra of Exemestane-D2
(m/z299.4 → 123.2, scan range 100-350amu) in positive ionization mode
Fig. 5: MRM ion-chromatograms of (A) Double blank plasma (without ISTD), (B) exemestaneat ULOQ and ISTD, (C) exemestaneat LLOQ and ISTD,
Fig. 6: Post-column infusion experiment to evaluate ionization impact of the interferences from extracted samples
Fig. 8: Incurred sample reanalysis results and variation to initial values for exemestane fed study
REFERENCES
1. Aromasin drug product information,
Available from:
http://www.rxlist.com/aromasin-drug/indications-dosage.htm [cited 2014 09/14].
2. Aromasin drug product information,
Available from:
http://www.rxlist.com/aromasin-drug/clinical-pharmacology.htm [cited 2014 09/14].
3. Guidance for Industry. Bioanalytical Method Validation, US Department of Health and Human Services, Food and Drug Administration, Center for Drug Evaluation and Research, Rockville, MD, 2001.
4. De Albuquerque Cavalcanti G, Garrido BC, Leal FD, Padilha MC, De La Torre X and De Aquino Neto FR. Detection of new urinary exemestane metabolites by gas chromatography coupled to mass spectrometry, Steroids. 2011;76:1010– 1015.
doi:10.1016/j.steroids.2011.04.001. 5. De Cavalcanti GA, Garrido BC, Leal FD,
Padilha MC, De La Torre X and Pereira HMG. Analysis of exemestane and 17-β -hydroxyexemestane in human urine by gas chromatography/mass spectrometry: Development and validation of a method using MO-TMS
derivatives, Rapid Commun. Mass Spectrom. 2010;24:3297–3302. 6. Mareck U, Geyer H, Guddat S, Haenelt N,
Koch A and Kohler M. Identification of the aromatase inhibitors anastrozole and exemestane in human urine using liquid chromatography / tandem mass spectrometry, Rapid Commun. Mass Spectrom. 2006;20:1954–1962. doi:10.1002/rcm.
7. Breda M, Pianezzola E and Benedetti MS. Determination of exemestane, a new aromatase inhibitor, in plasma by high-performance liquid chromatography with ultraviolet detection. J Chromatogr. 1993;620:225– 231.
8. Ksycińska H, Buś-Kwaśnik K, Szlagowska A and Rudzki PJ. Development and validation of a
sensitive liquid
chromatography/tandem mass spectrometry method for the determination of exemestane in human plasma. J Chromatogr B Anal Technol Biomed Life Sci. 2011;879:1905–1910. doi:10.1016/j.jchromb.2011.05.015. 9. Cenacchi V, Baratte S, Cicioni P, Frigerio
Anal. 2000;451–460. doi:10.1016/S0731-7085(00)00235-1. 10. Corona G, Elia C, Casetta B, Diana C,
Rosalen S and Bari M. A liquid chromatography-tandem mass spectrometry method for the simultaneous determination of exemestane and its metabolite 17-dihydroexemestane in human plasma. J
Mass Spectrom. 2009;44:920–928. doi:10.1002/jms.1566.