Submitted15 July 2016 Accepted 15 March 2017 Published2 May 2017 Corresponding author Alison A. Motsinger-Reif, [email protected]
Academic editor Ryan Hernandez
Additional Information and Declarations can be found on page 16
DOI10.7717/peerj.3187
Copyright 2017 Marvel et al.
Distributed under
Creative Commons CC-BY 4.0
OPEN ACCESS
Common and rare genetic markers of
lipid variation in subjects with type 2
diabetes from the ACCORD clinical trial
Skylar W. Marvel1,*, Daniel M. Rotroff1,2,*, Michael J. Wagner3, John B. Buse4,
Tammy M. Havener3
, Howard L. McLeod5
, Alison A. Motsinger-Reif1,2and The ACCORD/ACCORDion Investigators
1Bioinformatics Research Center, North Carolina State University, Raleigh, NC, United States of America 2Department of Statistics, North Carolina State University, Raleigh, NC, United States of America 3Center for Pharmacogenomics and Individualized Therapy, University of North Carolina at Chapel Hill,
Chapel Hill, NC, United States of America
4Division of Endocrinology, University of North Carolina School of Medicine, Chapel Hill, NC,
United States of America
5Moffitt Cancer Center, Tampa, FL, United States of America *These authors contributed equally to this work.
ABSTRACT
Background. Individuals with type 2 diabetes are at an increased risk of cardiovascular disease. Alterations in circulating lipid levels, total cholesterol (TC), low-density lipoprotein (LDL), high-density lipoprotein (HDL), and triglycerides (TG) are heritable risk factors for cardiovascular disease. Here we conduct a genome-wide association study (GWAS) of common and rare variants to investigate associations with baseline lipid levels in 7,844 individuals with type 2 diabetes from the ACCORD clinical trial.
Methods. DNA extracted from stored blood samples from ACCORD participants were
genotyped using the Affymetrix Axiom Biobank 1 Genotyping Array. After quality control and genotype imputation, association of common genetic variants (CV), defined as minor allele frequency (MAF)≥3%, with baseline levels of TC, LDL, HDL, and TG was tested using a linear model. Rare variant (RV) associations (MAF<3%) were conducted using a suite of methods that collapse multiple RV within individual genes.
Results. Many statistically significant CV (p<1×10⁻⁸) replicate findings in large meta-analyses in non-diabetic subjects. RV meta-analyses also confirmed findings in other studies, whereas significant RV associations withCNOT2,HPN-AS1, andSIRPDappear to be novel (q<0.1).
Discussion. Here we present findings for the largest GWAS of lipid levels in people
with type 2 diabetes to date. We identified 17 statistically significant (p<1×10⁻⁸) associations of CV with lipid levels in 11 genes or chromosomal regions, all of which were previously identified in meta-analyses of mostly non-diabetic cohorts. We also identified 13 associations in 11 genes based on RV, several of which represent novel findings.
SubjectsBioinformatics, Genomics, Diabetes and Endocrinology, Translational Medicine, Metabolic Sciences
INTRODUCTION
Cardiovascular diseases (CVD) remain the leading cause of death worldwide (Mendis, Puska & Norrving, 2011). Individuals with type 2 diabetes mellitus are at an increased risk of CVD compared to individuals without type 2 diabetes (Malmberg et al., 2000). Approximately 65% of people with diabetes aged 18 years or older have increased low-density lipoprotein (LDL) levels or use cholesterol-lowering medications, and are at a significantly increased risk of CVD, stroke, and other adverse events (Centers for Disease Control and Prevention, 2014). Associations between plasma lipid concentrations and genetic markers are of great interest because total cholesterol (TC), LDL, high-density lipoprotein cholesterol (HDL) and triglycerides (TG) are heritable risk factors for cardiovascular disease (Kathiresan et al., 2007;Vattikuti, Guo & Chow, 2012) and identification of the genes involved can lead to novel insights into the biology of lipid regulation and its effects on cardiovascular risk. Large-scale genome-wide association studies of plasma lipid levels have been conducted in populations composed largely of non-diabetic subjects, and have identified multiple genetic variants that affect lipid levels, many of which also affect cardiovascular risk (Global Lipids Genetics Consortium, 2013). However, given the altered hormonal and metabolic milieu in individuals with type 2 diabetes as well as the high incidence of dyslipidemia in this group, it is reasonable to ask whether the effects of known genetic risk factors are the same in individuals with type 2 diabetes as in the general public, and/or whether additional, novel factors may contribute to the heightened risk in this group. Identifying genetic variants associated with differences in TC, TG, LDL, and HDL in people with type 2 diabetes may increase our understanding of biological mechanisms involved in diabetic dyslipidemia and may guide the development of more targeted therapies and ultimately lower the risk of CVD in people with type 2 diabetes.
The Action to Control Cardiovascular Risk in Diabetes (ACCORD) clinical trial was designed to be the definitive clinical trial comparing the risks and benefits of treatment strategies targeting normal glycemic levels, normal blood pressure and intensively managing dyslipidemia with combined statin-fenofibrate therapy versus strategies with standard targets and approaches in patients with type 2 diabetes at high risk for CVD (Goff et al., 2007;
Buse, 2007) The clinical trial was conducted at clinical centers across the United States and Canada, and enrolled 10,251 middle-aged and older participants following them for up to eight years. No benefit on the combined CVD endpoint of time to event of first heart attack, stroke or CVD mortality was evident for intensive glycemic, blood pressure or lipid manage-ment; furthermore there was an increase in mortality associated with targeting normal glu-cose levels (Gerstein et al., 2007;Ginsberg et al., 2007;ACCORD Study Group, 2010a). Given the known heritability of type 2 diabetes, hypertension and blood lipid levels, it is important to ask whether genetic factors may prove useful in predicting which individuals will respond positively to intensive treatment.
have already identified more than 150 loci affecting blood lipids (Teslovich et al., 2010; Wa-terworth et al., 2010;Global Lipids Genetics Consortium, 2013;Liu et al., 2014), the analysis presented here represents the largest analysis to date comprised entirely of individuals with type 2 diabetes. The current study thus allows us to determine whether the overall constel-lation of loci affecting blood lipid levels is broadly similar between individuals with type 2 diabetes at a high risk of CVD and the general population, and has the potential to identify novel or known loci that have a larger effect on lipid levels in individuals with type 2 diabetes.
METHODS
Study population
The ACCORD trial (NCT00000620;https://clinicaltrials.gov/ct2/show/NCT00000620) had a double 2 ×2 factorial design, consisting of 10,251 recruited subjects with type 2 diabetes mellitus and either a history of cardiovascular disease (CVD) or at least two known risk factors for cardiovascular disease, such as documented atherosclerosis, albuminuria, dyslipidemia, hypertension, smoking, or obesity (Buse, 2007). Subjects were randomized to either intensive or standard glycemia treatment strategies (targeting HbA1c < 6.0 vs. HbA1c between 7.0 and 7.9). A subset of 4,733 subjects were further randomized to intensive versus standard blood pressure management (targeting systolic blood pressure of <120 mm Hg versus <140), and the remaining 5,518 subjects were randomized to intensive versus standard lipid management (fenofibrate versus placebo, with all subjects on simvastatin) (ACCORD Study Group, 2010b). The age range for subjects with a history of CVD was 40–79, and for those with no prior CVD history, 55–79. Body mass index (BMI) was limited to a maximum of 45, and serum creatinine to 1.5 mg per deciliter. Median length of follow-up was 4.7 years, and the primary outcome was the first occurrence of nonfatal myocardial infarction or nonfatal stroke or death from cardiovascular causes.
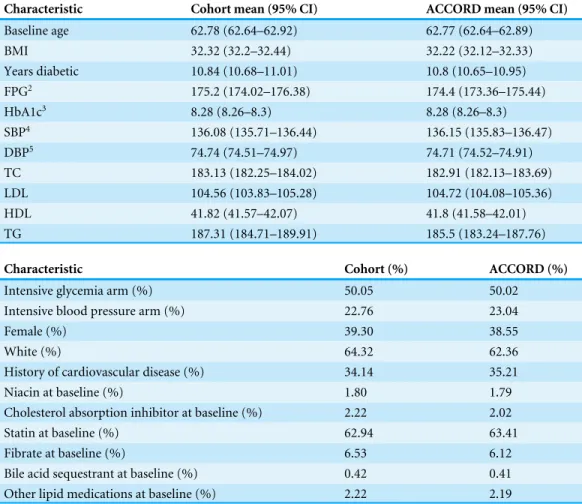
Table 1 Baseline characteristics of patients.
Characteristic Cohort mean (95% CI) ACCORD mean (95% CI)
Baseline age 62.78 (62.64–62.92) 62.77 (62.64–62.89)
BMI 32.32 (32.2–32.44) 32.22 (32.12–32.33)
Years diabetic 10.84 (10.68–11.01) 10.8 (10.65–10.95)
FPG2 175.2 (174.02–176.38) 174.4 (173.36–175.44)
HbA1c3 8.28 (8.26–8.3) 8.28 (8.26–8.3)
SBP4 136.08 (135.71–136.44) 136.15 (135.83–136.47)
DBP5 74.74 (74.51–74.97) 74.71 (74.52–74.91)
TC 183.13 (182.25–184.02) 182.91 (182.13–183.69)
LDL 104.56 (103.83–105.28) 104.72 (104.08–105.36)
HDL 41.82 (41.57–42.07) 41.8 (41.58–42.01)
TG 187.31 (184.71–189.91) 185.5 (183.24–187.76)
Characteristic Cohort (%) ACCORD (%)
Intensive glycemia arm (%) 50.05 50.02
Intensive blood pressure arm (%) 22.76 23.04
Female (%) 39.30 38.55
White (%) 64.32 62.36
History of cardiovascular disease (%) 34.14 35.21
Niacin at baseline (%) 1.80 1.79
Cholesterol absorption inhibitor at baseline (%) 2.22 2.02
Statin at baseline (%) 62.94 63.41
Fibrate at baseline (%) 6.53 6.12
Bile acid sequestrant at baseline (%) 0.42 0.41
Other lipid medications at baseline (%) 2.22 2.19
Notes.
1Student’st-test. 6Fisher’s exact test.
component of ACCORD uses the multilevel approach recommended by the NHLBI (National Heart Institute et al., 1997).
Genotyping
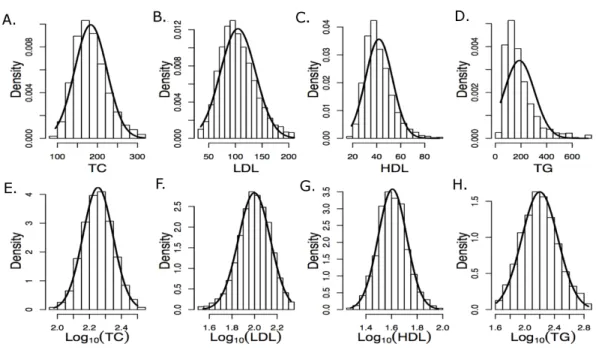
Figure 1 Histograms of raw and log10transformed baseline lipid levels Normal distributions com-puted using the baseline means and standard deviations are overlaid. (A–E) depict measured values and (E–H) depict log-transformed values.
version of the BRLMM-P algorithm that adapts generic prior cluster positions to the data using an EM algorithm.
The Axiom Biobank Genotyping Array from Affymetrix includes∼246,000 common genetic variants selected to optimize genome-wide coverage for association in addition to∼335,000 variants focused on the coding portion of the genome, and including non-synonymous, frameshift, indel and splice variants as well as other known loss-of-function and disease causing mutations. Most of this second group of variants was identified by exome sequencing in up to 26,000 individuals, and the majority of them are uncommon or rare. Additional variants to cover known eQTLs and pharmacogenomics markers are also included on the array. A total of 628,679 probes were genotyped. After genotype quality control, genotypes were available for 583,613 variants, of which 89,212 were monomorphic. After imputation based on 1,000 genomes haplotype data, an additional 26,862,499 imputed variants with an ‘‘info’’ metric > 0.5 were retained for association testing. The genotype information is available in dbGaP (http://www.ncbi.nlm.nih.gov/dbgap).
Data processing
Quality control
Genotypes were subjected to rigorous quality control based on genotyping quality metrics, duplicate concordance, Mendelian segregation (in HapMap trios included on the genotyping plates), Hardy–Weinberg Equilibrium, and predicted gender (seeSupplemental Material). Cryptic relatedness was identified using KING (v1.4), and one member of each
pair with a kinship coefficient > 12
5
2 =0.1768 was removed from the analysis data set
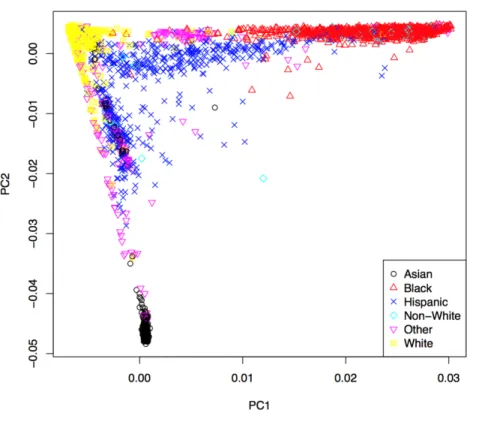
Figure 2 First two principal components with markers indicating self-reported ethnic backgrounds.
the genotype data were computed using EIGENSTRAT (v4.2) and were used to control population stratification (Price et al., 2006). The first two PCs are shown inFig. 2, where the marker colors and labels represent the self-reported ethnic background for each sample. Genotype imputation was accomplished using a two-step approach where the genotype calls were first pre-phased using SHAPEIT2 (v2.r778) and then imputation was conducted using IMPUTE2 (v2.3.0) (Howie, Donnelly & Marchini, 2009;Howie, Marchini & Stephens, 2011;Delaneau, Marchini & Zagury, 2012;Delaneau, Zagury & Marchini, 2013). Both steps used the 1,000 Genomes Phase1 integrated haplotypes reference panel (release date Dec 2013) from the IMPUTE2 website. Probes significantly deviating from HWE (χ2>19.51,
Covariate selection
Here, we take a combined approach to variable selection to address potential confounding variables. Some covariates are forced into the model based on the results of previous studies or on expert knowledge related to the phenotype, while variable selection, via backwards selection, is subsequently performed on candidate variables to identify covariates specific to the ACCORD dataset. Covariate names and descriptions can be found in Tables S3 and S4. A substantial proportion of the cohort was taking lipid lowering medications at the time base-line lipid measurments were taken (e.g., 63% were on a statin). Lipid lowering concomitant medications were forced into the model to prevent confounding of the baseline lipid measurements. The percentage of the cohort on each of these lipid lowering medications is inTable 1and additional information is in Table S3. Years since diabetes diagnosis and years of hyperlipidemia diagnosis were mean imputed due to large numbers of patients missing those records. Only samples with complete phenotype and covariate data were retained. A correlation matrix for all covariates is shown inFig. S18. Three pairs of covariates were flagged for high correlation, and one of each pair was removed prior to analysis: glomerular filtration rate and serum creatinine were negatively correlated (r= −0.77), systolic and diastolic blood pressure were positively correlated (r=0.53) and BMI and waist circum-ference were positively correlated (r=0.63). SeeSupplemental Materialfor additional information regarding covariate selection.
Heritability approximation
The phenotypic variation explained by genome-wide variants is estimated using the software tool genome-wide complex trait analysis (GCTA; v1.22) (Yang et al., 2011). An estimate of a phenotype’s heritability can help to determine if the results from association tests seem plausible. Additional information regarding the heritability approximation is in the Supplemental Material.
Common variant analysis
Association between a phenotype and single common variant is tested using the linear regression model
y=α0+Xα+βgg+,
wherey is the phenotype, α0 is the intercept,X are the covariates,α are the covariate
regression parameters,βg is the regression parameter for the variant,g is the additively
coded genotype andis the error term. Genotyped variants are tested using PLINK, where
gi∈ {0,1,2}is the number of minor alleles for theith individual. Imputed variants are tested
using a linear regression model in the statistical programming language, R, wheregi=
pi(Aa)+2pi(aa)is the dosage score computed from the posterior probabilities for genotypes
Aaandaa(R Development Core Team, 2014).
Material. The results from the common variant tests were considered statistically significant based on ap<1×10⁻⁸.
Rare variant analysis
Current approaches can be commonly divided into burden and non-burden approaches. Burden tests collapse a set of rare variants from a region of interest (e.g., a gene) into a single variable, which is then tested for association with a phenotype. However, a major limitation of simple burden tests is that they cannot account for the possible direction (positive or negative association) of a rare variant effect (Wu et al., 2011). One non-burden rare variant test that allows for different directions and magnitudes of effects for each variant is the sequence kernel association test (SKAT) (Wu et al., 2011). The approach used here is to apply a suite of tests that are representative of commonly used methods in the literature that cover both burden and non-burden approaches.
Simple collapsing methods use indicator, proportion and weighted approaches chosen
a priorithat can easily be computed from genotype data. More sophisticated approaches can incorporate variant-specific information and variable thresholds for collapsing. Three burden tests are used here and are based on simple collapsing approaches. These methods first create a collapse score,c, and then test for association using the linear regression model
y=α0+Xα+βcc+,
whereyis the phenotype,α0is the intercept,Xare covariates,αare the covariate regression
parameters,βc is the regression parameter for the collapse score andis the error term.
Associationp-values are computed under the null hypothesisH0:βc =0. The selected
burden tests differ in howc is computed.
The first two tests are based on RVT1 and RVT2 originally proposed byMorris & Zeggini (2010). We adapted a slight change to RVT1 whereci= 6jgij
/2ni, which counts the total
number of rare alleles rather than the number of variants with rare alleles. In RVT2,ciis
simply an indicator functionci=I(ri>0). The third test uses a weighting scheme similar
to the one proposed in the weighted sum statistic (WSS) case-control method (Madsen & Browning, 2009). While burden tests use simple linear regression, SKAT uses a linear mixed model and tests for association with a variance-component score test (Wu et al., 2011). While SKAT has been found to be more powerful than burden tests when the variants have different directions of effect, it is less powerful when all variant effects are in the same direction. The balance between SKAT and burden tests was addressed by the optimal test, SKAT-O, where a combination of the two approaches is optimized (Lee, Wu & Lin, 2012). Additional information regarding the rare variant testing implemented here is in the Supplemental Material.
Here we use both SKAT and SKAT-O in addition to the three burden tests mentioned above. Only those variants <3% MAF were included in the rare variant approaches. The non-burden approaches were implemented using the R package ‘‘SKAT’’ (v0.95) (Lee, Miropolsky & Wu, 2013).
rate (FDR) (Storey, 2002) approach is not straightforward due to each gene having a set of
pvalues, one for each rare variant test. This complication can be resolved by combining the set ofp-values into a singlep-value for each gene, while accounting for the dependence ofp-values using the ‘‘correlated Lancaster procedure’’ described by Dai et al. to combine thep-values from each test into a singlep-value for each gene (Dai, Leeder & Cui, 2014). Combining the set ofp-values for each rare variant test into a singlep-value for each gene allows straightforward application of FDR controlling procedures. Computingq-values was done using the R package,q value(v1.36.0) (Dabney, Storey & Warnes, 2004). Additional information about combining the rare-variantp-values is in theSupplemental Material.
RESULTS
After all sample quality control steps a total of 7,844 individuals were included in the association analysis for TC (mg/dL), LDL (mg/dL), HDL (mg/dL) and TG (mg/dL) phenotypes. Heritability for each phenotype was approximated using the set of genotyped variants to construct the genetic relationship matrix (GRM). The phenotype, pruned covariates and GRM were used by GCTA to compute an approximate heritability of 11.7%, 11.3%, 43.7% and 14.0% for TC, LDL, HDL and TG, respectively.
Common variant analysis
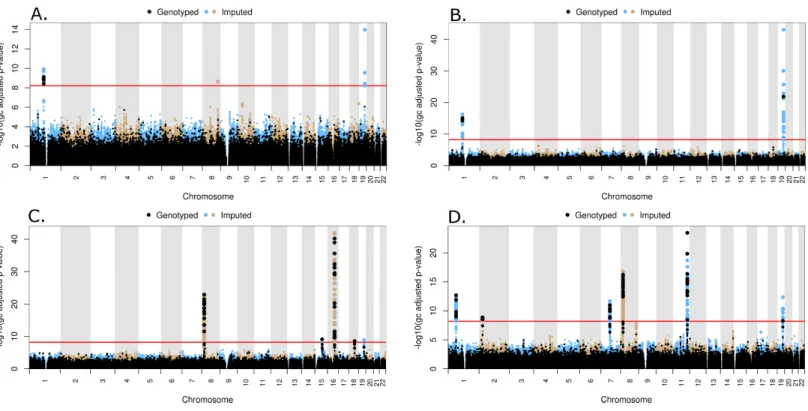
Figure 3 Manhattan plots for common variant analysisRed line indicates significantp-values (p=1×10⁻⁸). (A) Total cholesterol, (B) low
den-sity lipoprotein, (C) high denden-sity lipoprotein, (D) triglycerides.
19.82 Mb and 125.58 Mb on Chr 8, 116.65 Mb on Chr 11, and 45.41Mb on Chr 19 (Fig. 3D). The SNP (rs6982502) on Chr 8 was significantly out of HWE (p<1×10⁻⁵) in all populations combined. These SNPs are located in theANGPTL3,GCKR,MLXIPL,LPL,
TRIB1,ZNF259, andAPOEgenes, respectively (Table 2).
Rare variant analysis
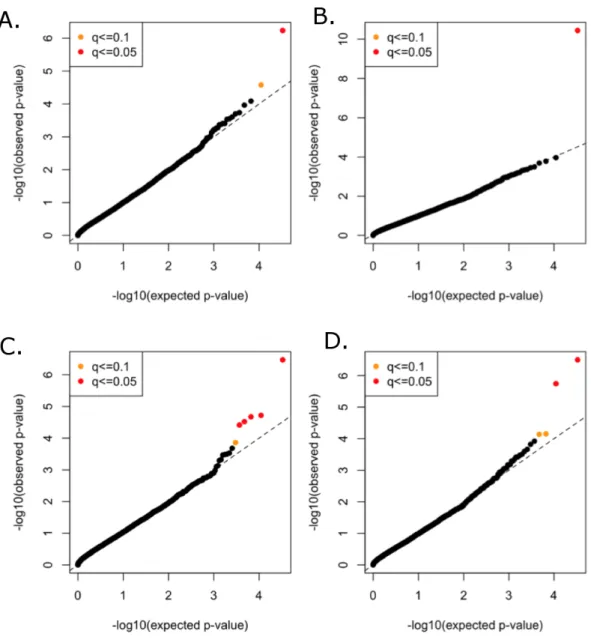
All functional variants (annotated based on GRCh37p13 build and retained those with accession numbers beginning with ‘‘NM’’ and having codes for stop-gain, missense, stop-loss, frameshift, cds-indel, splice-3 and splice-5) and a MAF < 3% were considered for incorporation into the gene-based, rare variant analysis. After QC, a total of 16,480 genes contained at least two variants below the MAF threshold. In total, 146,689 genotyped and 73,295 imputed variants went into the analysis, with median of nine variants per gene. Mean minor allele frequencies for all the rare variants in an individual gene ranged from 6.37e–05 to 2.53e–02. The suite of three burden and two nonburden tests were applied and the resultingp-values were combined using the correlated Lancaster procedure, as described above. QQ plots for each of the phenotypes are shown inFig. 4, where the marker colors indicateq-value significance thresholds.
A total of 11 genes were significantly associated with TC, LDL, HDL, or TG in the combined rare variant analysis (q<0.1), with the number of rare variants in these genes
ranging from two to 22 (Table 3). Variants in PCSK9 were associated with TC and LDL.
Table 2 Common variant genes of interest.
Locus Lead
marker
Chr GRCh37
pos. (Mb)
Associated trait(s)a
Major/minor allele
MAF Beta
sign
p-value HWE
p-value
ANGPTL3 rs67461605 1 63.07 TG GTTAATGTG/- 0.34 – 2×10⁻¹³ 0.1641
CELSR2 rs7528419 1 109.82 LDL, TC A/G 0.23 – 6×10⁻¹⁷ 0.3715
GCKR rs1260326 2 27.73 TG C/T 0.34 + 1×10⁻⁹ 3.70E–05
MLXIPL rs13240065 7 73.02 TG G/A 0.11 – 2×10⁻¹² 0.1131
LPL rs15285 8 19.82 HDL C/T 0.32 + 5×10⁻²⁴ 0.000496
rs75278536 19.82 TG T/G 0.09 – 1×10⁻¹⁷ 0.1483
TRIB1 rs28601761 8 126.5 TC C/G 0.38 – 2×10⁻⁹ 0.2015
rs6982502 125.48 TG T/C 0.41 – 1×10⁻⁸ 3.74E–09
ZNF259 rs964184 11 116.65 TG C/G 0.16 + 3×10⁻²⁴ 0.1834
LIPC rs1532085 15 58.68 HDL G/A 0.4 + 6×10⁻¹⁰ 0.003875
CETP rs247617 16 56.99 HDL C/A 0.3 + 2×10−43 1
LIPG rs4939884 18 47.17 HDL C/T 0.14 – 2×10⁻⁹ 0.2113
APOE rs7412 19 45.41 LDL, TC C/T 0.08 – 8×10−44 0.677
rs75627662 45.41 TG C/T 0.18 + 4×10⁻¹³ 0.1244
rs429358 45.41 HDL T/C 0.14 – 9×10⁻¹⁰ 6.34E–06
Notes.
Chr, chromosome; MAF, minor allele frequency; TC, total cholesterol; TG, triglycerides.
aPrimary trait listed first.
APOC3,PAFAH1B2,ANGPTL4,SIRPD, andUBE2L3were significantly associated with TG (Table 3).
DISCUSSION
Associations between lipid plasma concentrations and genetic variants have been of great interest because TC, LDL, HDL and TG are heritable risk factors for cardiovascular disease. Previous meta-analyses of genetic association studies involving multiple epidemiological and case-control cohorts have been conducted to identify genetic variants associated with specific lipid concentrations, but here we provide an analysis focused on genetic variants in a large cohort of subjects with type 2 diabetes and a high risk of CVD. Furthermore, we identify genes with rare variants (MAF < 3%) significantly associated with lipid concentrations.
Figure 4 Rare variant quantile–quantile plots.Quantile–quantile plots are shown for (A) TC (B) LDL (C) HDL (D) TG. Color indicatesq-value threshold.
were novel. A comparison of the ACCORD results with all of the significant results from the Global Lipids Genetics Consortium can be found inFile S1. Approximately 30% the loci yielding genome-wide significant levels of association with TC and LDL in the Global Lipids Genetics Consortium analysis and 35% of the loci similarly associated with HDL and TG yielded at least nominally significant levels of association (p< 0.05) with the same phenotypes in ACCORD.
Table 3 Rare variant genes of interest.
Genea Chr Associated trait(s)b Number of variantsc p-value q-value
PCSK9 1 LDL, HDL 22 (12) 4×10⁻¹¹ 1×10⁻⁷
LPL 8 HDL 16 (15) 3×10⁻⁵ 0.0301
APOC3 11 TG 2 (1) 3×10⁻⁷ 0.0018
PAFAH1B2 11 TG 3 (1) 7×10⁻⁵ 0.0775
CNOT2 12 HDL 2 (2) 2×10⁻⁵ 0.0283
CETP 16 HDL 18 (14) 4×10⁻⁷ 0.0014
HNF1B 17 HDL 5 (3) 1×10⁻⁴ 0.0848
ANGPTL4 19 TG, HDL 14 (12) 2×10⁻⁶ 0.0049
HPN-AS1 19 HDL 2 (2) 1×10⁻⁴ 0.0915
SIRPD 20 TG 5 (3) 8×10⁻⁵ 0.0775
UBE2L3 22 TG 2 (0) 4×10⁻⁵ 0.0636
Notes.
Chr, chromosome; TC, total cholesterol; TG, triglycerides.
aBold indicates potentially novel gene association. bPrimary trait listed first.
cTotal number of variants (# of genotyped variants).
TG in∼2,600 subjects (Diabetes Genetics Initiative of Broad Institute of Harvard and MIT et
al., 2007). Associations at genome-wide significant levels were found at common variants in APOE (with LDL), CETP (HDL), and GCKR (TG), and associations at suggestive levels were found in APOB (LDL), LPL (HDL and TG), LIPC (HDL), and APOA5 (TG). All of these genes were either known at the time to influence lipid levels or subsequently corroborated by the large GWAS meta-analyses, and all of these associations with the exception of ApoB were also found, at genome-wide significant levels, in the present study. Interestingly, previously reported heritability estimates for LDL, HDL, TC, and TG have approximated 25–70% (Kathiresan et al., 2007;Vattikuti, Guo & Chow, 2012) , whereas, we report lower heritability estimates, which may be due to the incorporation of different covariates in the present analysis.
Teslovich et al., 2010;Ota et al., 2011;Global Lipids Genetics Consortium, 2013;Aung et al., 2014). These genes are in high linkage disequilibrium, and although functional studies have demonstrated a clear role for apolipoprotein genes in regulating lipids (Ito et al., 1990;Rubin et al., 1991;Pennacchio & Rubin, 2003), additional studies are needed to fully understand how these genes influence disease. The results presented here contribute additional vali-dation to previously reported associations, while also indicating that the common genetic variant profiles associated with lipid levels are similar between individuals with and without type 2 diabetes, although individuals with type 2 diabetes are at increased risk of cardiovascular disease and dyslipidemia.
Missing heritability unaccounted for by traditional GWAS employing common variants has motivated the investigation of rare variants (Manolio et al., 2009). A traditional single-locus analysis approach applied to rare variants suffers from low power and a wide range of approaches that combine multiple rare variants into single tests are now available to address this problem (Bansal et al., 2010;Dering et al., 2011;Lee et al., 2014). Because each method has advantages and limitations, the approach implemented here applies a suite of tests that are representative of some of the more commonly used methods in the literature and span both burden and non-burden approaches.Table 3summarizes the findings of our baseline lipid rare variant analysis. Proprotein convertase subtilisin kexin 9 (PCSK9) was the only gene found to be associated with LDL in the rare variant analysis, and associations with this gene and LDL levels have been previously reported inLange et al. (2014)and a meta-analysis conducted byLiu et al. (2014). Interestingly, development of drugs targeting
PCSK9to lower LDL have been a high priority in the pharmaceutical industry, and based on promising results in clinical trials, the first drug targeting PCSK9(Evolocumab) was recently recommended for expedited approval by the US Food and Drug Administration (Koren et al., 2014;Stroes et al., 2014;United States Food and Drug Administration, 2015). This demonstrates the tremendous potential of these types of analyses, and the results here suggest that drugs targeting PCSK9 may also be relevant for lowering LDL in individuals with type 2 diabetes. Additionally,Liu et al. (2014)found significant associations based on rare variants in the LPL and ANGPTL4 genes, further supporting the findings presented here. UBE2L3 was associated with HDL in the common variant, meta-analysis byTeslovich et al. (2010), but our rare variant results demonstrate an association with TG as well. Peloso et al. conducted a mega-analysis of 13 studies for a total of∼56,000 individuals, 42,000 of European ancestry (EA) and 14,000 of African ancestry (AA), which investigated the association of low-frequency and rare coding variants with LDL, HDL and TG (Peloso et al., 2014). Gene-based rare variant associations were found for APOC3 and CETP, which we replicated here (Table 3).Peloso et al. (2014)also found a low-frequency variant association for PAFAH1B2 with HDL and TG, which supports our rare variant association of PAFAH1B2 with TG.
Figure 5 Boxplots of log10phenotype versus genotype.Boxplots are shown for genes (A)CNOT2, (B)HNF1B, (C)HPN-AS1, (D)SIRPD, (E)
PAFAH1B2, and (F)UBE2L3. The boxplots are color coded for each variant and the number of samples for each genotype are indicated below the allele labels. Genotyped variants are indicated by an asterisk following the rsID. The width of the bars is proportional to the number of subjects in each group.
have not been previously reported for either HDL or TG.Figure 5contains boxplots of the log10 phenotype values versus genotype for the novel rare variant genes. The majority
on which variants were selected for inclusion in the gene-based analysis were actually for HPN, so their relevance to HPN-AS1 are unclear. Little is known about the function of genesCNOT2,HPN-AS1, andSIRPDand their relation to lipid regulation, and additional follow-up studies will be necessary to better understand their role in regulating lipid levels. Interestingly, hepatocyte nuclear factor 1 homeobox B (HNF1B) was significantly associated with an increase in HDL (q=0.085).HNF1Bencodes the transcription factor (HNF1B) that regulates a wide range of target genes and is involved in several pathologies including cancer, renal cysts and diabetes syndrome, an early onset form of diabetes (HNF1B -MODY), impaired glucose metabolism, venous thrombosis, and several others (Kornfeld et al., 2013;Cuff et al., 2013;Kanthimathi et al., 2015;Raaijmakers et al., 2015). However, this association was driven largely byrs8068014, which was heterozygous in 238 subjects, 201 of whom are black, and homozygous for the variant allele in nine subjects, seven of whom are black. When this analysis was run only on black subjects the association with HNF1B was no longer statistically significant (q> 0.1). HDL is higher in blacks than whites overall, so despite efforts to control for population stratification by incorporating PCs as covariates in the analysis, it appears that the apparent association ofHNF1Bwith HDL levels in all subjects combined may be due to confounding by population admixture. Additional research is needed to better understand the role ofHNF1Band the other novel associations presented here. Although many genetic associations presented here are similar to previous findings in cohorts not focused on diabetes, these findings shed new light on the relationship of dyslipidemia in both individuals with and without type 2 diabetes and the novel findings presented here may indicate new biomarkers or therapeutic targets to better regulate alterations in lipid levels in high-risk, populations with type 2 diabetes.
ADDITIONAL INFORMATION AND DECLARATIONS
Funding
Research was supported by NIH/NHLBI grant RO1 HL110-380. The funders had no role in study design, data collection and analysis, decision to publish, or preparation of the manuscript.
Grant Disclosures
The following grant information was disclosed by the authors: NIH/NHLBI: RO1 HL110-380.
Competing Interests
The authors declare there are no competing interests.
Author Contributions
• Skylar W. Marvel and Daniel M. Rotroff performed the experiments, analyzed the data,
wrote the paper, prepared figures and/or tables, reviewed drafts of the paper.
• Michael J. Wagner and John B. Buse conceived and designed the experiments, wrote the
• Tammy M. Havener performed the experiments, contributed reagents/materials/analysis
tools, reviewed drafts of the paper.
• Howard L. McLeod and Alison A. Motsinger-Reif conceived and designed the
experiments, contributed reagents/materials/analysis tools, wrote the paper, reviewed drafts of the paper.
Human Ethics
The following information was supplied relating to ethical approvals (i.e., approving body and any reference numbers):
The Protocol Review Committee, appointed by the National Heart, Lung, and Blood Institute (NHLBI), approved the study protocol. Each ACCORD participant provided written informed consent using procedures reviewed and approved by each clinical site’s local institutional review board and based on a template provided by the study group that was approved and subsequently centrally monitored by the Coordinating Center and the NHLBI. The portion of the informed consent document describing the genetics component of ACCORD uses the multilevel approach recommended by the NHLBI (National Heart, Institute & others, 1997).
IRB # FWA00003429.
Clinical Trial Ethics
The following information was supplied relating to ethical approvals (i.e., approving body and any reference numbers):
IRB # FWA00003429.
Data Availability
The following information was supplied regarding data availability:
We plan to deposit these data in the NCBI database: dbGAP (http://www.ncbi.nlm.nih. gov/gap). However, this is human genome-wide data and sharing the raw data is prohibited.
Clinical Trial Registration
The following information was supplied regarding Clinical Trial registration: NCT00000620;https://clinicaltrials.gov/ct2/show/NCT00000620.
Supplemental Information
Supplemental information for this article can be found online athttp://dx.doi.org/10.7717/ peerj.3187#supplemental-information.
REFERENCES
ACCORD Study Group. 2010a.Effects of intensive blood-pressure control in type 2
diabetes mellitus.The New England Journal of Medicine 362:1575–1585 DOI 10.1056/NEJMoa1001286.
ACCORD Study Group. 2010b.Effects of combination lipid therapy in type 2 diabetes
Arvind P, Nair J, Jambunathan S, Kakkar VV, Shanker J. 2014.CELSR2–PSRC1–SORT1 gene expression and association with coronary artery disease and plasma lipid levels in an Asian Indian cohort.Journal of Cardiology64:339–346
DOI 10.1016/j.jjcc.2014.02.012.
Aung LHH, Yin R-X, Wu D-F, Wang W, Liu C-W, Pan S-L. 2014.Association of the
variants in the BUD13-ZNF259 genes and the risk of hyperlipidaemia.Journal of Cellular and Molecular Medicine18:1417–1428DOI 10.1111/jcmm.12291.
Bansal V, Libiger O, Torkamani A, Schork NJ. 2010.Statistical analysis strategies for association studies involving rare variants.Nature Reviews Genetics11:773–785 DOI 10.1038/nrg2867.
Buse JB. 2007.Action to control cardiovascular risk in diabetes (ACCORD) trial: design
and methods.The American Journal of Cardiology99:S21–S33 DOI 10.1016/j.amjcard.2007.03.003.
Centers for Disease Control and Prevention. 2014.National diabetes statistics report:
estimates of diabetes and its burden in the United States, 2014. US Department of Health and Human Services, Atlanta.
Cuff J, Salari K, Clarke N, Esheba GE, Forster AD, Huang S, West RB, Higgins JP,
Longacre TA, Pollack JR. 2013.Integrative bioinformatics links HNF1B with clear
cell carcinoma and tumor-associated thrombosis.PLOS ONE8:e74562 DOI 10.1371/journal.pone.0074562.
Dabney A, Storey JD, Warnes G. 2004.Q-value estimation for false discovery rate
control.Medicine344:539–548.
Dai H, Leeder J, Cui Y. 2014.A modified generalized Fisher method for combining
probabilities from dependent tests.Frontiers in Genetics5:32 DOI 10.3389/fgene.2014.00032.
Delaneau O, Marchini J, Zagury J-F. 2012.A linear complexity phasing method for
thousands of genomes.Nature Methods9:179–181DOI 10.1038/nmeth.1785.
Delaneau O, Zagury J-F, Marchini J. 2013.Improved whole-chromosome phasing for
disease and population genetic studies.Nature Methods10:5–6.
Dering C, Hemmelmann C, Pugh E, Ziegler A. 2011.Statistical analysis of rare sequence
variants: an overview of collapsing methods.Genetic Epidemiology35:S12–S17 DOI 10.1002/gepi.20643.
Devlin B, Roeder K. 1999.Genomic control for association studies.Biometrics
55:997–1004DOI 10.1111/j.0006-341X.1999.00997.x.
Gabriel SB, Chirn G-W, Ma Q, Parikh H, Richardson D, Ricke D, Purcell S. 2007.
Genome-wide association analysis identifies loci for type 2 diabetes and triglyceride levels.Science316:1331–1336DOI 10.1126/science.1142358.
Global Lipids Genetics Consortium. 2013.Discovery and refinement of loci associated
with lipid levels.Nature Genetics45:1274–1283DOI 10.1038/ng.2797.
Gerstein HC, Riddle MC, Kendall DM, Cohen RM, Gol R, Feinglos MN, Kirk JK,
Hamilton BP, Ismail-Beigi F, Feeney P, ACCORD Study Group. 2007.Glycemia
treatment strategies in the Action to Control Cardiovascular Risk in Diabetes (ACCORD) trial.The American Journal of Cardiology99:S34–S43.
Ginsberg HN, Bonds DE, Lovato LC, Crouse JR, Elam MB, Linz PE, O’Connor PJ,
Leiter LA, Weiss D, Lipkin E, Fleg JL, ACCORD Study Group. 2007.Evolution
of the lipid trial protocol of the Action to Control Cardiovascular Risk in Diabetes (ACCORD) trial.The American Journal of Cardiology99:S56–S67.
Goff DC, Gerstein HC, Ginsberg HN, Cushman WC, Margolis KL, Byington RP, Buse JB, Genuth S, Probstfield JL, Simons-Morton DG, ACCORD Study Group. 2007.
Prevention of cardiovascular disease in persons with type 2 diabetes mellitus: current knowledge and rationale for the Action to Control Cardiovascular Risk in Diabetes (ACCORD) trial.The American Journal of Cardiology99:S4–S20
DOI 10.1016/S0002-9149(07)00488-2.
Howie BN, Donnelly P, Marchini J. 2009.A flexible and accurate genotype imputation
method for the next generation of genome-wide association studies.PLOS Genetics
5:e1000529DOI 10.1371/journal.pgen.1000529.
Howie B, Marchini J, Stephens M. 2011.Genotype imputation with thousands of
genomes G3: genes, genomes.Genetics1:457–470DOI 10.1534/g3.111.001198.
Ito Y, Azrolan N, O’Connell A, Walsh A, Breslow JL. 1990.Hypertriglyceridemia as a
result of human apo CIII gene expression in transgenic mice.Science249:790–793 DOI 10.1126/science.2167514.
Kanthimathi S, Balamurugan K, Mohan V, Shanthirani CS, Gayathri V, Radha V. 2015.
Identification and molecular characterization of HNF1B gene mutations in Indian diabetic patients with renal abnormalities.Annals of Human Genetics79:10–19 DOI 10.1111/ahg.12093.
Kathiresan S, Manning AK, Demissie S, D’Agostino RB, Surti A, Guiducci C, Gi-anniny L, Burtt NP, Melander O, Orho-Melander M, Arnett DK, Peloso GM,
Ordovas JM, Cupples LA. 2007.A genome-wide association study for blood
lipid phenotypes in the Framingham Heart Study.BMC Medical Genetics8:S17 DOI 10.1186/1471-2350-8-S1-S17.
Koren MJ, Lundqvist P, Bolognese M, Neutel JM, Monsalvo ML, Yang J, Kim JB,
Scott R, Wasserman SM, Bays H. 2014.Anti-PCSK9 monotherapy for
hyperc-holesterolemia the MENDEL-2 randomized, controlled phase III clinical trial of evolocumab.Journal of the American College of Cardiology63:2531–2540 DOI 10.1016/j.jacc.2014.03.018.
Kornfeld J-W, Baitzel C, Könner AC, Nicholls HT, Vogt MC, Herrmanns K, Scheja L, Haumaitre C, Wolf AM, Knippschild U, Seibler J, Cereghini S, Heeren J, Stoffel
metabolism through silencing of Hnf1b.Nature494:111–115 DOI 10.1038/nature11793.
Lange LA, Hu Y, Zhang H, Xue C, Schmidt EM, Tang Z-Z, Bizon C, Lange EM, Smith JD, Turner EH, Jun G, Kang HM, Peloso G, Auer P, Li K, Flannick J, Zhang J, Fuchsberger C, Gaulton K, Lindgren C, Locke A, Manning A, Sim X, Rivas MA, Holmen OL, Gottesman O, Lu Y, Ruderfer D, Stahl EA, Duan Q, Li Y, Durda P, Jiao S, Isaacs A, Hofman A, Bis JC, Correa A, Griswold ME, Jakobsdottir J, Smith AV, Schreiner PJ, Feitosa MF, Zhang Q, Huffman JE, Crosby J, Wassel CL, Do R, Franceschini N, Martin LW, Robinson JG, Assimes TL, Crosslin DR, Rosenthal EA, Tsai M, Rieder MJ, Farlow DN, Folsom AR, Lumley T, Fox ER, Carlson CS, Peters U, Jackson RD, van Duijn CM, Uitterlinden AG, Levy D, Rotter JI, Taylor HA, Gudnason Jr V, Siscovick DS, Fornage M, Borecki IB, Hayward C, Rudan I, Chen YE, Bottinger EP, Loos RJF, Sætrom P, Hveem K, Boehnke M, Groop L, McCarthy M, Meitinger T, Ballantyne CM, Gabriel SB, O’Donnell CJ, Post WS, North KE, Reiner AP, Boerwinkle E, Psaty BM, Altshuler D, Kathiresan S, Lin D-Y, Jarvik GP, Cupples LA, Kooperberg C, Wilson JG, Nickerson DA, Abecasis GR, Rich SS, Tracy
RP, Willer CJ. 2014.Whole-exome sequencing identifies rare and low-frequency
coding variants associated with LDL cholesterol.The American Journal of Human Genetics94:233–245DOI 10.1016/j.ajhg.2014.01.010.
Lee S, Abecasis GR, Boehnke M, Lin X. 2014.Rare-variant association analysis: study
designs and statistical tests.The American Journal of Human Genetics95:5–23 DOI 10.1016/j.ajhg.2014.06.009.
Lee S, Miropolsky L, Wu M. 2013.SKAT: SNP-set (Sequence) kernel association test.R
Package Version 0.95.
Lee S, Wu MC, Lin X. 2012.Optimal tests for rare variant effects in sequencing associa-tion studies.Biostatistics13:762–775DOI 10.1093/biostatistics/kxs014.
Liu DJ, Peloso GM, Zhan X, Holmen OL, Zawistowski M, Feng S, Nikpay M, Auer PL, Goel A, Zhang H, Peters U, Farrall M, Orho-Melander M, Kooperberg C, McPherson R, Watkins H, Willer CJ, Hveem K, Melander O, Kathiresan S, Abecasis GR. 2014.Meta-analysis of gene-level tests for rare variant association.
Nature Genetics46:200–204DOI 10.1038/ng.2852.
Madsen BE, Browning SR. 2009.A groupwise association test for rare mutations using a
weighted sum statistic.PLOS Genetics5:e1000384 DOI 10.1371/journal.pgen.1000384.
Malmberg K, Yusuf S, Gerstein HC, Brown J, Zhao F, Hunt D, Piegas L, Calvin J,
Keltai M, Budaj A. 2000.Impact of diabetes on long-term prognosis in patients
with unstable angina and non-Q-wave myocardial infarction: results of the OASIS (Organization to Assess Strategies for Ischemic Syndromes) Registry.Circulation
102:1014–1019DOI 10.1161/01.CIR.102.9.1014.
Manichaikul A, Mychaleckyj JC, Rich SS, Daly K, Sale M, Chen W-M. 2010.Robust
rela-tionship inference in genome-wide association studies.Bioinformatics26:2867–2873 DOI 10.1093/bioinformatics/btq559.
L, Mardis E, Rotimi CN, Slatkin M, Valle D, Whittemore AS, Boehnke M, Clark AG, Eichler EE, Gibson G, Haines JL, Mackay TF, McCarroll SA, Visscher PM.
2009.Finding the missing heritability of complex diseases.Nature461:747–753
DOI 10.1038/nature08494.
Mendis S, Puska P, Norrving B. 2011.Global atlas on cardiovascular disease prevention
and control. Geneva: World Health Organization.
Morris AP, Zeggini E. 2010.An evaluation of statistical approaches to rare variant analysis in genetic association studies.Genetic Epidemiology34:188–193 DOI 10.1002/gepi.20450.
Musunuru K, Strong A, Frank-Kamenetsky M, Lee NE, Ahfeldt T, Sachs KV, Li X, Li H, Kuperwasser N, Ruda VM, Pirruccello JP, Muchmore B, Prokunina-Olsson L, Hall JL, Schadt EE, Morales CR, Lund-Katz S, Phillips MC, Wong J, Cantley W, Racie T, Ejebe KG, Orho-Melander M, Melander O, Koteliansky V, Fitzgerald K,
Krauss RM, Cowan CA, Kathiresan S, Rader DJ. 2010.From noncoding variant to
phenotype via SORT1 at the 1p13 cholesterol locus.Nature466:714–719 DOI 10.1038/nature09266.
National Heart Institute B. 1997.Report of the special emphasis panel on opportunities and obstacles to genetic research in NHLBI clinical studies. Bethesda: National Institutes of Health.
Ota VK, Chen ES, Ejchel TF, Furuya TK, Mazzotti DR, Cendoroglo MS, Ramos LR,
Araujo LQ, Burbano RR, Smith M de AC. 2011.APOA4 polymorphism as a risk
factor for unfavorable lipid serum profile and depression: a cross-sectional study.
Journal of Investigative Medicine: The Official Publication of the American Federation for Clinical Research59:966–970DOI 10.2310/JIM.0b013e31822467cd.
Peloso GM, Auer PL, Bis JC, Voorman A, Morrison AC, Stitziel NO, Brody JA,
Khetarpal SA, Crosby JR, Fornage M, Isaacs A, Jakobsdottir J, Feitosa MF, Davies G, Huffman JE, Manichaikul A, Davis B, Lohman K, Joon AY, Smith AV, Grove ML, Zanoni P, Redon V, Demissie S, Lawson K, Peters U, Carlson C, Jackson RD, Ryckman KK, Mackey RH, Robinson JG, Siscovick DS, Schreiner PJ, Mychaleckyj JC, Pankow JS, Hofman A, Uitterlinden AG, Harris TB, Taylor KD, Stafford JM, Reynolds LM, Marioni RE, Dehghan A, Franco OH, Patel AP, Lu Y, Hindy G, Gottesman O, Bottinger EP, Melander O, Orho-Melander M, Loos RJF, Duga S, Merlini PA, Farrall M, Goel A, Asselta R, Girelli D, Martinelli N, Shah SH, Kraus WE, Li M, Rader DJ, Reilly MP, McPherson R, Watkins H, Ardissino D, Zhang Q, Wang J, Tsai MY, Taylor HA, Correa A, Griswold ME, Lange LA, Starr JM, Rudan I, Eiriksdottir G, Launer LJ, Ordovas JM, Levy D, Chen Y-DI, Reiner AP, Hayward C, Polasek O, Deary IJ, Borecki IB, Liu Y, Gudnason V, Wilson JG, van Duijn CM, Kooperberg C, Rich SS, Psaty BM, Rotter JI, O’Donnell CJ, Rice K, Boerwinkle
E, Kathiresan S, Cupples LA. 2014.Association of low-frequency and rare
coding-sequence variants with blood lipids and coronary heart disease in 56,000 whites and blacks.The American Journal of Human Genetics94:223–232
Pennacchio LA, Rubin EM. 2003.Apolipoprotein A5, a newly identified gene that affects plasma triglyceride levels in humans and mice.Arteriosclerosis, Thrombosis, and Vascular Biology23:529–534DOI 10.1161/01.ATV.0000054194.78240.45.
Pollin TI, Damcott CM, Shen H, Ott SH, Shelton J, Horenstein RB, Post W, McLenithan JC, Bielak LF, Peyser PA, Mitchell BD, Miller M, O’Connell JR,
Shuldiner AR. 2008.A null mutation in human APOC3 confers a favorable plasma
lipid profile and apparent cardioprotection.Science322:1702–1705 DOI 10.1126/science.1161524.
Price AL, Patterson NJ, Plenge RM, Weinblatt ME, Shadick NA, Reich D. 2006.
Principal components analysis corrects for stratification in genome-wide association studies.Nature Genetics38:904–909DOI 10.1038/ng1847.
Raaijmakers A, Corveleyn A, Devriendt K, Van Tienoven TP, Allegaert K, Dyck MV,
Van den Heuvel, L, Kuypers D, Claes K, Mekahli D, Levtchenko E. 2015.Criteria
for HNF1B analysis in patients with congenital abnormalities of kidney and urinary tract.Nephrology Dialysis Transplantation30:835–842DOI 10.1093/ndt/gfu370.
R Development Core Team. 2014.R: a language and environment for statistical
comput-ing. Vienna: R Foundation for Statistical Computing.
Rubin EM, Krauss RM, Spangler EA, Verstuyft JG, Clift SM. 1991.Inhibition of early
atherogenesis in transgenic mice by human apolipoprotein AI.Nature353:265–267 DOI 10.1038/353265a0.
Storey JD. 2002.A direct approach to false discovery rates.Journal of the Royal Statistical Society: Series B64:479–498DOI 10.1111/1467-9868.00346.
Stroes E, Colquhoun D, Sullivan D, Civeira F, Rosenson RS, Watts GF, Bruckert E, Cho
L, Dent R, Knusel B, Xue A, Scott R, Wasserman SM, Rocco M. 2014.Anti-PCSK9
antibody effectively lowers cholesterol in patients with statin intolerance the GAUSS-2 Randomized, placebo-controlled phase 3 clinical trial of evolocumab.Journal of the American College of Cardiology 63:2541–2548DOI 10.1016/j.jacc.2014.03.019.
Langenberg C, Launer LJ, Lakatta EG, Laaksonen R, Kyvik KO, Kronenberg F, König IR, Khaw KT, Kaprio J, Kaplan LM, Johansson A, Jarvelin MR, Janssens AC, Ingelsson E, Igl W, Kees Hovingh G, Hottenga JJ, Hofman A, Hicks AA, Hengstenberg C, Heid IM, Hayward C, Havulinna AS, Hastie ND, Harris TB, Haritunians T, Hall AS, Gyllensten U, Guiducci C, Groop LC, Gonzalez E, Gieger C, Freimer NB, Ferrucci L, Erdmann J, Elliott P, Ejebe KG, Döring A, Dominiczak AF, Demissie S, Deloukas P, de Geus EJ, de Faire U, Crawford G, Collins FS, Chen YD, Caulfield MJ, Campbell H, Burtt NP, Bonnycastle LL, Boomsma DI, Boekholdt SM, Bergman RN, Barroso I, Bandinelli S, Ballantyne CM, Assimes TL, Quertermous T, Altshuler D, Seielstad M, Wong TY, Tai ES, Feranil AB, Kuzawa CW, Adair LS, Taylor Jr HA, Borecki IB, Gabriel SB, Wilson JG, Holm H, Thorsteinsdottir U, Gudnason V, Krauss RM, Mohlke KL, Ordovas JM, Munroe PB, Kooner JS, Tall AR, Hegele RA, Kastelein JJ, Schadt EE, Rotter JI, Boerwinkle E, Strachan DP, Mooser V, Stefansson K, Reilly MP, Samani NJ, Schunkert H. 2010.Biological, clinical and population relevance of 95 loci for blood lipids.Nature
466:707–713
DOI 10.1038/nature09270.
United States Food and Drug Administration. 2015.FDA briefing
document-endocrinologic and metabolic drugs advisory commitee (EMDAC).
Vattikuti S, Guo J, Chow CC. 2012.Heritability and genetic correlations explained by
common SNPs for metabolic syndrome traits.PLOS Genetics8:e1002637 DOI 10.1371/journal.pgen.1002637.
Waterworth DM, Ricketts SL, Song K, Chen L, Zhao JH, Ripatti S, Aulchenko YS, Zhang W, Yuan X, Lim N, Luan J’an, Ashford S, Wheeler E, Young EH, Hadley D, Thompson JR, Braund PS, Johnson T, Struchalin M, Surakka I, Luben R, Khaw K-T, Rodwell SA, Loos RJF, Boekholdt SM, Inouye M, Deloukas P, Elliott P, Sch-lessinger D, Sanna S, Scuteri A, Jackson A, Mohlke KL, Tuomilehto J, Roberts R, Stewart A, Kesäniemi YA, Mahley RW, Grundy SM, WTCC Consortium, McArdle W, Cardon L, Waeber G, Vollenweider P, Chambers JC, Boehnke M, Abecasis GR, Salomaa V, Järvelin M-R, Ruokonen A, Barroso I, Epstein SE, Hakonarson HH, Rader DJ, Reilly MP, Witteman JCM, Hall AS, Samani NJ, Strachan DP, Barter P, van Duijn CM, Kooner JS, Peltonen L, Wareham NJ, McPherson R,
Mooser V, Sandhu MS. 2010.Genetic variants influencing circulating lipid levels
and risk of coronary artery disease.Arteriosclerosis, Thrombosis, and Vascular Biology
30:2264–2276DOI 10.1161/ATVBAHA.109.201020.
Wu MC, Lee S, Cai T, Li Y, Boehnke M, Lin X. 2011.Rare-variant association testing for
sequencing data with the sequence kernel association test.The American Journal of Human Genetics89:82–93DOI 10.1016/j.ajhg.2011.05.029.
Yang J, Lee SH, Goddard ME, Visscher PM. 2011.GCTA: a tool for genome-wide


![Design, synthesis and antibacterial evaluation of pyrano[3,2-H]quinoline carbonitriles](data:image/gif;base64,R0lGODlhAQABAIAAAP///wAAACH5BAEAAAAALAAAAAABAAEAAAICRAEAOw==)