Safety switches are becoming relevant for the clinical translation of T-cell–based immunotherapies. In patients receiving an allogeneic hematopoietic stem cell trans-plant, the inducible caspase-9 gene (iC9) safety switch expressed by donor-derived T lymphocytes efficiently controls acute graft versus host disease (GvHD). How-ever, in vivo elimination of iC9-T cells by the chemical inducer of dimerization (CID) that activates the iC9 pro-tein is incomplete. To study this effect, we characterized the clonal diversity and dynamics of vector insertion sites (VIS) in iC9-T cells pre- and post-CID administration in four patients who developed GvHD. We identified 3,203 VIS among four patients and followed their in vivo clonal dynamics up to 161 days post-CID. VIS were catego-rized by their proximity to host genome elements, gene associations, and cis-modulatory relationship to mapped promoters. We found that VIS are preferentially located near open chromatin and promoter regions; further-more, there was no evidence for selection bias among VIS surviving the CID treatment. The majority of iC9-T cells with high normalized VIS copy number at the time of GvHD onset were eliminated by CID, while iC9-T cells detectable post-CID generally have low normalized VIS copy number. We propose that suboptimal iC9 transgene expression is responsible for the incomplete elimination of iC9-T cells and illustrate here by simple model how cis-modulatory influences of local genome context and T-cell receptor activation status at time of CID treatment contribute to stochastic sparing of iC9-T cells.
Received 1 June 2015; accepted 23 November 2015; advance online
publication 5 January 2016. doi:10.1038/mt.2015.217
INTRODUCTION
The infusion of donor-derived T lymphocytes engineered to express the herpes simplex virus thymidine kinase (HSV-TK) safety switch allows efficient control of acute graft versus host dis-ease (GvHD) in patients receiving allogeneic hematopoietic stem
cell transplant (HSCT).1 We recently demonstrated that another
safety switch based on the inducible caspase-9 gene (iC9) achieves the same clinical benefits.2,3
Extending from their original application to control GvHD, safety switches are increasingly relevant for the clinical transla-tion of other T-cell–based immunotherapies. For example, safety switches may be desirable to control the life-threatening toxicities caused by T lymphocytes engineered to acquire antitumor speci-ficity, such as T lymphocytes expressing chimeric antigen recep-tors or T-cell receprecep-tors (TCRs).4–6 For these applications, the iC9
safety switch is potentially superior to HSV-TK as it is less immu-nogenic,7,8 induces apoptosis of engineered cells within hours
in vivo,9 and is functional in both dividing and nondividing cells
since it directly activates apoptosis independently of cell cycle.7–10
Clinical experience thus far indicates >90% elimination of iC9-T cells infused after HSCT within few hours of administration of the chemical inducer of dimerization (CID) AP1903, which activates the fusion protein iC9. There remains, however, a frac-tion of iC9-T cells that are not eliminated in vivo.2,3 These iC9-T
cells are not intrinsically resistant to apoptosis, since they can be eliminated ex vivo in response to CID after re-activation.2 While
incomplete elimination of iC9-T cells in vivo by CID has not pro-duced adverse clinical consequences after allogeneic HSCT, since GvHD is permanently controlled,2,3 it is still critical to dissect the
mechanisms responsible for the incomplete in vivo elimination of iC9-T cells by CID.
Earlier studies of T cells engineered with HSV-TK elucidated that Moloney murine leukemia retrovirus integration preferen-tially occurs near active promoters and regulatory elements, as was previously observed for hematopoietic stem cells.11–13 We
hypoth-esized that murine leukemia retrovirus integration in those iC9-T lymphocytes not eliminated in vivo by CID may be located in transcriptionally inactive chromatin regions, which downregulate transgene expression. To investigate this possibility, we performed high-resolution mapping of gammaretroviral vector integration sites (GRV VIS) from samples taken from patients who devel-oped GvHD after the infusion of iC9-T cells2,3 and assessed total
VIS diversity per patient up to 161 days post-CID. We then used
736
745
Virus Integration Analysis in iC9-T Cells In Vivo
Molecular Therapy 10.1038/mt.2015.217
00
apr2016
244
1June2015
23November2015
© The American Society of Gene & Cell TherapyCorrespondence: Edmund Chang, Center for Cell and Gene Therapy, Baylor College of Medicine, 6621 Fannin Street, MC 3-3320, Houston, Texas
77030, USA. E-mail: [email protected] or Gianpietro Dotti, Department of Microbiology and Immunology, University of North Carolina,
Marsico Hall, 125 Mason Farm Road, Room 5202, Chapel Hill, North Carolina 27599, USA. E-mail: [email protected]
Clonal Dynamics In Vivo of Virus Integration Sites
of T Cells Expressing a Safety Switch
Edmund C Chang
1,2, Hao Liu
3, John A West
4, Xiaoou Zhou
1,2, Olga Dakhova
1,2,
David A Wheeler
5, Helen E Heslop
1,2,6,7, Malcolm K Brenner
1,2,6,7and Gianpietro Dotti
1,2,4,7,81Center for Cell and Gene Therapy, Baylor College of Medicine, Houston, Texas, USA; 2Houston Methodist Hospital, Houston, Texas, USA; 3 Biostatistics
Shared Resources, Baylor College of Medicine, Houston, Texas, USA; 4Lineberger Cancer Center, University of North Carolina, Chapel Hill, North
Carolina, USA; 5Human Sequencing Center, Baylor College of Medicine, Houston, Texas, USA; 6Department of Pediatrics, Texas Children’s Hospital,
Baylor College of Medicine, Houston, Texas, USA; 7Department of Medicine, Baylor College of Medicine, Houston, Texas, USA; 8Department of
published genome-wide atlases to dissect genomic and epigenetic influences on the clonal dynamics of T cells expressing the iC9
safety switch.
RESULTS
Proviral integrants in iC9-T cells are located near open chromatin and promoter regions
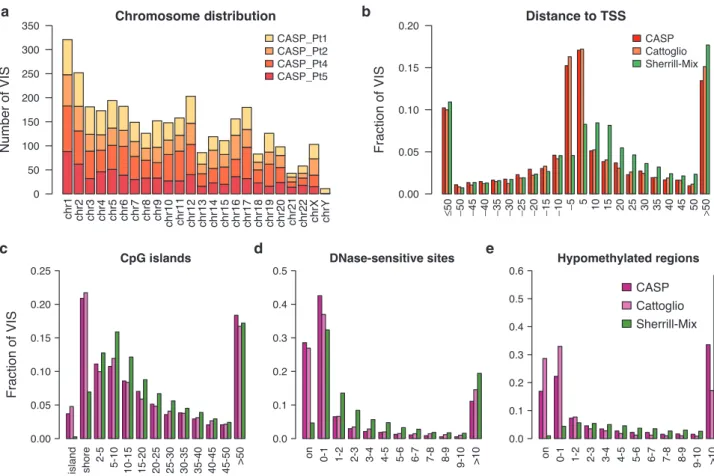
For all GRV VIS, we retained only uniquely mapped reads within 100 bp of VIS as the modified sequencing read depth (Truncated Read Coverage). Overall, from the 12 samples collected, we recov-ered a total of 650, 748, 1,079, and 726 unique VIS from Pts. 1, 2, 4, and 5, respectively2,3 (Table 1). We mapped genomic
dis-tances between VIS and four commonly referenced functional elements such as RefSeq transcriptional start sites (TSS), DNase I-hypersensitive sites (DHS), CpG islands (CGI), and hypometh-ylated regions (HMR). For comparison and benchmarking, we included two previously published studies analyzing VIS in T cells transduced with a GRV-encoding HSV-TK13 and a study in which
human T lymphocytes were infected in vitro with HIV.14 Our own
and previous analyses11,13 revealed site selection bias for GRV that
is distinct from lentivirus. GRV preferentially integrate near func-tional elements closely associated with transcripfunc-tional activity such as TSS and CpG islands, and about 40% of GRV VIS were found within ±5 kb of TSS compared to ~15% for HIV (Figure 1). Greater than 25% of GRV VIS mapped within 2 kb distance of CpG islands, termed “CpG shores.” In contrast, only 7% of lentivi-rus integrants were found at distances of <2 kb. DHS indicate rela-tive “open” chromatin accessibility for DNA-binding factors, and we found ~70% GRV VIS in or very near DHS (±1 kb distance), compared to ~35% for lentiviral integrants (Figure 1). When we examined VIS relative to HMR mapped in peripheral blood mononuclear cells, 40–60% of all GRV VIS were found within 1 kb distance of HMR, in contrast to <5% for lentiviral integrants.
Mapping of integration sites within chromatin states
We next characterized the genomic regions near VIS, by mapping VIS to chromatin state annotation specific to CD4+ memory T-cell
genome by the ChromHMM algorithm, which has been used to
discover gene regulatory regions.15 The 51 discrete chromatin states
can be broadly categorized under five major categories: Promoter (states 1–11), Transcribed (states 12–28), Active Intergenic (states 29–39), Repressive (states 40–45), and Repetitive (states 46–51). From the 3,203 VIS recovered from four patients, 3,168 were cat-egorized based on the chromatin state distribution as: 720 (22.4%) Promoter, 674 (20.7%) Transcribed, 1,466 (46%) Active Intergenic, 283 (9%) Repressive, and 25 (0.8%) Repetitive (Figure 2a,b). We repeated similar mapping analyses for published VIS sets for GRV and lentivirus13,14 (Figure 2c). T-cell transduction by either class
of vectors leads to integration patterns that are skewed towards chromatin states associated with open and transcriptionally active regions (Promoter, Transcribed, Active Intergenic states), whilst avoiding Repressive and Repetitive states (Figure 2c and
Supplementary Figure S1). However, the relative enrichment in Transcribed and Active Intergenic states discriminates between GRV VIS (favoring Active Intergenic states 29–33) from lentiviral integration (favoring Transcribed states 22–28). Although GRV VIS avoid Repetitive states, we observed they associate with Alu repeat elements. Indeed 1,052 VIS (30%) were located in states 16, 19, 23, 26, 34, 36, and 37.
Genomic Regions Enrichment of Annotations Tool analysis
Having found that VIS are preferentially located within regions functionally enriched for transcriptional regulation, we then assessed their association with gene programs using GREAT (Genomic Regions Enrichment of Annotations Tool) analysis.16
The 3,203 identified VIS were significantly enriched in Gene Ontology (GO) Biological Processes relating to immune cell func-tion, T-cell costimulafunc-tion, Type I interferon response, NF-κB cascade, and Toll-like receptor 3 signaling pathway (Figure 2a). These GO Biological Processes reflect gene functions typical of T cells, which are likely to be transcriptionally active in proliferat-ing T cells at the time of GRV transduction. In contrast, lentiviral integrants are enriched for cell cycle regulation and DNA integrity checkpoints (Supplementary Figure S1). For immunity-related GO Biological Processes shared by both GRV and lentiviral
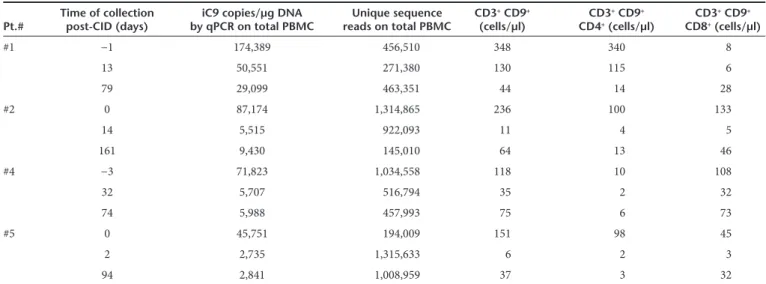
Table 1 Summary of peripheral blood samples from patients infused with iC9-T cells who developed GvHD Pt.# Time of collection post-CID (days) by qPCR on total PBMCiC9 copies/µg DNA reads on total PBMCUnique sequence CD3
+ CD9+
(cells/µl) CD3
+ CD9+
CD4+ (cells/µl) CD3 + CD9+
CD8+ (cells/µl)
#1 −1 174,389 456,510 348 340 8
13 50,551 271,380 130 115 6
79 29,099 463,351 44 14 28
#2 0 87,174 1,314,865 236 100 133
14 5,515 922,093 11 4 5
161 9,430 145,010 64 13 46
#4 −3 71,823 1,034,558 118 10 108
32 5,707 516,794 35 2 32
74 5,988 457,993 75 6 73
#5 0 45,751 194,009 151 98 45
2 2,735 1,315,633 6 2 3
94 2,841 1,008,959 37 3 32
integrants (T-cell costimulation, GO:0031295; Induction of apop-tosis, GO:0006917), GREAT showed preferential integration of GRV versus lentivirus (Figure 2a and Supplementary Figure S1). Thus VIS patterning as annotated by ChromHMM and GREAT gives insight into viral integration behavior and pinpoints cell differentiation status at time of viral integration into the host genome.
Effects of iC9 gene activation by CID on VIS diversity
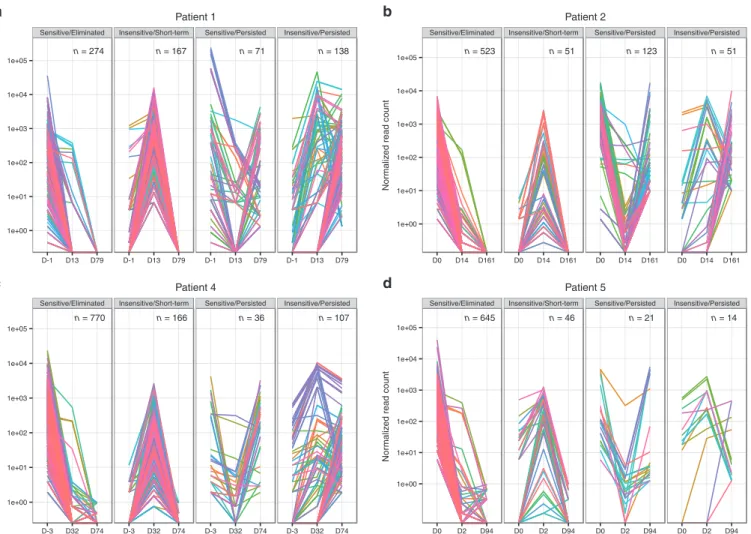
Having functionally dissected VIS pattern in iC9-T cells in vivo, we assessed the impact of CID administration on the VIS clonal dynamics. To accurately estimate copy number of iC9 transgenes per VIS, we normalized total uniquely mapped sequencing reads per sequencing library against their respective iC9 transgene copy numbers measured by quantitative PCR to arrive at a normalized VIS copy number (NVC) for all VIS (Figure 3 and Supplementary Figures S2 and S3). Analyzed peripheral blood mononuclear cell samples were broadly categorized as pre-CID (day 0 prior to CID administration), post-CID (2–32 days post-CID administration), or late-CID (74–161 days post-CID administration), and VIS were segregated by using two criteria: (i) change of NVC levels and (ii)
length of persistence in vivo. Using these two criteria, we identi-fied four distinct groups: Sensitive/Eliminated, Insensitive/Short-term, Sensitive/Persisted, and Insensitive/Persisted (Figure 3 and
Supplementary Figure S2). In all patients except Pt. 1, majority of VIS (75–87%) were grouped as Sensitive/Eliminated if NVC levels decreased in pre-CID to post-CID samples then fell below our present detection threshold (i.e., 1 NVC copy; see Materials and Methods) in late-CID samples (Figure 3 and Supplementary Figure S2). In addition, we identified three other patterns of VIS clonal dynamic. VIS were defined Insensitive/Short-term when NVC increased from pre-CID to post-CID samples but became undetectable in late-CID samples. VIS were categorized as Sensitive/Persisted if NVC dropped from pre-CID to post-CID samples but remained detectable in late-CID samples. Finally, the last group of VIS we termed Insensitive/Persisted because NVC increased from pre-CID to post-CID samples and then remained consistently detectable in late-CID samples (Figure 3
and Supplementary Figure S2). With the exception of Pt.1, VIS with highest NVC at the time of GvHD occurrence (pre-CID) disappeared in post-CID and late-CID samples, while a minority persisted in late-CID samples (11.3, 25.5, and 15.8% for Pts. 2, 4,
Figure 1 Distribution of VIS by chromosome and mapped distance to functional DNA elements. (a) Chromosomal distribution of VIS detected in four patients. (b) Mapped distance distribution of VIS to nearest RefSeq TSS binned at 5 kb distance intervals centered about TSS. Negative distances denotes upstream of TSS. (c) Mapped distance distribution of VIS to nearest CpG island (UCSC). VIS mapped to nearest CpG island are annotated as “island” (zero distance), “shore” (up to 2 kb), “2–5 kb” then set at 5 kb distances intervals up to 50 kb. (d) Mapped distance distribution of VIS to nearest DNaseI-hypersensitive site in CD3+ T-cell genome (Epigenetic Roadmap Project EID: E034; narrowPeak). VIS at zero distance (“on”) and then set at 1 kb distance intervals up to 10 kb. (e) Mapped distance distribution of VIS to nearest hypomethylated region in human peripheral blood mononuclear cell genome (ENCODE dataset36). VIS at zero distance (“on”) and then set at 1 kb distance intervals up to 10 kb. (b–e) Percent of total VIS found per experiment dataset (CASP, this study; Cattoglio = Cattoglio et al.13; Sherrill-Mix = Sherrill-Mix et al.14). TSS, transcriptional start site; VIS, vector integration sites.
a b
c d e
≤
and 5, respectively). Of note, VIS predominant in late-CID samples initially showed low NVC levels in pre-CID samples (Figure 3 and
Supplementary Figure S2). When VIS diversity is viewed by its cognate ChromHMM states, we did not observe clonal selection by CID treatment (Supplementary Figure S4). Instead these data
indicate CID sensitivity tracks closely with the clonal expansion of iC9-T cell subsets at time of GvHD onset, suggesting that expand-ing iC9-T cells are alloreactive and have activated TCR signalexpand-ing. By contrast, VIS species with initially low pre-CID NVC levels may represent iC9-T cells quiescent at time of GvHD onset with
Figure 2 Functional annotation and gene ontology enrichment of VIS. (a) Representative list of GO Biological Process terms significantly enriched for 3,203 gammaretroviral VIS in this study. Gene ontology enrichment is computed by binomial testing implemented by Genomic Regions Enrichment of Annotations Tool (GREAT). Select results shown for binomial test rank, Bonferroni-adjusted, and unadjusted P values are shown. (b) Matrix table showing number of VIS shared between ChromHMM-defined states (rows) and select GO Biological Process terms (columns). ChromHMM states are broadly grouped as: Promoter (states 1–11), Transcribed (12–28), Active Intergenic (29–39), Repressive (40–45), and Repetitive (46–51). (c) Frequency distribution of ChromHMM states per patient (Pt. 1–5; this study); Cattoglio (retroviral vector study)13; Sherrill-Mix (lentiviral in vitro)14; and Random. TSS, transcriptional start site; VIS, vector integration sites.
a
b
c
BinomRank
1 6 8 11 14 16 17 20 27 28 29 30 31 32 40 66 70 72 76 80 85 156 157 159 162 163 167
ID
GO:0002376 GO:0002696 GO:0051249 GO:0050863 GO:0006952 GO
:0002757 GO :0001817 GO:000691 7 GO:003129 5 GO:00421 10
GO:0010941 GO:0002697 GO:0045321 GO:0006950 GO:0050851 GO:0002819 GO
:005085
2
GO
:0060333
GO:0060337 GO:0050864 GO:0002637 GO:0010468 GO:0000018 GO:0001932 GO:0043122 GO:0034138 GO:0051726
Descripton
Immune system process Positive regulation of leukocyte activation Regulation of lymphocyte activation Regulation of T-cell activation Defense response Immune response-activating signal transduction Regulation of cytokine production Induction of apoptosis T-cell costimulation T-cell activation Regulation
of
cell
death
Regulation of immune effector process Leukocyte activation Response to stress Antigen receptor-mediated signaling pathway Regulation of adaptive immune response T-cell receptor signaling pathway Interferon-gamma-mediated signaling pathway Type I interferon-mediated signaling pathway Regulation of B-cell activation Regulation of immunoglobulin production Regulation of gene expression Regulation of DN
A
recombination
Regulation of protein phosphorylation Regulation of I-kappaB kinase/NF-kappaB cascade Toll-like receptor 3 signaling pathway Regulation of cell cycle
BinomP 1.42E-78 2.49E-47 3.47E-46 8.96E-44 5.26E-40 2.12E-36 3.67E-36 5.54E-33 3.81E-30 1.23E-29 1.64E-29 8.64E-29 9.71E-29 4.61E-28 4.51E-25 8.96
E-18
2.
79
E-17
5.06E-17 5.04E-16 9.26E-16 3.07E-15 2.83E-10 3.45E-10 4.09E-10 5.26E-10 5.89E-10 7.63E-10
State BinomBonf
P
1.24E-74 2.19E-43 3.04E-42 7.85E-40 4.61E-36 1.86E-32 3.21E-32 4.85E-29 3.34E-26 1.07E-25 1.44E-25 7.57E-25 8.50E-25 4.04E-24 3.95E-21 7.85
E-14
2.
45
E-13
4.43E-13 4.42E-12 8.11
E-12
2.69E-1
1
2.48E-06 3.02E-06 3.58E-06 4.61E-06 5.16E-06 6.68E-06
Total uni
q
ue VI
S
State
1 17 4 5 2 12 5 9 10 0 1 23 3 2 41 2 2 2 1 1 1 1 43 0 11 7 1 16 118 1 Promoter upstream high expr; potential enh looping
2 17 1 3 3 5 2 2 6 0 5 15 3 7 23 2 0 2 2 2 1 0 42 0 4 2 0 7 105 2 Promoter upstream med expr; potential enh looping
3 13 1 1 0 7 2 1 4 0 1 10 2 2 24 0 0 0 1 1 1 0 16 0 8 1 1 5 64 3 Promoter upstream low expr; potential enh looping
4 2 2 2 2 2 2 2 0 0 0 2 0 0 4 2 0 2 0 0 0 0 5 0 0 0 0 2 6 4 Repressed promoter
5 8 3 2 1 7 1 3 2 0 2 8 2 2 14 0 1 0 0 0 1 1 13 1 7 1 1 5 34 5 TSS low-med expr; most GC rich
6 9 0 0 0 4 3 3 4 0 1 8 0 1 11 0 0 0 0 0 0 0 20 0 2 0 2 5 44 6 TSS med expr
7 12 10 11 11 3 1 2 9 8 2 17 1 2 16 1 1 1 2 2 1 0 16 1 5 0 0 6 57 7 TSS high expr
8 23 9 10 9 11 5 3 12 3 7 18 4 9 21 5 2 5 2 3 2 1 27 1 8 2 0 6 73 8 Transcribed promoter; highest expr, TSS for active genes
9 29 11 11 10 13 5 4 9 3 8 17 4 10 27 4 3 4 2 3 3 0 22 0 8 0 0 9 70 9 Transcribed promoter; highest expr, downstream
10 15 6 7 6 12 2 9 8 2 7 19 4 7 25 1 1 1 3 3 0 0 22 0 9 0 1 6 76 10 Transcribed promoter; high expr, near TSS
11 21 7 7 6 12 9 3 3 5 4 19 7 9 30 7 5 5 2 1 2 1 36 0 12 2 2 7 73 11 Transcribed promoter; high expr, downstream
12 14 3 4 4 7 5 4 5 2 4 7 3 6 15 4 1 3 1 1 1 1 27 0 4 1 0 5 53 12 Transcribed 5proximal, higher expr, open chr, TF binding
13 10 3 5 3 4 3 4 3 1 4 7 3 4 9 2 1 0 1 1 2 1 16 1 4 1 1 4 39 13 Transcribed 5proximal, higher expr, open chr
14 23 11 13 8 9 6 4 7 4 8 16 5 14 26 6 4 4 0 0 6 0 26 1 8 0 0 9 89 14 Transcribed 5proximal, high expr, open chr
15 10 1 1 1 5 3 2 4 1 0 8 4 3 14 2 0 2 1 1 0 2 22 1 3 0 2 4 53 15 Transcribed 5proximal, high expr
16 26 2 5 5 18 7 2 6 0 2 17 4 7 29 1 1 0 2 2 2 3 36 0 7 1 6 12 70 16 Transcribed 5proximal, med expr; Alu repeats
17 2 0 0 0 1 0 1 3 0 1 5 0 1 4 0 0 0 0 0 0 0 6 0 3 1 0 0 13 17 Transcribed less 5proximal, med expr, open chr
18 6 0 0 0 2 3 1 1 0 0 4 0 0 6 3 0 3 0 0 0 0 14 0 2 0 1 3 29 18 Transcribed less 5proximal, med expr
19 22 1 1 1 11 5 9 4 1 4 13 4 4 31 1 1 1 1 2 1 0 36 0 11 2 4 5 90 19 Transcribed less 5proximal, lower expr; Alu repeats
20 28 5 6 5 14 4 7 11 0 11 22 5 15 27 4 2 3 2 0 1 1 36 0 9 2 0 5 74 20 Candidate strong enhancer in transcribed regions
21 8 3 1 1 3 0 2 3 1 2 4 3 3 4 0 3 0 1 1 0 0 8 0 3 0 0 3 20 21 Spliced exons/GC rich; open chr, TF binding
22 1 0 0 0 0 0 0 0 0 0 0 0 0 0 0 0 0 0 0 0 0 2 0 0 0 0 0 2 22 Spliced exons/GC rich
23 1 0 0 0 1 0 0 0 0 0 0 0 0 1 0 0 0 0 0 0 0 6 0 1 0 0 0 12 23 Spliced exons/GC rich; Alu repeats
24 3 0 0 0 2 2 1 1 0 0 3 0 2 5 2 0 0 1 1 0 0 12 0 3 3 0 1 19 24 Transcribed 5distal; exons
25 6 2 5 3 5 2 3 1 0 1 2 3 2 5 0 0 0 1 1 2 2 5 2 5 0 2 4 10 25 Transcribed further 5distal; exons
26 18 8 8 5 11 3 3 4 2 3 12 5 8 27 2 5 1 1 1 4 1 37 3 8 3 1 3 87 26 Transcribed 5distal; Alu repeats
27 5 0 0 0 3 1 2 1 0 0 3 0 0 4 0 0 0 0 0 0 0 4 0 2 0 0 1 14 27 End of transcription; exons; high expr
28 0 0 0 0 0 0 0 0 0 0 0 0 0 0 0 0 0 0 0 0 0 0 0 0 0 0 0 0 28 ZNF genes; KAP-1 repressed state
29 39 11 13 9 14 11 11 17 4 7 44 4 12 48 7 2 5 3 3 7 1 72 2 25 4 2 22 166 29 Cand strong distal enh; higher open chr; higher target expr
30 50 16 18 14 30 9 13 17 0 14 31 14 20 59 7 6 4 2 0 7 5 78 4 24 7 4 21 175 30 Cand strong distal enh; high open chr; higher target expr
31 22 7 8 7 11 5 7 7 1 6 18 4 10 24 3 5 2 1 1 4 3 26 3 12 2 1 12 73 31 Intergenic H2AZ with open chr/TF binding. Cand. distal enh
32 33 18 19 16 21 8 13 10 14 7 26 3 8 41 4 1 3 1 1 4 0 24 0 16 9 3 10 63 32 Candidate weak distal enhancer
33 29 14 14 10 22 7 9 6 3 3 28 6 6 44 4 5 3 1 1 5 4 53 2 15 5 2 12 110 33 Candidate distal enhancer
34 73 34 32 30 36 16 25 23 11 15 51 18 16 80 13 9 11 5 3 5 3 107 7 33 15 4 30 261 34 Proximal to active enhancers; Alu repeats
35 21 6 8 5 9 6 4 10 4 3 19 3 3 23 2 2 0 3 1 4 0 35 0 12 2 2 6 60 35 Active intergenic regions not enhancer specific
36 72 29 32 27 39 24 26 19 7 15 49 21 21 72 16 14 8 11 5 14 6 83 4 37 10 8 29 192 36 Active intergenic further from enhancers; Alu repeats
37 60 14 19 15 36 16 22 18 4 8 41 10 15 79 9 5 6 2 1 5 1 91 1 28 3 4 16 261 37 Non-repressive intergenic domains; Alu repeats
38 21 5 6 6 14 2 5 4 0 3 14 6 4 25 2 4 2 2 2 0 0 32 1 9 4 1 12 100 38 H2AZ specific state
39 2 0 0 0 2 2 0 0 0 0 0 0 0 2 0 0 0 0 0 0 0 0 0 1 0 2 1 5 39 CTCF island; candidate insulator
40 13 0 1 1 6 2 5 4 0 5 13 0 5 16 1 0 1 1 0 0 0 11 0 4 0 1 5 81 40 Unmappable
41 5 1 1 1 4 0 1 3 0 2 12 0 2 13 0 0 0 0 0 1 0 17 0 8 1 0 5 58 41 Heterochr; nuclear lamina; most AT rich
42 0 0 0 0 0 0 0 0 0 0 0 0 0 0 0 0 0 0 0 0 0 0 0 0 0 0 0 0 42 Heterochr; nuclear lamina; ERVL repeats
43 16 7 6 5 17 5 9 4 3 2 19 3 4 42 1 1 1 1 0 2 1 54 0 11 0 1 10 137 43 Heterochr; lower gene depletion
44 0 0 0 0 0 0 0 0 0 0 0 0 0 0 0 0 0 0 0 0 0 0 0 0 0 0 0 2 44 Heterochr; ERVL repeats: lower gene/exon depletion
45 2 1 1 0 2 0 1 0 0 0 1 1 1 3 0 0 0 0 0 1 1 0 0 0 1 0 2 5 45 Specific repression
46 2 0 0 0 2 0 0 0 0 0 1 0 0 2 0 0 0 0 0 0 0 4 0 1 0 0 1 12 46 Simple repeats (CA)n, (TG)n
47 3 0 1 1 1 0 1 1 0 0 2 0 0 2 0 0 0 0 0 0 0 4 0 2 0 0 0 6 47 L1/LTR repeats
48 1 0 0 0 0 0 0 1 0 0 1 0 0 1 0 0 0 0 0 0 0 6 0 0 0 0 1 5 48 Satellite repeat
49 0 0 0 0 0 0 0 0 0 0 0 0 0 0 0 0 0 0 0 0 0 0 0 0 0 0 0 0 49 Satellite repeat; moderate mapping bias
50 0 0 0 0 0 0 0 0 0 0 0 0 0 0 0 0 0 0 0 0 0 0 0 0 0 0 0 0 50 Satellite repeat; high mapping bias
51 0 0 0 0 0 0 0 0 0 0 0 0 0 0 0 0 0 0 0 0 0 1 0 0 0 0 0 2 51 Satellite repeat/rRNA; extreme mapping bias
consequent low expression of the iC9 transgene. To experimen-tally validate this hypothesis, we performed in vitro experiments with iC9-T cells generated for clinical use, sorted into CD19Lo and
CD19Hi populations by surface CD19 expression (Supplementary
Figure S4). We quantitated iC9 transgene expression (mRNA) by quantitative PCR while controlling for proviral insertion copy numbers (genomic DNA) in either steady state condition or fol-lowing activation with CD28/OKT3 mAbs. As expected, iC9 trans-gene expression is functionally tied to proviral integration copies and mirrors surface CD19 expression. By quantitative PCR quan-titation, iC9 transgene level in activated CD19Lo cells surpassed
steady state CD19Hi cells. Furthermore, fold increase of iC9
trans-gene expression was greater in CD19Lo versus CD19Hi cells upon
activation with CD28/OKT3 mAbs (Supplementary Figure S4).
Epigenetic changes and transcriptional regulation of nearby host promoters
We next examined the epigenetic features proximal to the VIS and functional properties of nearby host promoter/enhancers that
may also affect the iC9 transgene expression and consequent sen-sitivity to CID treatment.
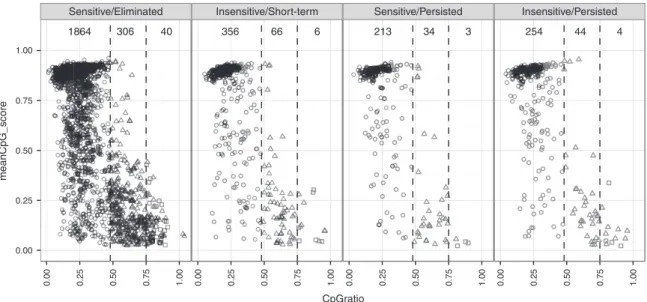
Methylation profile of VIS-flanking CpG dinucleotides. We
investigated the influence of peripheral CpG methylation on transgene expression by querying the methylation status, CpG ratio, and GC content of VIS-flanking sequences using meth-ylCRF estimates for CD4+ memory T cells.17,18 In general, we
observed low GC frequency and concomitantly high methyla-tion for VIS-adjacent sequences (Figure 4). Of the 3,203 VIS-adjacent regions, 2,687 (83.9%), 450 (14.0%), and 53 (1.6%) were categorized as low CpG promoters (LCP), intermediate CpG promoters (ICP), or high CpG promoters (HCP), respec-tively, while four VIS-adjacent regions were not categorized. Overall, the methylation profile distribution for GRV VIS is skewed toward low CpG density with high methylation, where-as RefSeq TSS are typically of high CpG density at low methyla-tion.18 No clear association of VIS sensitivity was observed to
CID treatment.
Figure 3 Chemical inducer of dimerization (CID) response profiles of unique vector integration sites (VIS). For each gamma retroviral VIS, we estimate VIS copy number by tallying only sequencing read counts found within +100 bp of VIS, normalized by overall quantitative PCR trans-gene copy number per peripheral blood mononuclear cell sample. Time-scale plot of normalized VIS copy number for (a) Pt. 1, (b) Pt. 2, (c) Pt. 4, (d) Pt. 5. VIS present only before CID (pre-CID) were defined as “Eliminated” while VIS present at the last time point (i.e., late-CID) were considered “Persisted,” remaining VIS were termed “Short-term.” We also considered whether copy number change pre- versus post-CID infusion was either negative or positive (“Sensitive” versus “Insensitive”) to CID induction, respectively. Using these criteria, we segregated recovered VIS into four broad CID profiles (“Sensitive/Eliminated,” “Insensitive/Short-term,” “Sensitive/Persisted,” and “Insensitive/Persisted”).
b
d a
c
Nor
maliz
ed read count
Nor
maliz
ed read count
Nor
maliz
ed read count
Nor
maliz
ed read count
n = 274 n = 167 n = 71 n = 138 n = 523 n = 51 n = 123 n = 51
n = 645 n = 46 n = 21 n = 14
n = 770 n = 166 n = 36 n = 107
Patient 1 Patient 2
DNase-hypersensitive sites near VIS. We examined the spac-ing and density of open chromatin near the VIS usspac-ing DNase-seq dataset for primary CD4+ memory T cells.19–22 For each VIS, we
surveyed ±10 kb of the flanking region for sequencing coverage at 10 bp smoothing resolution (Figure 5) according to the response to CID as described in Figure 3. We observed a distinctive dou-ble peak around the VIS, which was clean and evenly spaced for VIS categorized as Sensitive/Eliminated. However, the pattern is devolved for the other three groups: Insensitive/Short-term per-sisted, Sensitive/Perper-sisted, and Insensitive/Persisted in relation to CID response. In these three groups, coverage pattern are often multipeaked with far larger amplitudes than the central VIS peak (Figure 5), suggesting dynamic local chromatin flux potentially influencing long terminal repeat (LTR) activity.
Transcriptional interference due to the orientation of VIS.
We investigated whether the proximity and functional proper-ties of nearby host promoter/enhancers could cross-modulate GRV LTR activity and cause transcriptional interference (TI). We used the recently released FANTOM5 CAGE dataset and identi-fied individual CAGE peaks in CD4+ memory T cells (Haberle V:
CAGEr: R package version 1.8.1.) and consolidated these peaks into “CAGE tag clusters” (CTSS).23 We categorized these de novo
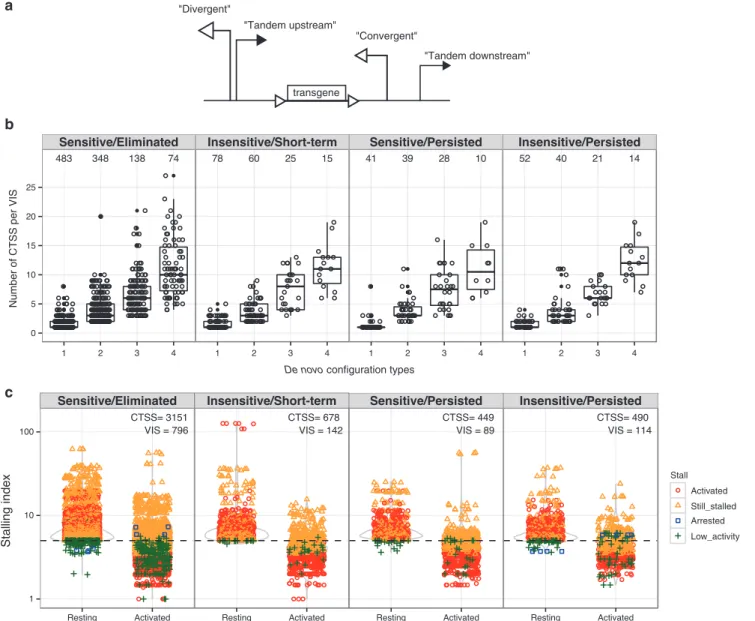
tandem configurations by the relative orientation of CTSS to VIS within ±1 kb distance as either: “divergent” when the CTSS is up-stream and opposite VIS; “convergent” when the CTSS is down-stream and reads into VIS; and “tandem” if the orientation of up/ downstream CTSS and VIS are the same. Approximately 49% (1,553 out of 3,203) of total VIS were located near at least one CTSS
Figure 4 CpG methylation profile for vector integration sites (VIS) flanking regions. Scatter plots showing mean CpG dinucleotide methylation status (0.0–1.0; null to methylated) versus CpG ratio over ± 1 kb VIS-flanking region. Each point represents one VIS and is classified as low CpG pro-moters (LCP: circle), intermediate CpG propro-moters (ICP: triangle), or high CpG propro-moters (HCP: square). Scatter plots are subcategorized according to chemical inducer of dimerization (CID) response profile (Sensitive/Eliminated, Insensitive/Short-term, Sensitive/Persisted, Insensitive/Persisted) and their pre-CID copy number levels.
1864
Sensitive/Eliminated Insensitive/Short-term Sensitive/Persisted
CpGratio
meanCpG_score
Insensitive/Persisted
306 40 356 66 6 213 34 3 254 44 4
Figure 5 Distribution patterns of chromatin marks around vector integration sites (VIS). Sequencing coverage density of DNase-seq reads at VIS-flanking regions (±10 kb) smoothed at 10 bp resolution. Normalized density calculated as reads per million reads.
DNase-Seq Sensitive/Eliminated
Reads per million reads
Insensitive/Short-term Sensitive/Persisted Insensitive/Persisted
−
10000 −5000 5000 10000
0
−
10000 −5000 5000 10000
0
−
10000 −5000 5000 10000
0
−
10000 −5000 5000 10000
0
at ±1 kb distance. Among these 1,553 VIS-proximal regions, we observed up to four interference configurations surrounding each VIS: divergent, convergent, upstream tandem, and downstream tandem (Figure 6a). We grouped VIS-associated regions by con-figuration complexity (i.e., more than one de novo interference configurations) and categorized them according to both NVC levels at time of GvHD onset and response to CID (Figure 6b,c). VIS located among CTSS-dense regions ranked higher for com-plexity. Approximately 22% (692) VIS are surrounded by one TI configuration and 16% (521), 7% (221), and 4% (133) have 2, 3, and 4 TI configurations, respectively (Figure 6b). We observed no correlation of interference configuration complexity with CID sensitivity.
TI and RNA polymerase II pausing. In addition to TI imparted by the orientation of the retroviral LTR insertion, mechanisms which govern RNPII (RNA polymerase II) initiation and elonga-tion are likely also important.24–26 We surveyed RNPII ChIP-seq
data from primary CD4+ T cells19 for both unphosphorylated
(ini-tiating; II0) and phospho-Ser5 (elongating; IIA) forms of RNPII at each CTSS. We systematically calculated “Stalling Index” de-fined as enrichment of RNPII at CTSS (maximum read depth −300 to +600) versus median read depth spanning up to +10 kb downstream of the CTSS (modified from ref. 26). For this analy-sis, we again categorized VIS by their CID sensitivity profile and compared the distributions of RNP2 stalling indices under both resting and TCR-activated status.21 Integrating these criteria, we
Figure 6 Transcriptional interference configurations created through proviral insertion. Retroviral integration amidst known transcriptional start sites generates de novo promoter configurations leading to transcriptional interference. For each VIS, CTSS contained within ±1 kb flank-ing regions are described by their relative orientation to VIS as divergent, convergent, upstream tandem, or downstream tandem. (a) Schematic representation of promoter arrangements between provirus and CTSS. In CTSS-dense regions, multiple CTSS:VIS orientation pairings are possible. (b) Each VIS-flanking region is further grouped according to its total unique configuration multiplexity and plotted against total CTSS per VIS-flanking region. (c) Distribution plot of Stalling Index observed at 6,210 CTSS within 1,210 VIS-flanking regions in either “Resting” or “Activated TCR” states. Each VIS-flanking region is categorized by their relative Stalling Index change concordant with TCR (T-cell receptor) activation as: “activated,” “still stalled,” “arrested,” “low activity.” Threshold for stalling set at 5 per Zeitlinger et al.26 CTSS, CAGE tag clusters; VIS, vector integration sites.
a
b
c
transgene
"Tandem downstream" "Convergent"
"Tandem upstream" "Divergent"
De novo configuration types
Activated Stall
categorized CTSS near VIS by their relative RNPII enrichment ratio change upon TCR activation (Resting to Activated) with a threshold set at 5. Stalled promoters with indices falling below threshold were defined as “activated.” Conversely promoters whose index change surpassing threshold were termed “arrested,” while promoters with ratios not crossing the threshold were de-fined as “still stalled” (above 5) or “low activity” (below 5). In total we found 6,210 CTSS with significant RNPII enrichment within 1 kb distance of 1,210 VIS (a slight decrease from 1,553 VIS in
Figure 6c). Of the 6,210 CTSS, 3,811 (61.3%) were released from their stalled states upon TCR activation, 2,067 (33.3%) remained stalled while very few CTSS (8) (<0.1%) had stalling ratio increase above threshold upon TCR activation, and 324 (5.2%) had low activity (Figure 6c).
DISCUSSION
High-definition mapping of VIS from four patients infused with iC9-T cells after haplo-HSCT allowed us to assess the in vivo
clonal dynamics of VIS in iC9-T cells that expanded exponen-tially during clinical manifestations of GvHD and contracted after administration of the apoptosis-inducing CID. We found that VIS are preferentially located near promoter/enhancer regions and are efficiently eliminated without bias of selection when the iC9 safety switch is activated by CID. With respect to long-term persisting iC9-T cells not eliminated by CID, we hypothesize that both low transcription activity and local genome context flanking VIS may contribute to reducing proviral transgene expression in vivo.
Mapping of VIS with respect to genomic elements in geneti-cally modified T lymphocytes has been used previously to assess the safety of GRV.11,13,27 The strength of our analysis relies on the
extensive characterization of VIS using recently available epi-genetic and promoter-level atlases to query biological questions underpinning not only the safety of GRV transduction in T lym-phocytes, but also the in vivo efficacy of the inserted suicide gene. The safety of GRV is highly dependent on their genomic inser-tion, as is clearly documented by the insertional mutagenesis in hematopoietic stem cells.28 To characterize VIS in T lymphocytes,
we considered several facets of host transcriptional regulation including: chromatin accessibility, CpG methylation profile, chro-matin mark patterning, RNPII enrichment, gene expression, and TSS. Making use of bioinformatics tools such as ChromHMM and GREAT,15,16 and also previous GRV11,13 and lentiviral
inser-tion data sets,14 we determined that VIS from GRV are biased for
promoter/enhancer-associated states, whereas lentiviral integra-tions target actively transcribed regions. Moreover, gene ontology enrichment analysis of GRV integration in cis-regulatory regions of genes reveal significant association with T-cell–related func-tions, which is in agreement with GRV integration preference for transcriptionally active regions at time of transduction ex vivo.13
Nevertheless, despite integrating near active gene promoters,11
no oncogenic T-cell transformation has been reported in clinical trials using human T cells genetically modified with GRV so far, underlining the safety of these viruses in T lymphocytes.
To assess the efficacy of the inserted suicide gene in T lym-phocytes, we summarized VIS clonal dynamics into four distinct profiles (Sensitive/Eliminated, Insensitive/Short-term, Sensitive/ Persisted, and Insensitive/Persisted) according to their response
to CID and normalized VIS copy number (NVC) over time. It is important to note that transduction of T lymphocytes ex vivo
results in a range of VIS multiplicity per transduced clone, with the cumulative iC9 expression tuned by transcriptional output per transgene copy. Thus, genetically identical progeny cells from a single transduced T-cell lineage will have different levels of trans-gene expression depending on their individual phenotypic status and external factors. While it is impossible to clonally segregate VIS by sequencing bulk T lymphocytes, we proposed a degree of stratification for VIS clonal populations by examining their copy number fluctuation over time. We reasoned that alloreac-tive iC9-T cell lineages causing GvHD are more proliferaalloreac-tive than nonalloreactive cells, which means they have greater progeny numbers and corresponding VIS copy numbers. We found that the majority (roughly 75–87%) of VIS with high NVC at time of GvHD onset were eliminated by CID administration (Sensitive/ Eliminated), while the remaining VIS detectable long-term post-CID were generally characterized by low NVC (Sensitive/ Persisted and Insensitive/Persisted). Among the four patients we studied, VIS of Pt. 1 seem to be an exception to this categorization. Of note, iC9-T cells of Pt. 1 contained the highest proportion of CD4+ T cells at the time of GvHD occurrence compared to the
other three patients.2,3 Whether the predominance of CD4+ T cells
alters the predicted clonal dynamics of VIS remains to be investi-gated. However, Pt. 1 clinically responded to the administration of CID with resolution of GvHD as observed in the other patients.2,3
We propose two possible explanations for the existence of VIS and corresponding iC9-T cells not eliminated by CID. The first is that these cells are in a quiescent state in vivo with little or no transcriptional activity and have insufficient expression of
iC9 to trigger apoptosis. This description fits with the in vitro data showing that within the iC9-T cell bulk cells, we can identify cells with low transcriptional activity in the absence of TCR stimula-tion (Supplementary Figure S4), and the evidence that iC9-T cells spared by CID fall in the VIS category of low NVC at time of GvHD onset. This explanation is also consistent with the previ-ous observation that quiescent T lymphocytes transduced with a GRV encoding a TCR show transgene downregulation in vivo.29
The second possibility is that heterogeneous CID susceptibility in iC9-T lineages harboring multiple VIS is due to cell-extrinsic stimuli manifesting at the genome level to modulate transcrip-tional output of individual transgene unit.
De novo DNA methylation of the virus LTRs is a well-recognized mechanism downregulating transgene expression in hematopoi-etic stem cells.30 However, recent evidence precludes CpG
methyla-tion of GRV LTRs as a distinct suppressive mechanism for proviral transgene expression in T lymphocytes in vivo.29 Our analysis
in terms of both promoter configuration and RNPII regulation31
to illustrate the intricate trafficking required to ensure availabil-ity of preinitiation complexes to proviral LTR (Supplementary Figure S6—“Stalled RNPII interference”). We noted >95% of all host promoter-associated RNPII are in fact stalled, leading to demonstrable TI effects.32,33 Furthermore, 60% of these promoters
are fully released upon TCR activation and 35% have decreased stalling indices. Since external stimuli are involved in determin-ing the functional status of iC9-T cells in vivo, it is plausible that a dynamic process such as TCR stimulation rather than static repres-sion mechanisms, such as epigenetic marks, affects gene promoters proximal to VIS promoting their transition from transcriptionally paused promoters to released promoters (Supplementary Figure S7). TCR stimulation may thus indirectly modulate iC9 expression by alleviating transcriptional repression from nearby host promot-ers and promote iC9 mRNA expression as demonstrated by the experiment performed in vitro (Supplementary Figure S4).
In conclusion, we demonstrate here clonal dynamics of T lym-phocytes engineered with the iC9 safety switch can be followed by longitudinal VIS mapping, and that based on bioinformatics analysis, there is no selection bias for either the in vivo expan-sion or CID-mediated elimination of iC9-T cells. We propose that CID-mediated elimination of iC9-T cells is determined by a mini-mum expression threshold for iC9 transgene, which is dependent on TCR activation state of the iC9-T cells, as well as cis-acting influences by host promoters on the proviral transgene.
MATERIALS AND METHODS
Patients and study design. The CASPALLO trial IND 13813 was previously
described.2,3 It was designed to assess the safety and efficacy of escalating
doses of donor-derived T cells genetically modified with a GRV
(gammaret-roviral vector) to express the iC9 and ΔCD19 transgenes in patients
under-going haplo-HSCT.2,34 Patients who developed acute GvHD grade I or II after
infusion of iC9-T cells received 0.4 mg/kg of the CID (AP1903/Rimiducid,
Bellicum Pharmaceuticals, Houston, TX).2 We set out to analyze total VIS
diversity over time in four patients who developed GvHD after the infusion
of iC9-T cells and were treated with CID to delete alloreactive iC9-T cells.2,3
Table 1 summarizes the characteristics of the analyzed samples. The clinical study was approved by the institutional review board of Baylor College of Medicine and the FDA and reviewed by the Recombinant DNA Advisory Committee.
Amplification and sequencing of VIS. Genomic DNA was isolated from fro-zen peripheral blood mononuclear cells using the Qiagen DNA extraction kit according to manufacturer instructions, then whole genome amplified by REPLI-G Mini kit (Qiagen, Hilden, Germany). For targeted amplifi-cation of retroviral integration sites, we used fusion primers and nested integrated PCR, in a modification of the previously published
flanking-sequence exponential anchored PCR.35 Additional methodologies
describ-ing the mappdescrib-ing and analysis of the VIS are provided in Supplementary
Materials and Methods and Supplementary Figure S8. Data analysis and graphing were done using the R packages data tables, dplyr and ggplot2.
SUPPLEMENTARY MATERIAL
Figure S1. Functional annotation and gene ontology enrichment of lentiviral integration sites.
Figure S2. Calculated copy numbers of unique VIS.
Figure S3. Venn diagram and GRV VIS breakdown by patient, CID profile and collection time.
Figure S4. Detection of iC9 copy numbers at mRNA and DNA levels in iC9-T cells ex vivo.
Figure S5. CpG methylation profile for TSS flanking regions.
Figure S6. Model for transcriptional interference due to Pol II pausing on host promoters near VIS.
Figure S7. Model for predicted transgene expression among all iC9-T cells harboring multiple proviral iC9 transgene integrations.
Figure S8. Flow chart of the methodology.
Materials and Methods
ACKNOWLEDGMENTS
We thank David M Spencer (Bellicum Pharmaceuticals, Inc.) and Margaret Goodell (Baylor College of Medicine) for a critical reading of the manuscript; Bellicum Pharmaceuticals, Inc., which provided the AP1903; and Catherine Gillespie for the manuscript editing. E.C.C. was supported by T32HL092332. The clinical protocol (NCT00710892 and IND13813) was supported by NIH-NHLBI grant U54HL08100, and development of the caspase system was supported by P01CA094237 and P50CA126752. We appreciate support from P30 CA125123 NCI through the Bioinformatics and Biostatistics and Cell and Vector Production Shared Resources of the Dan L. Duncan Cancer. E.C.C. designed experiments, performed the experiments, analyzed the data, and wrote the manuscript; H.L. performed the statistical analysis; X.Z. collected and analyzed the clinical samples; O.D. performed quantita-tive PCR on patient samples; D.A.W. provided expertise in sequencing analysis; H.E.H. ensured compliance with regulatory requirements for the clinical trial; M.K.B. is the PI of the clinical study; G.D. designed experiments and wrote the manuscript. All the authors reviewed and approved the final version of the manuscript. The Center for Cell and Gene Therapy has a collaborative research agreement with Celgene.
REFERENCES
1. Ciceri, F, Bonini, C, Stanghellini, MT, Bondanza, A, Traversari, C, Salomoni, M
et al. (2009). Infusion of suicide-gene-engineered donor lymphocytes after family haploidentical haemopoietic stem-cell transplantation for leukaemia (the TK007 trial): a non-randomised phase I-II study. Lancet Oncol 10: 489–500.
2. Di Stasi, A, Tey, SK, Dotti, G, Fujita, Y, Kennedy-Nasser, A, Martinez, C et al. (2011). Inducible apoptosis as a safety switch for adoptive cell therapy. N Engl J Med 365: 1673–1683.
3. Zhou, X, Di Stasi, A, Tey, SK, Krance, RA, Martinez, C, Leung, KS et al. (2014). Long-term outcome after haploidentical stem cell transplant and infusion of T cells expressing the inducible caspase 9 safety transgene. Blood 123: 3895–3905. 4. Morgan, RA, Yang, JC, Kitano, M, Dudley, ME, Laurencot, CM and Rosenberg, SA
(2010). Case report of a serious adverse event following the administration of T cells transduced with a chimeric antigen receptor recognizing ERBB2. Mol Ther 18: 843–851.
5. Morgan, RA, Chinnasamy, N, Abate-Daga, D, Gros, A, Robbins, PF, Zheng, Z et al.
(2013). Cancer regression and neurological toxicity following anti-MAGE-A3 TCR gene therapy. J Immunother 36: 133–151.
6. Linette, GP, Stadtmauer, EA, Maus, MV, Rapoport, AP, Levine, BL, Emery, L et al.
(2013). Cardiovascular toxicity and titin cross-reactivity of affinity-enhanced T cells in myeloma and melanoma. Blood 122: 863–871.
7. Traversari, C, Marktel, S, Magnani, Z, Mangia, P, Russo, V, Ciceri, F et al. (2007). The potential immunogenicity of the TK suicide gene does not prevent full clinical benefit associated with the use of TK-transduced donor lymphocytes in HSCT for hematologic malignancies. Blood 109: 4708–4715.
8. Arber, C, Abhyankar, H, Heslop, HE, Brenner, MK, Liu, H, Dotti, G et al. (2013). The immunogenicity of virus-derived 2A sequences in immunocompetent individuals.
Gene Ther 20: 958–962.
9. Straathof, KC, Pulè, MA, Yotnda, P, Dotti, G, Vanin, EF, Brenner, MK et al. (2005). An inducible caspase 9 safety switch for T-cell therapy. Blood 105: 4247–4254. 10. Bonini, C, Ferrari, G, Verzeletti, S, Servida, P, Zappone, E, Ruggieri, L et al. (1997).
HSV-TK gene transfer into donor lymphocytes for control of allogeneic graft-versus-leukemia. Science 276: 1719–1724.
11. Recchia, A, Bonini, C, Magnani, Z, Urbinati, F, Sartori, D, Muraro, S et al. (2006). Retroviral vector integration deregulates gene expression but has no consequence on the biology and function of transplanted T cells. Proc Natl Acad Sci USA 103: 1457–1462.
12. Cattoglio, C, Facchini, G, Sartori, D, Antonelli, A, Miccio, A, Cassani, B et al. (2007). Hot spots of retroviral integration in human CD34+ hematopoietic cells. Blood 110:
1770–1778.
13. Cattoglio, C, Maruggi, G, Bartholomae, C, Malani, N, Pellin, D, Cocchiarella, F et al.
(2010). High-definition mapping of retroviral integration sites defines the fate of allogeneic T cells after donor lymphocyte infusion. PLoS One 5: e15688. 14. Sherrill-Mix, S, Lewinski, MK, Famiglietti, M, Bosque, A, Malani, N, Ocwieja, KE
et al. (2013). HIV latency and integration site placement in five cell-based models.
Retrovirology 10: 90.
15. Ernst, J and Kellis, M (2010). Discovery and characterization of chromatin states for systematic annotation of the human genome. Nat Biotechnol 28: 817–825. 16. McLean, CY, Bristor, D, Hiller, M, Clarke, SL, Schaar, BT, Lowe, CB et al. (2010).
17. Stevens, M, Cheng, JB, Li, D, Xie, M, Hong, C, Maire, CL et al. (2013). Estimating absolute methylation levels at single-CpG resolution from methylation enrichment and restriction enzyme sequencing methods. Genome Res 23: 1541–1553. 18. Weber, M, Hellmann, I, Stadler, MB, Ramos, L, Pääbo, S, Rebhan, M et al. (2007).
Distribution, silencing potential and evolutionary impact of promoter DNA methylation in the human genome. Nat Genet 39: 457–466.
19. Schones, DE, Cui, K, Cuddapah, S, Roh, TY, Barski, A, Wang, Z et al. (2008). Dynamic regulation of nucleosome positioning in the human genome. Cell 132: 887–898. 20. Barski, A, Cuddapah, S, Cui, K, Roh, TY, Schones, DE, Wang, Z et al. (2007).
High-resolution profiling of histone methylations in the human genome. Cell 129: 823–837. 21. Wang, Z, Zang, C, Cui, K, Schones, DE, Barski, A, Peng, W et al. (2009).
Genome-wide mapping of HATs and HDACs reveals distinct functions in active and inactive genes. Cell 138: 1019–1031.
22. Cuddapah, S, Jothi, R, Schones, DE, Roh, TY, Cui, K and Zhao, K (2009). Global analysis of the insulator binding protein CTCF in chromatin barrier regions reveals demarcation of active and repressive domains. Genome Res 19: 24–32. 23. Forrest, AR, Kawaji, H, Rehli, M, Baillie, JK, de Hoon, MJ, Haberle, V et al. (2014). A
promoter-level mammalian expression atlas. Nature 507: 462–470. 24. Adelman, K, Kennedy, MA, Nechaev, S, Gilchrist, DA, Muse, GW, Chinenov, Y
et al. (2009). Immediate mediators of the inflammatory response are poised for gene activation through RNA polymerase II stalling. Proc Natl Acad Sci USA 106: 18207–18212.
25. Adelman, K and Lis, JT (2012). Promoter-proximal pausing of RNA polymerase II: emerging roles in metazoans. Nat Rev Genet 13: 720–731.
26. Zeitlinger, J, Stark, A, Kellis, M, Hong, JW, Nechaev, S, Adelman, K et al. (2007). RNA polymerase stalling at developmental control genes in the Drosophila melanogaster
embryo. Nat Genet 39: 1512–1516.
27. Gabriel, R, Eckenberg, R, Paruzynski, A, Bartholomae, CC, Nowrouzi, A, Arens, A et al.
(2009). Comprehensive genomic access to vector integration in clinical gene therapy.
Nat Med 15: 1431–1436.
28. Hacein-Bey-Abina, S, Von Kalle, C, Schmidt, M, McCormack, MP, Wulffraat, N, Leboulch, P et al. (2003). LMO2-associated clonal T cell proliferation in two patients after gene therapy for SCID-X1. Science 302: 415–419.
29. Burns, WR, Zheng, Z, Rosenberg, SA and Morgan, RA (2009). Lack of specific gamma-retroviral vector long terminal repeat promoter silencing in patients receiving genetically engineered lymphocytes and activation upon lymphocyte restimulation.
Blood 114: 2888–2899.
30. Stewart, CL, Stuhlmann, H, Jähner, D and Jaenisch, R (1982). De novo methylation, expression, and infectivity of retroviral genomes introduced into embryonal carcinoma cells. Proc Natl Acad Sci USA 79: 4098–4102.
31. Palmer, AC, Egan, JB and Shearwin, KE (2011). Transcriptional interference by RNA polymerase pausing and dislodgement of transcription factors. Transcription 2: 9–14.
32. Palmer, AC, Ahlgren-Berg, A, Egan, JB, Dodd, IB and Shearwin, KE (2009). Potent transcriptional interference by pausing of RNA polymerases over a downstream promoter. Mol Cell 34: 545–555.
33. Lenasi, T, Contreras, X and Peterlin, BM (2008). Transcriptional interference antagonizes proviral gene expression to promote HIV latency. Cell Host Microbe 4: 123–133.
34. Tey, SK, Dotti, G, Rooney, CM, Heslop, HE and Brenner, MK (2007). Inducible caspase 9 suicide gene to improve the safety of allodepleted T cells after haploidentical stem cell transplantation. Biol Blood Marrow Transplant 13: 913–924.
35. Pule, MA, Rousseau, A, Vera, J, Heslop, HE, Brenner, MK and Vanin, EF (2008). Flanking-sequence exponential anchored-polymerase chain reaction amplification: a sensitive and highly specific method for detecting retroviral integrant-host-junction sequences. Cytotherapy 10: 526–539.