Asset Management Plan
Roading 2015-2016
Contents
Contents ... 1
List of Figures ... 4
List of Tables ... 7
1
Introduction ... 10
1.1 Location ... 10
1.2 Natural Features ... 10
1.3 Economy ... 11
1.4 Climate ... 11
1.5 Population ... 11
1.6 Infrastructure... 11
1.7 Roading at a Glance ... 12
1.8 Asset Management Objective ... 14
1.9 Asset Management Level ... 14
1.10 Audience ... 15
1.11 Timeframes ... 15
1.12 Assumptions and Limitations ... 16
1.13 Structure ... 16
2
Strategic Environment ... 18
2.1 Overview ... 18
2.2 Rationale for Involvement ... 20
2.3 Significance Policy... 21
2.4 Strategic Assets ... 21
2.5 Stakeholders ... 21
2.6 External Organisations ... 25
2.7 National Strategies and Plans ... 27
2.8 District Strategies, Plans, Policies and Bylaws ... 42
2.9 Plan Use ... 44
2.10 Asset Management Policy ... 45
3
Description of Assets ... 48
3.1 Overview ... 48
3.2 Asset Description ... 49
3.3 Terminology ... 51
3.4 Network Hierarchy ... 52
3.5 Other Facets ... 54
4
Levels of Service ... 56
4.1 Overview ... 56
4.2 Council Outcomes ... 57
4.3 Consultation ... 59
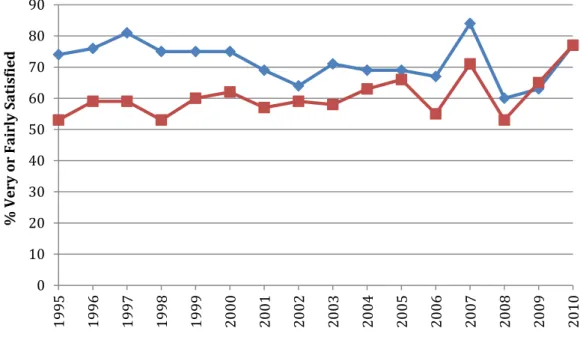
4.4 Customer Surveys ... 61
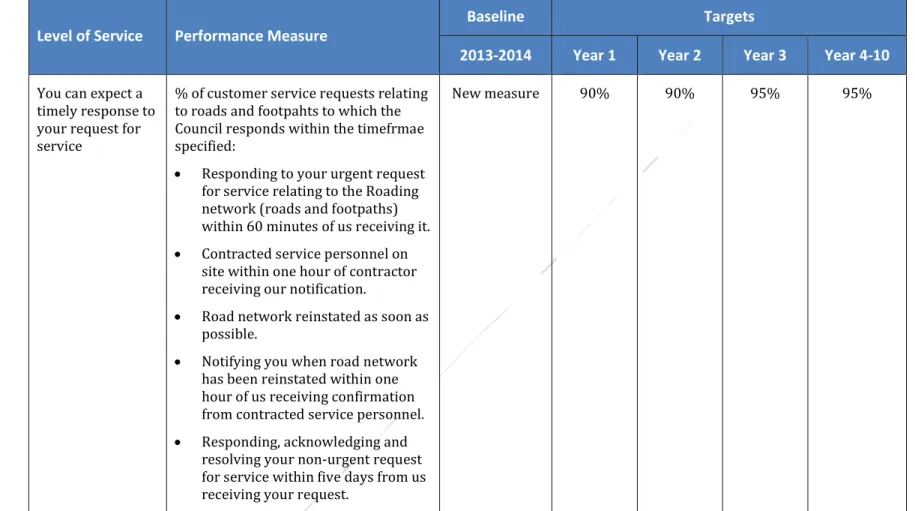
4.5 Service Requests ... 62
4.6 Local Government Act 2002 ... 64
4.7 Existing Levels of Service ... 66
4.8 Desired Levels of Service ... 72
5
Growth and Demand ... 73
5.1 Overview ... 73
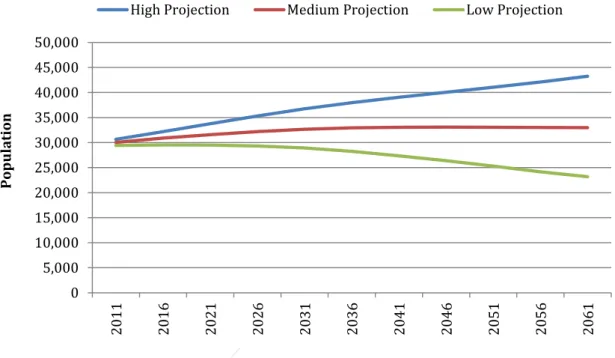
5.2 Population Projections ... 75
5.3 Influences on Roading ... 78
5.5 Planning for Growth and Demand ... 83
5.6 Proposed Improvements ... 90
5.7 Development Contributions ... 97
6
Environmental Management ... 100
6.1 Overview ... 100
6.2 Legislation ... 100
6.3 Horizons One Plan ... 102
6.4 District Plan ... 102
6.5 Long Term Plan ... 102
6.6 Regional Land Transport Strategy ... 102
6.7 National Land Transport Programme (NLTP) ... 103
6.8 Resource Consents ... 104
6.9 Potential Issues ... 105
6.10 Hazards ... 108
6.11 Future Requirements ... 111
7
Lifecycle Management ... 112
7.1 Overview ... 112
7.2 Road Pavements ... 128
7.3 Drainage ... 166
7.4 Drainage ... 181
7.5 Bridges ... 194
7.6 Retaining Walls ... 215
7.7 Street Lighting ... 221
7.8 Traffic Services ... 240
7.9 Environmental Management ... 263
7.10 Emergency Works ... 269
8
Financial Management ... 271
8.1 Introduction ... 271
8.2 Financial Strategy ... 271
8.3 Expenditure Trends ... 272
8.4 Financial Summary ... 272
8.5 Renewals ... 279
8.6 Valuations ... 280
8.7 Valuation Report ... 282
8.8 Funding ... 282
8.9 Assumptions ... 285
8.10 Confidence ... 285
8.11 Issues ... 286
9
Risk Management ... 287
9.1 Overview ... 287
9.2 Framework ... 287
9.3 Strategic Objectives ... 288
9.4 Risk Management Process ... 288
9.5 Monitoring, Review and Reporting ... 296
9.6 Current Status ... 297
9.7 Business Continuity ... 304
9.8 Organisational Risk Identification ... 305
9.9 Manawatu District Plan ... 308
9.10 Civil Defence Emergency Management ... 312
9.11 Network Events ... 313
10
Asset Management Practices ... 317
10.1 Data Management ... 317
10.3 Quality Assurance ... 331
10.4 Asset Management Processes ... 332
11
Plan Implementation ... 333
11.1 Council Commitment ... 333
11.2 Appropriate Level ... 333
11.3 Past Achievements ... 333
11.4 Improvement Process ... 334
11.5 Review and Monitoring ... 337
11.6 Improvement Plan ... 338
Appendices ... 348
Appendix I - Proposed ONRC Levels of Service ... 349
List of Figures
Figure 1-1: Manawatu District ... 10
Figure 1-2: Replacement Cost by Asset Type ... 13
Figure 2-1: Outcomes and Levels of Service ... 19
Figure 2-2: NZTA Functions ... 26
Figure 2-3: Peer Review Scoring – October 2013 ... 47
Figure 3-1: Assets by Type ... 50
Figure 3-2: Asset Valuation ... 51
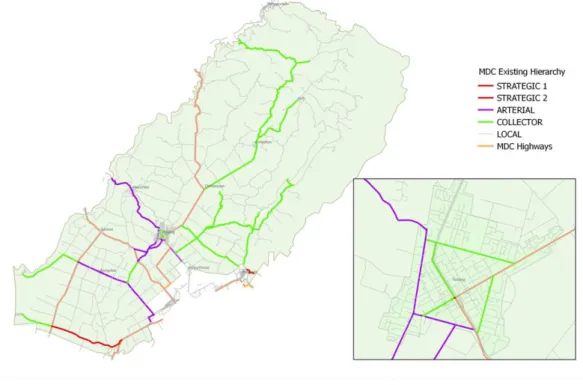
Figure 3-3: Roading Network ... 53
Figure 3-4: Hierarchy Lengths ... 54
Figure 4-1: Communitrak Survey Results 1995-2010... 62
Figure 4-2: Service Requests by Type 2000-2013 ... 63
Figure 4-3: Number of Service Requests 2000-2013 ... 63
Figure 5-1: Population Projections 2011-2061 ... 75
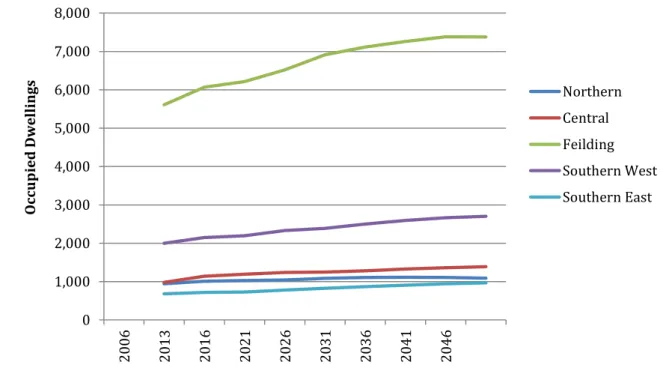
Figure 5-2: Occupied Dwelling Estimates 2013 - 2046 ... 76
Figure 5-3: Age and Gender (2013 Census) ... 77
Figure 5-4: Roads by Average Daily Traffic ... 84
Figure 5-5: Capacity Change from New Works ... 97
Figure 7-1: Assets by Replacement Cost ... 115
Figure 7-2: Proactive vs. Reactive Maintenance ... 116
Figure 7-3: Area-wide Pavement Rehabilitation (Apiti Road 2014) ... 129
Figure 7-4: Roads by Average Daily Traffic Volume ... 130
Figure 7-5: Network by Average Daily Traffic Volume ... 131
Figure 7-6: Historic Expenditure – Pavements (Subsidised) ... 133
Figure 7-7: Flushing ... 139
Figure 7-8: Smooth Travel Exposure 2001-2014 ... 140
Figure 7-9: NAASRA Counts – Urban Roads (NZTA) ... 141
Figure 7-10: Road Reconstruction (Pharazyn Street 2014) ... 143
Figure 7-11: Top Surface Remaining by Year Sealed... 145
Figure 7-12: Remaining Life – Top Surface ... 146
Figure 7-13: Resealing Lengths by Year ... 147
Figure 7-14: Historic Expenditure – Resealing (Total) ... 148
Figure 7-15: Historic Expenditure – Resealing (Cost/Length) ... 148
Figure 7-16: Pavement Rehabilitation by Length (Sealed Roads) ... 149
Figure 7-17: Historic Expenditure – Pavement Rehabilitation ... 149
Figure 7-18: Historic Expenditure – Pavement Rehabilitation (Cost/Length) ... 149
Figure 7-19: Forward Works Programme – Reasealing and Area-wide Treatment (Draft) ... 153
Figure 7-20: Projected Cost - Resealing ... 154
Figure 7-21: Projected Cost – Pavement Rehabilitation ... 154
Figure 7-22: Historic Expenditure – Re-metalling ... 160
Figure 7-23: Grading Frequencies by Location ... 162
Figure 7-24: Recent Kerb and Channel (Denbigh Street, Feilding) ... 167
Figure 7-25: Historic Expenditure - Drainage ... 170
Figure 7-27: 900 mm Culvert Replacement (Leen Road, Feilding 2014) ... 174
Figure 7-28: Asset Condition – Culverts (2013) ... 176
Figure 7-29: Culvert in Poor Condition ... 176
Figure 7-30: Historic Expenditure – Kerb and Channel ... 183
Figure 7-31: Asset Condition – Kerb and Channel (2013-2014) ... 187
Figure 7-32: Historic Expenditure –Surface Water Channels (Rural) ... 190
Figure 7-33: Mangaweka Bridge ... 195
Figure 7-34: Construction Year - Bridges ... 196
Figure 7-35: Asset Age – Bridges and Large Culverts ... 196
Figure 7-36: Kakariki Bridge ... 197
Figure 7-37: Historic Expenditure - Bridges ... 199
Figure 7-38: Bridge Foundation Repair (Oroua Valley Road 2014) ... 204
Figure 7-39: Asset Condition – Bridges and Large Culverts ... 205
Figure 7-40: Bridge Limits Signage ... 207
Figure 7-41: Bridge and Large Culvert Replacements by Year (30-year Projections) ... 209
Figure 7-42: Projected Replacement Cost – Bridges and Large Culverts ... 211
Figure 7-43: Remaining Useful Life – Bridge Decks ... 211
Figure 7-44: Remaining Useful Life – Large Culverts ... 212
Figure 7-45: Slip and Dropout (Main South Road 2013) ... 216
Figure 7-46: Construction Year - Retaining Walls ... 218
Figure 7-47: Asset Condition - Retaining Walls ... 220
Figure 7-48: Lifecycle Cost – GL500 70W HPS Luminaire ... 227
Figure 7-49: Asset Condition - Poles ... 231
Figure 7-50: Asset Condition - Luminaires ... 231
Figure 7-51: Asset Condition - Brackets ... 232
Figure 7-52: Lifecycle Cost – 70W GL500 HPS vs. 30W LED Luminaire ... 236
Figure 7-53: Traffic Services ... 240
Figure 7-54: Armco Guard Rail ... 243
Figure 7-55: Traffic Island ... 245
Figure 7-56: Historic Expenditure – Traffic Services ... 247
Figure 7-57: Level of Safety vs. Road Marking Completion ... 251
Figure 7-58: Asset Condition – Road Signs ... 252
Figure 7-59: Historic Expenditure - Footpaths ... 256
Figure 7-60: Material - Footpaths ... 256
Figure 7-61: Footpath and Cycleway Development ... 262
Figure 7-62: Stock Underpass Installation ... 264
Figure 7-63: Historic Expenditure - Street Cleaning ... 266
Figure 7-64: Vegetation control ... 268
Figure 7-65: Historic Expenditure - Vegetation Control ... 269
Figure 7-66: Flooding ... 270
Figure 8-1: Expenditure Trends ... 272
Figure 8-2: Forecast Expenditure 2015-2025 – Total ... 273
Figure 8-3: Forecast Expenditure 2015-2025 – Subsidised ... 275
Figure 8-4: Forecast Expenditure 2015-2025 - Subsidised ... 276
Figure 8-5: Forecast Expenditure 2015-2025 – Non-subsidised ... 277
List of Tables
Table 1-1: Asset Summary ... 13
Table 1-2: Document Content ... 17
Table 2-1: Key Stakeholders ... 25
Table 2-2: Key Legislation ... 34
Table 2-3: Roles and Responsibilities ... 45
Table 3-1: Asset Components ... 50
Table 3-2: Plan Descriptions ... 52
Table 4-1: Levels of Service ... 58
Table 4-2: LGA Section 10 Test Outcomes ... 66
Table 4-3: Performance Measures (2015-2025) ... 71
Table 5-1: Levels of Service Linkages ... 82
Table 6-1: Consents Held ... 105
Table 7-1: Asset Description (2013 Valuation) ... 114
Table 7-2: Network Length ... 115
Table 7-3: Sealed and Unsealed Roads ... 115
Table 7-4: Network Usage Summary ... 116
Table 7-5: Activity Classes ... 118
Table 7-6: Asset and Condition Monitoring ... 121
Table 7-7: Asset Summary - Pavement ... 130
Table 7-8: Asset Valuation - Pavements ... 131
Table 7-9: Roughness Survey Results ... 141
Table 7-10: Asset Lives – Single-coat Seal ... 144
Table 7-11: Asset Lives – Two-coat Seals ... 144
Table 7-12: Annual Renewal Lengths - Theoretical ... 152
Table 7-13: Carriageway Width vs Average Daily Traffic Volume ... 156
Table 7-14: Carriageway Widths – Unsealed Rural Roads ... 156
Table 7-16: Unsealed Road Types ... 160
Table 7-17: Re-metalling – Annual Volume by Road Category ... 161
Table 7-18: Aggregate Grading Size and Quantities ... 161
Table 7-19: Grading Frequency by Road Category ... 161
Table 7-20: Value of assets ... 167
Table 7-21: Asset Summary - Drainage ... 168
Table 7-22: Roading vs. Stormwater Assets ... 169
Table 7-23: Asset Summary - Culverts ... 172
Table 7-24: Asset Valuation - Culverts ... 172
Table 7-25: Asset Summary - Sumps and Catchpits ... 179
Table 7-26: Asset Valuation – Sumps and Catchpits ... 179
Table 7-27: Asset Valuation – Surface Water Channels ... 181
Table 7-28: Asset Summary – Kerb and Channel ... 183
Table 7-29: Asset Condition – Surface Water Channels ... 186
Table 7-30: Surface Water Channels by Depth ... 190
Table 7-31: Shared Bridges ... 195
Table 7-33: Asset Valuation - Bridges ... 199
Table 7-34: Bridges by Number of Lanes ... 199
Table 7-35: Risk Scores - Significant Bridges ... 200
Table 7-36: Bridge Inspection Checklist ... 203
Table 7-37: Asset Condition Ratings ... 203
Table 7-38: Restricted Load Bridges ... 206
Table 7-39: Replacement Cost – Bridges and Culverts ... 213
Table 7-40: Asset Summary - Retaining Walls ... 217
Table 7-41: Asset Valuation – Retaining Walls ... 217
Table 7-42: Asset Summary - Street Lighting ... 224
Table 7-43: Street Lighting by Owner ... 225
Table 7-44: Asset Summary - Luminaires ... 226
Table 7-45: Asset Summary - Lamps ... 226
Table 7-46: Asset Summary - Poles ... 227
Table 7-47: Asset Valuation - Street Lighting ... 227
Table 7-48: Contractor Response Times ... 229
Table 7-49: Asset Condition Ratings - Street Lighting ... 230
Table 7-50: Useful Life - Lamps ... 233
Table 7-51: Asset Summary - Traffic Services ... 241
Table 7-52: Asset Summary – Road Signs ... 242
Table 7-53: Asset Summary - Guard Rails ... 244
Table 7-54: Material – Guard Rails ... 244
Table 7-55: Asset Summary – Traffic Islands ... 246
Table 7-56: Asset Summary – Edge Marker Posts ... 246
Table 7-57: Asset Valuation - Footpaths ... 255
Table 7-58: Rural vs. Urban Footpaths ... 255
Table 7-59: Asset Summary - Footpaths by Location ... 255
Table 7-60: Asset Value - Berms ... 269
Table 8-1: Forecast Expenditure 2015-2025 – Total ... 274
Table 8-2: Forecast Expenditure 2015-2025 - Non-subsidised ... 278
Table 8-3: Asset Valuation (1 July 2013) ... 282
Table 8-4: Current Financial Assistance Rates (2013-2014) ... 283
Table 8-5: Proposed Financial Assistance Rates (2015-2018) ... 283
Table 8-6: Data Confidence ... 285
Table 9-1: Risk Likelihood Ratings ... 291
Table 9-2: Risk Consequence Ratings ... 293
Table 9-3: Risk Classes ... 294
Table 9-4: Risk Priorities ... 295
Table 9-5: Risk Reporting ... 297
Table 9-6: Risk Register ... 303
Table 9-7: Risk Assessment Matrix ... 306
Table 9-8: Criteria for Risks ... 307
Table 9-9: Known Flooding Issues ... 310
Table 9-10: Active Faults in the Manawatu District ... 311
Table 9-11: Risk Scores ... 313
Table 10-2: RAMM Inventory Item Headings ... 322
Table 10-3: Treatment Types ... 324
Table 10-4: Repair Classifications ... 325
Table 10-5: Data Reliability ... 328
Table 11-1: Improvement Tasks Identified ... 335
Table 11-2: Improvement Budgets ... 335
Table 11-3: Improvement Priorities ... 336
Table 11-4: Improvement Plan Actions ... 345
1
Introduction
1.1
Location
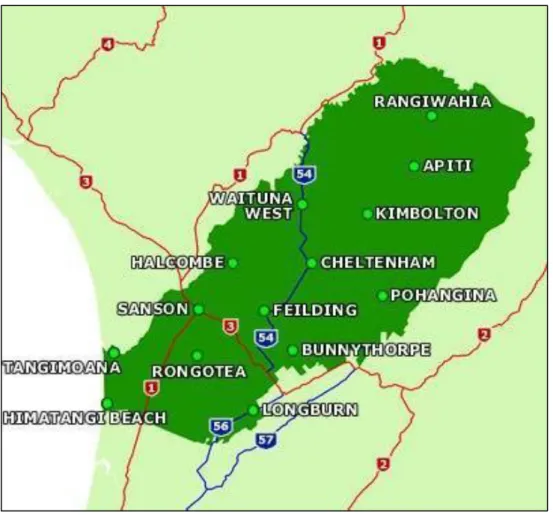
The Manawatu District Council was established on 1 November 1989 with the amalgamation of the five former authorities (Oroua, Kiwitea, Pohangina, Manawatu and Feilding).
The Manawatu District covers an area of 256,300 ha. It stretches from Rangiwahia in the north to Himatangi Beach and Palmerston North in the south. The western boundary is the Rangitikei River and the eastern boundary the Ruahine Ranges.
Figure 1-1: Manawatu District
1.2
Natural Features
The Rangitikei River forms the western boundary of the Manawatu District. The Oroua River is heavily utilised by both Feilding and rural users. A range of natural features exist from the peaks of the Ruahine Ranges to the beautiful Pohangina Valley to the windswept West Coast beaches and dunes.
1.3
Economy
Key industry sectors in the Manawatu include agriculture, forestry, manufacturing, retail trade, health and community services. The District is home to significant livestock and cropping operations. Ohakea Air Base is also located within the District boundary.
Feilding acts as a service centre to the surrounding rural community. It has several rural-based businesses, including the Feilding stock sale-yards. It is also an increasingly attractive place to live with numerous Palmerston North workers choosing to live in Feilding and commute. It has a thriving central business District, with significant national retailers. Smaller communities around the District act as local service centres, with tourism and visitor industries increasingly prominent such as B&B's, cafés and rural homestays.
The District is centrally located with significant regional operations nearby including Palmerston North Airport, Massey University, Linton Army Camp, Palmerston North Hospital and the Universal College of Learning (‘UCOL’).
1.4
Climate
Average annual temperature is 13.3 °C
Average annual rainfall is 967 mm
Sunshine per annum is 1,733 hours
1.5
Population
The total population of Manawatu District is 27,456 from the 2013 Census. This is an increase of 1389 people, or 5 %, since the 2006 Census. Its population ranks 37th in size out of the 67 Districts in New Zealand. Manawatu District has 0.65 % of New Zealand’s population.
Further information on population can be found in Section 5.2 of this Asset Management Plan.
1.6
Infrastructure
The District is serviced with 1,364 km of roads and 380 bridges. State Highways 1, 3, 54 and 56 run through the District.
Feilding is the largest town in the District with a resident population of 14,826 and is well serviced with utilities. A number of rural communities are also connected to water supplies and drainage systems.
Most of the village towns are accessed by state highways or local roads with a mix of reticulated public or private onsite utility infrastructure.
1.7
Roading at a Glance
Roading is a significant essential service for Manawatu District Council. The transportation function represents around 18 % of Council’s overall annual operating expenditure, with capital works also making up a large proportion of the Council’s expenditure.
The land transport activity enabling this goal is achieved through:
A vehicular network, comprising a network of sealed and unsealed roads, parking areas and facility roads, bridges and large culverts.
A pedestrian network, comprising footpaths, bollards and chains.
Enabling infrastructure, comprising kerbs and channels, drainage sumps, culverts, road reserve including berms, and retaining walls.
Safety infrastructure, comprising street and amenity lighting, road marking and raised pavement markers, street signs, traffic controls, including Belisha Beacons, edge marker posts, pedestrian refuges, speed humps and traffic calming islands.
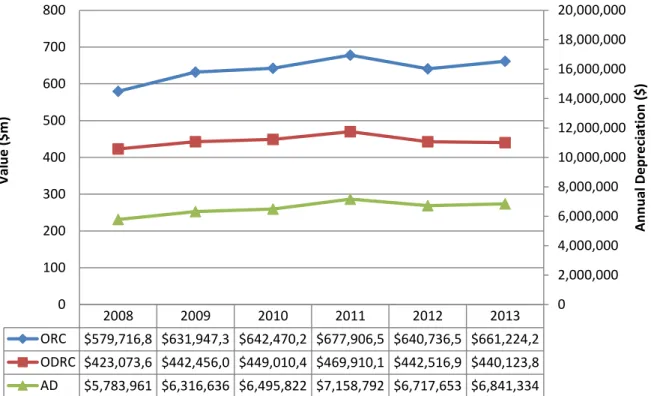
Council owns and is responsible for the management of these assets. The road asset groups included in this Asset Management Plan and their estimated current replacement values are summarised in Table 3. This shows that the cost of replacing the entire land transport network in today’s terms is around $661 million.
The proportion of asset types for the Roading assets is illustrated in Figure 4.
The State Highways that pass through the District are not owned or maintained by Council, but by NZTA. The rail network also falls outside of Council’s area of operations, and is currently owned and operated by On-track.
The following information provides an overview of the assets involved in the Manawatu District transportation activity. The information shown is collated here as a reference resource of the extent of the assets involved.
Table 1-1: Asset Summary
Figure 1-2: Replacement Cost by Asset Type
Asset Type Component Quantity
(No.) Length / Area Unit ORC Value $ ODRC Value $ Annual Depreciation $
Berm Berm 438432 m² 3,589,038 1,354,122 54,750 Structures Large Culvert 2349 m 8,178,229 2,485,571 85,655 Bridges 20284 m² 78,321,215 38,804,246 731,796 Retaining Wall 20502 m² 21,096,175 19,016,672 263,702 Vehicle Crossing Vehicle Crossing 4385 Each 5,948,077 3,099,245 79,495 Drainage Culvert 234963 m 40,422,659 15,934,460 501,435 Stormwater Channel 2403352 m 19,165,419 7,781,210 239,567 Footpath Footpath 228503 m² 16,040,849 9,105,365 247,386 Rural 2843 Ha 53,789,000 53,789,000 - Urban 307 Ha 45,114,527 45,114,527 - Shoulder Shoulder 3248848 m² 3,704,866 1,435,635 46,311 Traffic Services Marking 551228 m 182,815 168,050 2,952 Railing 9704 m 840,085 267,478 17,998 Sign 8028 Each 1,939,897 464,142 118,029 Streetlight (Bracket) 928 Each 289,229 126,431 5,783 Streetlight (Light) 1618 Each 454,430 237,645 9,091 Streetlight (Pole) 928 Each 2,800,096 1,381,876 40,003 Traffic Islands 11612 m² 2,486,725 435,177 31,084 Traffic Facility 6066 Each 160,327 10,688 10,688 Pavements Pavements 1364 km 356,700,560 239,112,267 4,355,608
Total 661,224,216 440,123,807 6,841,334
Berm 0.5% Large Culvert 1.2% Bridge 11.8% Vehicle Crossing 0.9% Drainage 6.1% Footpath 2.4% Traffic Island 0.4% Land Under Roads (rural) 8.1% Land Under Roads (urban) 6.8% Marking 0.0% Railing 0.1% Retaining Wall 3.2% Shoulder 0.6% Sign 0.3% Streetlight 0.5% SW Channel 2.9% Traffic Facility 0.0% Road Formation 28.3% Road Pavement 16.6% Road Surface 9.0%
1.8
Asset Management Objective
In order to fulfil Community Outcomes, Vision, Goals and Objectives, Manawatu District Council have adopted a systematic approach to the long term management of its assets by preparing this Asset Management Plan.
The key objective of AM is to provide a desired level of service in the most cost effective manner while demonstrating responsible stewardship for present and future customers. Asset Management Plans are a key component of the strategic planning and management of Council, with links to the LTP and service contracts.
The AMP underpins the Long Term Plan (LTP) and consultative processes that have been put in place to engage the community.
The AMP delivers a range of benefits to the community as well as to the provider of the services, the main ones being:
Maintain, replace and develop assets over the long term to meet required delivery standards and foreseeable future needs at minimal cost.
Continually improve asset management practices and service delivery to the customers.
Comply with Statutory Requirements.
1.9
Asset Management Level
1.9.1
Basic
The development of an AMP is a process of continuous improvement. The entry level is what is commonly referred to as the Basic AMP – it reflects a rudimentary knowledge of the asset (such as the basic asset register and inferred age, condition and performance), associated levels of service and the long-term cash flow predictions.
1.9.2
Intermediate
The Manawatu District Council’s first Roading Asset Management Plan (LTAMP) was produced in 1996 and reviewed in 2006, 2009 and 2012.
This plan aims to successfully migrate to an intermediate level of AMP. It consists of a mixture of “bottom up” analysis (for asset inventory, age, maintenance history faults etc.) as well as “top down” analysis (for condition and performance).
Having reached an intermediate level means there is still room for improvement and sophistication, and how that will be achieved is laid out in the Improvement Plan in Section 11 of this plan. The progression towards Advanced Plans will also periodically be measured/ reviewed/audited by external reviewers, and through revisions of this document.
1.9.3
Advanced
At the other end of the spectrum are Advanced AMPs. Movement towards the development of such plans is a continuous process of data collection, verification, higher confidence levels of outputs and a systematic iterative approach to treatment options (renewal and maintenance options), while steadily reducing the number of assumptions historicly used.
Advanced AMP’s aim to employ predictive modelling, risk management and optimised decision making (ODM) techniques, in order to evaluate options and to identify optimum Long Term Plans to deliver the levels of service agreed with the community to achieve outcomes.
As new condition, performance and risk assessment techniques and systems evolve, or as technologies associated with asset renewal are improved, the level of sophistication of the AMP will improve.
1.9.4
Purpose
The purpose of this plan is to improve the stewardship of assets by Council on behalf of its customers and stakeholders and achieve compliance with statutory obligations. This plan specifically does that by:
Demonstrating responsible stewardship of Roading assets;
Identifying minimum lifecycle (long term) costs to provide the agreed level of service;
Improving understanding of service level standards and options;
Assisting with an integrated approach to asset management throughout the organisation;
Improving customer satisfaction and organizational image;
Managing the risk of failure to deliver the required level of service;
Supporting long term financial planning of the Council;
Clearly justifying forward works programmes;
Improving decision-making based on costs and benefits of alternatives.
1.10
Audience
The intended audience for the Asset Management Plan are Council Representatives, Council Staff, Consultants, Developers and those who want to find out more about the processes that Council uses to maintain the agreed level of service.
1.11
Timeframes
This AMP covers a 10 year timeframe. Financial details are shown for the ten year budget from the current year (2014-2015) and forecasting for 2015-2016 through to 2024-2025. Actual expenditure will be from 2013-2014. The plan assumes that Roading assets as a whole will have an indefinite life
and the main focus of the plan is on determining the strategies required for maintaining, rehabilitating and renewing components over the next 10 years.
It is intended that this plan be reviewed every year with a major update every three years prior to the LTP review process.
1.12
Assumptions and Limitations
The following assumptions have been made for the growth projections:
URP is increasing. Manawatu is expecting minor increases in the usual resident population.
That a declining number of people per household and a modest growth in population is likely to result in an increasing numbers of households.
That the median age of Manawatu District residents will increase significantly over the long term leading to changes in the way Council delivers services
That forecast population, household and business growth can be catered for by current and planned activities
The key demand assumptions are:
Development will occur in accordance with the Growth Planning Assumptions prepared for
the 2015 AMPs and the Future Manawatu Long Term Plan 2015-2025. The key demand risk assumption is:
Growth does not occur in accordance with the documented Growth Planning Assumptions.
1.13
Structure
The content of the document is shown in the table below.
Section Content
Section 1 Introduction
Sets out the purpose of this Asset Management (AM) Plan, indicates the key stakeholders, describes the asset management progress over the recent years and shows the plan framework.
Relationships to other plans and strategies. Section 2
Strategic Environment
Describes how the MDC Vision Statements and policies apply to this AMP and how MDC interacts with stakeholders and other organisations.
Overview of how this plan will be used Section 3
Description of Assets Covers the rationale for ownership of the Roading assets and the description of assets covered under this plan. Also highlights the critical assets within the individual services.
Section Content
Section 4 Levels of Service
The Levels of Service for the Roading activities are defined and the performance measures by which the service levels will be assessed.
Section 5
Growth and Demand
Provides details of growth forecasts and demand drivers, which effect the management, and utilization of the Roading assets
Section 6 Environmental Management
Describes MDCs environmental obligations and how legislation is integrated to mitigate the adverse environmental effects associated with managing the transportation network.
Section 7 Lifecycle
Management Plan
Outlines what is planned to manage and operate the assets at the agreed levels of service while optimizing lifecycle costs.
Section 8
Financial Summary Long term financial forecast for implementing the Roading assets work programmes Section 9
Risk Management Details the Risk Management Processes utilized by MDC for assessing and managing risk within the Roading assets Section 10
Asset Management Practices
Outlines the information available on the assets, information systems used and process used to make decisions on how the asset will be managed. It also provides details on planning for monitoring the performance of the AMP
Section 11
Plan Implementation
This section details the improvements to Asset Management within Council that will lead to an increase in confidence in the management of the assets
2
Strategic Environment
2.1
Overview
2.1.1
Purpose
The Manawatu District Council aims to provide safe, convenient and orderly transportation in the District.
Council has statutory obligations under the Land Transport Management Act 2003 to maintain a Roading network within the District. An effective Roading network is also essential to ensuring economic and social wellbeing of the community through the provision of access and mobility for people, goods and services
In previous years the community outcomes were shaped by the community. However, amendments to the Local Government Act in 2010 changed the definition of community outcomes from outcomes belonging to and achieved by the community, to “outcomes that a local authority aims to achieve”. This is a significant change in emphasis from a community wish-list to a set of outcomes owned – and actively worked towards – by Council. Council believes it is also helpful for the public to understand what Council does and why, and for other stakeholders, including the private sector who both benefit from and contribute to Council activity.
2.1.2
Vision
In order to develop a set of outcomes that would take Manawatu into a successful future, Council in 2012 invested a significant amount of time to develop a Vision statement. This expression of the desired future state of Manawatu has been consulted on through the Long Term Plan.
Recognising the different character of its communities, Council has developed Vision statements for the District, its villages, rural community and Feilding urban township. The Vision statement both guides Council in its activity and provides a clear compelling picture of the future.
This New Vision Is:
Connected, vibrant and thriving Manawatu – the best rural lifestyle in New Zealand. Rural Area Vision Statement:
The food basket of New Zealand within a sustainable rural landscape that offers outstanding recreational opportunity.
Villages Vision Statement:
Attractive and prosperous communities that offer lifestyle choices and business opportunities within a unique environment.
Feilding Urban Vision Statement:
A thriving community enjoying the most vibrant country town in New Zealand, servicing the regional rural sector.
Outcomes and Levels of service are developed to reflect the expectations of the community and regulators. Targets are established which indicate the standard that should be met. Outcomes are relevant across the Roading activity while Levels of Service statements are more specific. The following diagram details the structure and linkage via legislative, strategies, sustainability and the community outcomes.
Figure 2-1: Outcomes and Levels of Service
2.1.3
Outcomes
A number of key concepts underpinned the Vision statements. These were grouped together and a number of themes emerged: the environment, economic sustainability, connectedness and organizational performance.
These were reviewed alongside the statutory Council requirements to provide for the social, environmental, economic and cultural wellbeings.
A set of outcomes was developed, which show the priorities council is working towards.
Manawatu District will improve the natural environment, stewarding the District in a practice aligned to the concept of kaitiakitanga
The Manawatu District will attract and retain residents
Manawatu District develops a broad economic base from its solid foundation in the primary sector
Manawatu and its people are connected via quality infrastructure and technology
Manawatu District Council is an agile and effective organisation
Manawatu District’s Roading network is important for meeting these outcomes. The network provides essential links around the District and to other areas, ensuring the efficient transportation of goods and services. These links also ensure the District’s communities are linked via high quality Roading.
The Roading network is an integral part of Manawatu’s built environment. Ongoing maintenance, inspections and audits ensure it remains safe for residents and businesses to use.
Council aims to provide safe, convenient and orderly transportation in the District.
Council has statutory obligations under the Land Transport Management Act 2003 to maintain a Roading network within the District. An effective Roading network is also essential to ensuring the economic and social wellbeing of the community through the provision of access and mobility for people, goods and services.
The following outcomes are particularly relevant to the Roading network:
Manawatu District develops a broad economic base from its solid foundation in the primary sector
Manawatu and its people are connected via quality infrastructure and technology
Manawatu’s built environment is safe, reliable and attractive
2.1.4
Customer Values
To enable specific linkage between the Outcomes and the Levels of Service, specific ‘fit for purpose’ outcomes have being developed. These are described as key customer values, as follows:
Accessibility – “How easily I can get to where I want to go”
Amenity – “My journey is a pleasant experience”
Resilience – “I can reach my destination regardless of weather or other incidents”
Safety – “I can get there safely”
Travel Time Reliability – “I know how long it will take”
2.2
Rationale for Involvement
Council regards the land transport activity, which enables communities to travel safely, easily and efficiently through the District while maintaining good access to properties, businesses and other areas of interest, as an essential service for the public good. Roading assets are critical infrastructure to growth of the economy and connectivity of diverse communities.
Council ownership and management of these assets is the most affordable means of achieving these activity outcomes. Council staff have the experience and skills to oversee the consulting and contracting service providers.
2.3
Significance Policy
The land transport network is significant as defined in council’s Significance Policy, due to its complexity, asset value and risk to the community. This service is expected to deliver this essential service in perpetuity and the asset is maintained and replaced as required to enable this. For significant services, the Office of the Auditor General defines a higher level of customer consultation. This includes evaluating level of service options, and undertaking consultation on level of service options with the community and other relevant stakeholders. Customer consultation is undertaken as detailed in Section 4 of this AMP.
2.4
Strategic Assets
The Local Government Act 2002 (Section 97) requires that the Significance Policy shall identify all of the assets the Council considers to be strategic, as defined in Section 5 of the Local Government Act 2002.
For the purpose of Section 90(2) of the Act, the Council has made the following determination for strategic transportation assets.
2.5
Stakeholders
Key stakeholders are those who have significant specific involvement with the assets and/or the service facilitated by the assets and describes their particular main interest and is limited to the main issues for the key stakeholder groups. In particular ‘Public Service providers’ include schools, military organisations, correction facilities, hospitals, and other government organisations. ‘Asset Managers’ are those District Council staff (engineers and others) whose responsibility it is to manage the services made possible by the assets covered in this AMP.
The key stakeholders and the outcomes that they require for the Roading activity are detailed in the table below.
Stakeholder Main Interests Engagement Range Engagement Methods
Accident Compensation Commission
Limited Correspondence
Audit NZ Transport Sector
groups Limited Correspondence
Automobile
Association Transport Sector groups Limited Department of
Conservation Enhance conservation values Limited Energy Conservation
Stakeholder Main Interests Engagement Range Engagement Methods
Federated Farmers Transport Sector
groups Limited Correspondence
Local Government
New Zealand Ensure that Local Government Act is complied with
Limited
Ministry of Education Safety for school
children Limited Correspondence
Ministry for the
Environment Limited
Ministry of Health Limited
Ministry of Transport Moderate
New Zealand Police Road Safety Partner Limited Ongoing liaison and appropriate formal contact where required
New Zealand
Transport Agency Legislative responsibilities as defined in Legislation, Funding Partner
Moderate Continual and frequent contact where required
Central Transport Federation/Heavy Haulage Association
Transport Sector
groups Limited Correspondence
OnTrack (NZ Railway
corporation) Transport system provider Limited Liaison with OnTrack on leveling crossing maintenance.
Telecom and other telecommunications companies
Utility operator Limited Liaison
The Forestry Owners
Association Transport Sector groups Limited Correspondence Neighbouring
Authorities with road connections
Palmerston North City Council Tararua District Council Rangitikei District Council Horowhenua District Council Neighbouring Road Controlling Authorities:
Palmerston North City and MDC are
connected with a number of boundary roads and share one bridge on Saddle Road, that straddles the boundary Tararua District and MDC share Saddle
Moderate Ongoing contact with relevant staff.
Formal liaison of elected representatives at CE levels. Palmerston North City Council
An formal agreement has been reached, for maintenance and
management of the boundary roads as follows:
East side Rangitikei Line – PNCC
Stakeholder Main Interests Engagement Range Engagement Methods
Road as a boundary road
Rangitikei District and MDC share a number of boundary bridges over the Rangitikei River
Horowhenua District and MDC share Himatangi Block Road as a boundary road
MDC
Saddle Road Bridge – PNCC Rangitikei District Council An formal agreement has been reached, for maintenance and
management of the boundary bridges as follows:
Ruahine Road Bridge Otara Road Bridge Mangarere Road Bridge Halcombe Road Bridge Neighbouring
Authorities with no road connections Ruapehu District Council Wanganui District Council Neighbouring Road Controlling Authorities
Limited Regular contact with relevant staff
Mid Central Health
Board Community Health Limited Correspondence
Horizons Regional
Council Resource use is sustainable as directed in the RMA 1991
Moderate
Horizons Regional Land Transport Committee
LTMA 2003 role Moderate Correspondence, Transport programme submission New Zealand
Transport Agency – highways division
The state highway division of the NZTA is the State Highway Authority. There are four State Highways in the District, SH1, SH3, SH54 and SH56.
Moderate Regular communication and correspondence where required.
Delegations – street lights, street sweeping on urban State Highway sections
PowerCo/Chorus Utility Operators Limited Correspondence
Stakeholders –
External and Local Stakeholders Main Interest Engagement Range Engagement Methods Manawatu District
Council customers and resident population
Reliable transportation services at an affordable cost
Broad
All commercial and private road users including:
Reliable
Stakeholder Main Interests Engagement Range Engagement Methods Cyclists Motorists Heavy-vehicle operators Equestrians
services at an affordable cost
Local
Businesses/Industries Reliable transportation services at an affordable cost
Moderate
Local Iwi Cultural and spiritual
values Limited Formal liaison of elected representatives at CE levels.
Schools Safety for school
children Limited Correspondence
Manawatu District
Council Maximise the purpose of local government through provision of the Roading activity
Broad
Asset Managers As above plus policy, planning and implementation of infrastructure and service management activities. Limited
Project Managers Responsible for implementation of infrastructure and service management activities
Moderate
Chief Financial Officer Accounting for assets and for services consumed by asset management activities
Moderate
Customer Services Systems which minimize and resolve complaints/enquiries about service
Limited
Elected Officials Owner of assets, responsible for sustainable service levels under the LGA 2000
Broad
Executive Management
Team/Group Managers Compliance with regulations, service reliability and quality
Stakeholder Main Interests Engagement Range Engagement Methods
Planners AMP support for
Long-term Plans.
Table 2-1: Key Stakeholders
2.6
External Organisations
2.6.1
Ministry of Transport
The Ministry of Transport is the government's principal transport adviser. The majority of their work is in providing policy advice and support to Ministers.
Through our advice we aim to:
Improve the overall performance of the transport system.
Improve the performance of transport crown entities.
Achieve better value for money for the government from its investment in the transport system.
The Ministry of Transport help the government give effect to its policy by supporting the development of legislation, regulations and rules. We also manage and account for funds invested in transport. The delivery of the transport functions is by the New Zealand Transport Agency.
2.6.2
New Zealand Transport Agency
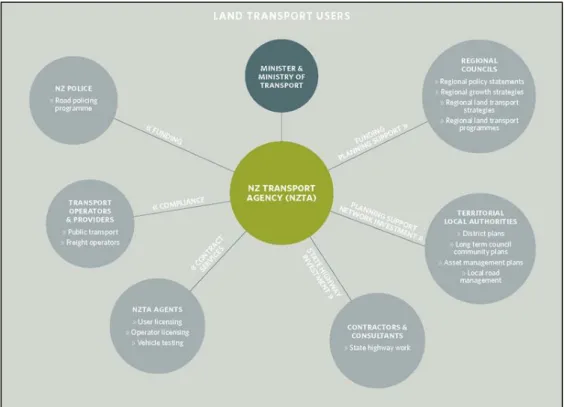
A new central government agency, the New Zealand Transport Agency (NZTA), was established on 18 July 2008. It incorporated Land Transport NZ and Transit NZ, along with other functions. NZTA is both a co-investor and manages the state highway operations.
The Council, together with other approved road controlling authorities, has a very important ongoing relationship with the NZTA, which is a funding partner to the majority of land transport activities across New Zealand. The NZTA ensures that equitable and nationally consistent Levels of Service are achieved over the network and this is funded in a long term sustainable manner. On average NZTA funds, through a subsidy, 50 % of the cost of the Roading Programme for all Road Controlling Authorities in New Zealand.
An example of the central function that New Zealand Transport Agency provides to Roading Activities is shown below.
Figure 2-2: NZTA Functions
2.6.3
Horizons Regional Council
Changes to the Land Transport Management Act 2003 have given a lead role to regional councils in regional transport planning and the Regional Land Transport Programme (RLTP) 2012-2015 contains all land transport activities of the District Councils in our Region (Wanganui, Manawatu, Rangitikei, Horowhenua, Ruapehu and Tararua) and Palmerston North City Council, the New Zealand Transport Agency (state highway division) and Horizons itself.
This sets out the transport activities the Region for the purposes of obtaining funding from Central Government.
The programme is made up of prioritized activities and encompasses:
Maintenance and operation of local roads and state highways;
Roading improvements (local roads and state highways);
Public transport services and infrastructure;
Road safety activities;
Walking and cycling facilities; and
Transport planning.
The Regional Council is also provides the natural resource management functions across the region. Horizons develops policies to guide the way we manage our Region’s environmental resources – land, air, water, and coast.
These policies set out the things that need to be done to achieve the environmental outcomes we want as a Region. We use both regulatory and non-regulatory methods to meet the objectives in our policies - regulatory management requires users of environmental resources to apply for resource consent; non-regulatory management involves providing advice, information, education, and funding assistance.
They also monitor the effectiveness of these methods and carry out research into existing and emerging environmental issues.
2.6.4
Road Controlling Authority
This term describes the Council, as an organization that manages and controls activities associated with roads. The term derives from the Land Transport Management Act 2003 and is used throughout the country, it includes District councils, the NZTA state highway division, and the Department of Conservation. The NZTA’s Planning, Programming and Funding Manual 2008, also uses another definition from the Land Transport Management Act 2003 that refers to such organisations are defined as “Approved Organisations”. These are defined by the Act as:
A regional council, a territorial authority, and approved public organisation.
The Manawatu District council is responsible for all roads in the District, but excludes the state highways, for which NZTA is responsible.
2.6.5
Neighbouring Councils
Manawatu District Council has Rangitikei District Council, Palmerston North City Council and Horowhenua District Councils as neighbouring Road Controlling Authorities. Agreements exist with these authorities which outlines who has specific responsibilities to maintain assets, on various boundary roads.
NZTA is responsible for the State Highways 1, 3, 54 and 56 that traverse through the Manawatu District. A Memorandum of Understanding exists with NZTA over responsibilities and obligations.
2.6.6
Land Transport Programme
This describes the general terms the Council’s programme of works for which it seeks NZTA subsidy through the National Land Transport Programme in accordance with NZTA’s Planning, Programming and Funding Manual 2008.
With the advent of the Land Transport Management Amendment act 2008, RCA’s prepare programmes that contribute to three yearly Regional Land Transport Programmes for approval and incorporation into a National Land Transport Programmes.
2.7
National Strategies and Plans
Central Government provide a high level of direction and regulation into the transportation sector through Strategies, Plans, Policy Statements and Legislation. A large proportion of these documents are delivered through the NZTA.
Regionally there is a suite of Plans and Strategies, many of which link with the Horizons Land Transport Strategy.
Manawatu District Council has developed a broad range of documents including strategies to define the broad scope and direction of its activities. Once adopted by Council, no process or action should be inconsistent with it.
The hierarchy and relationship between these strategies and other documents is illustrated in Figure 3-1. The themes reflect the elements the land transport is to contrite to (Land Transport Management Act 2003 s19B).
2.7.1
New Zealand Transport Strategy
The New Zealand Transport Strategy (NZTS) was first published in 2002, and updated in 2008. It provides the Government’s over-arching strategic vision for transport in 2040 as follows:
People and freight in New Zealand have access to an affordable, integrated, safe responsive and sustainable transport system.
It is supported by five principle transport objectives:
Ensuring environmental sustainability.
Assisting economic development.
Assisting safety and personal security.
Improving access and mobility.
Protecting and promoting public health.
To deliver the vision and targets of the Strategy, key components have been identified for government intervention and facilitation by regulation, enforcement, economic incentives, investment, and education as follows:
Integrated land use and transport planning.
Making best use of existing networks and infrastructure.
Investing in critical infrastructure and the transport sector.
Increasing the availability and use of public transport, cycling, walking and other shared and active modes.
This is the first time specific targets have been set for the whole transport sector. The NZTS and the first Government Policy Statement (GPS) on land transport funding are part of a raft of changes to the transport sector set out in the recently commenced Land Transport Management Amendment Act 2008 and are the driving force behind achieving an affordable, integrated, safe, responsive and sustainable transport system.
2.7.2
Government Policy Statement
This is a high level government statement on desired outcomes and funding priorities for transportation activities to achieve national and regional targets, for example to increase the use of walking and cycling and public transport.
The GPS (July 2011) states:
The government’s overarching goal for transport is: an effective, efficient, safe, secure, accessible and resilient transport system that supports the growth of our country’s economy in order to deliver greater prosperity, security and opportunities for all New Zealanders.
The government has three focus areas that are the priorities for this GPS:
Economic growth and productivity.
Value for money.
Road safety.
2.7.3
National Land Transport Programme
The National Land Transport programme (NLTP) contains all the land transport activities, such as public transport services and road construction and maintenance, which are expected to receive funding from NZTA.
The NLTP is compiled from the proposed Regional Land Transport Programmes in accordance with available funding.
2.7.4
National Infrastructure Plan
1The National Infrastructure Plan (NIP) details the Government’s view of the challenges and priorities for infrastructure. The 2011 NIP describes the view to 2030.
A Vision for New Zealand’s Infrastructure in the NIP is:
New Zealand’s infrastructure is resilient and coordinated and contributes to economic growth and increased quality of life.
More specifically the vision for the Transport Sector is:
A transport sector that supports economic growth by achieving efficient and safe movement of freight and people.
The National Infrastructure Plan sets out seven specific goals for transport infrastructure, all of which have relevance for the National Land Transport Fund investment in land transport.
These goals are to achieve:
A long term strategic approach to transport planning which maximises the potential synergies between regional planning and central government strategies.
A flexible and resilient transport system that offers greater accessibility and can respond to changing patterns in demand by maintaining and developing the capacity of the network.
Improved operational management practice and the use of demand management tools especially in urban areas experiencing significant growth.
A network of priority roads that will improve journey time and reliability, and ease severe congestion, boosting the growth potential of key economic areas and improving transport efficiency, road safety and access to markets.
A continued reduction in deaths and serious injuries that occur on the network.
A public transport system that is robust and effective and offers a range of user options that will attract a greater percentage of long term users.
A rail system that enables the efficient movement of freight and complements other modes of passenger transport and freight movement.
Sea and air ports that are linked to the overall transport network to support efficient nationwide movement of passengers, domestic goods and exports and imports and are able to respond to technological changes and changing international safety and security
standards.
The National Infrastructure Plan defines what success will look like as:
The transport sector is well served by a range of indicators. However, at a national level, the following indicators are most relevant to the critical issues identified in this Plan:
Reduced incidents of severe urban congestion.
More efficient freight supply chains.
A reduction in deaths and serious injuries.
Better use of existing transport capacity.
Resilient and secure transport network.
More transport mode choices.
2.7.5
Safer Journeys
2Safer Journeys is a strategy to guide improvements in road safety over the period 2010–2020. The long-term goal for road safety in New Zealand is set out in its vision:
A safe road system increasingly free of death and serious injury.
To support the vision, Safer Journeys takes a Safe System approach to road safety. This approach means working across all elements of the road system (roads, speeds, vehicles and road use) and
recognises that everybody has responsibility for road safety. We have also identified the issues that are of most concern.
These are the priorities for road safety in New Zealand.
Safer Journeys describes the actions we will take to address these issues, using a Safe System approach that works across all elements of the road system.
2.7.6
Connecting New Zealand
32.7.6.1
Purpose
The purpose of Connecting New Zealand is to summarise for stakeholders the government’s broad policy direction for the transport sector over the next decade. It will assist stakeholders to better understand how the government sees the transport system developing over that period.
Connecting New Zealand draws together the policy direction set out in a number of other guidance documents, including the National Infrastructure Plan and the Government Policy Statement on Land.
2.7.6.2
Key Areas
To deliver on its transport objective, the government is focusing on three key areas.
1. Economic growth and productivity — transport has an important role to play in enabling the government’s overall goal to grow the New Zealand economy to deliver greater
prosperity, security and opportunities for all New Zealanders. The transport system provides connections — both domestically and internationally — for our communities and businesses, and meets the travel needs of our international tourists.
2. Value for money — improving the performance of the transport system is critical. The government needs to be confident that the transport sector (central and local government in particular) is delivering the right infrastructure and services to the right level, and for the best possible price.
3. Road safety — implementing the Safer Journeys road safety strategy and its new Safe System approach, so we have a sustained reduction in deaths and serious injuries on our roads over time.
2.7.7
Safer Journeys
2.7.7.1
High-Risk Rural Roads Guide
4The High-Risk Rural Roads Guide (HRRRG) has been prepared by the NZTA to provide guidance on the government’s Safer Journeys 2020 Strategy initiative to focus efforts on high-risk rural roads. The objective of the guide is to provide practitioners with best practice guidance to identify, target and address key road safety issues on high-risk rural roads. The guide provides links to a number of road safety resources and guidance for planning, funding and evaluating safety projects and programmes.
The guide focuses on the Safer Journeys actions. However, roads that have crash problems but do not meet the criteria for a high-risk rural road may still warrant investigation and the use of suggested countermeasures but may not be prioritised in terms of funding.
To be classified as a high-risk rural road, the road will need a history of three or more fatal and serious crashes within five years, or five or more within 10 years. An equivalent number of potential crashes can also be used. Potential crashes are estimated using a risk assessment procedure such as the KiwiRAP analysis tool or RISA for local roads. The minimum crash criteria will exclude sections of road with only one or two maybe random crashes from being classed as high risk.
The NZTA Investment and Revenue Strategy (IRS) now recognises ‘high risk rural roads’ as a high priority for funding. The IRS ‘high strategic fit’ assessment now includes “potential to significantly reduce the number of crashes involving death and serious injuries in line with Safer Journeys on a high risk rural road”. However, for a ‘high strategic fit’ the IRS requires us to address high risk roads identified from actual crash records only. A potential crash rate, based on risk assessment only, will be assigned a ‘medium strategic fit’.
2.7.7.2
High-risk Intersection Guide
In 2010 the government released the road safety strategy Safer Journeys, which highlights the need for a stronger focus on high-risk intersections. The 2013-2015 safer journeys action plan states: We will use the High-risk intersection guide to identify and target the 100 highest-risk intersections to address by 2020. A programme will be developed to improve at least 20 intersections in the course of this plan. Improving urban intersections will benefit pedestrians and cyclists. Planning will also commence for accelerated improvements during the 2015–2018 National Land Transport Programme, using the Safe System interventions from the guide.
The guide has been developed to assist road controlling authorities (RCAs) in targeting intersection safety improvements to the highest risk intersections, and providing a nationally consistent application of proven countermeasures.
RCAs can use the guide to identify their high-risk intersections and then to prioritise them by examining the crash histories and site characteristics to identify risk factors for which there are effective countermeasures. The results may be useful when developing the safety activities in the National Land Transport Programme.
4 Source: HRRRG (NZTA 2011).
2.7.7.3
KiwiRAP
KiwiRAP provides a systematic and internationally recognised way of measuring what constitutes a safe road. By giving New Zealand’s roads a safety rating, KiwiRAP will be able to communicate the risk of death and injury more meaningfully. It will help drivers understand how risk can vary according to changes in the road environment. A risk-aware driver will be more likely to adapt their driving to reduce their risk of being involved in a crash.
Please Note: Currently KiwiRAP assessments apply only to State Highways.
2.7.8
Other References
The following documents influence management of the Transport activity:
NZTA’s Our Strategic Direction 2013-2016 – reinforce the priorities around supporting economic development.
The NZTA Rules, Policies and Guidelines (including published manuals) – provide guidance to programming planning and funding.
2.7.9
Legislation
2.7.9.1
Key Legislation
Legislation is established by Central Government and must be complied with at Local Government Level. Significant legislation and regulations affecting the Roading activities are provided in the table below.
Different legislation has differing levels of impact on the Roading activity; this is indicated under Impact Range (Broad ***, Moderate **, Limited *).
Legislation and Regulation Roading Impacted Range
Building Act 2004 *
Civil Defence Emergency Management Act 2002 **
Climate Change (Emissions Trading and Renewable
Preference) Act 2008 *
Climate Change Response Act 2002 (and amendments) *
Electricity Act 1992. *
Health and Safety in Employment Act 1992 ***
Land Drainage Act 1908 *
Land Transport Management Act 2003 ***
5 Source: KiwiRAP
Legislation and Regulation Roading Impacted Range
Land Transport Act 1989 **
Local Government Act 2002 ***
Local Government Rating Act 2002 *
Local Government Rating Act 1974 **
Public Works Act 1981 (and amendments) *
Railway and Corridor Management and Safety Act 1992 *
Reserves Act 1977 (and amendments) *
Resource Management Act 1991 (and amendments) **
Summary Offences Act 1991 *
Telecommunications Act 1987 *
Transit New Zealand Act 1989 *
Utilities Access Act 2010 ***
Table 2-2: Key Legislation
2.7.9.2
Civil Defence Emergency Management Act 2002
The expectations under the CDEM Act 2002 is that Council’s services will function at the fullest possible extent during and after an emergency, even though this may be at a reduced level. In addition, Council has established planning and operational relationships with regional CDEM groups to deliver emergency management within our boundaries.
Roading is regarded as a critical service and is given special consideration within Council emergency management procedures. Every effort will be given to restore services immediately after an event to at least provide limited access.
2.7.9.3
Health and Safety in Employment Act 1992
6The Health and Safety in Employment Act's object is to promote the prevention of harm to all persons at work and other persons in, or in the vicinity of, a place of work.
Section 5 of the Act sets out the object, and lists various means contained in the Act to achieve it, including by:
Promoting excellence in health and safety management, in particular through being systematic.
6 Source: www.osh.dol.govt.nz
Defining hazards and harm in a comprehensive way so that all hazards and harm are covered, including harm caused by work-related stress and hazardous behaviour caused by certain temporary conditions.
Imposing duties to ensure that people are not harmed as a result of work activities.
Setting requirements that relate to the taking of all practicable steps to ensure health and safety, and are flexible to cover different circumstances.
Encouraging the health and safety of volunteers.
Requiring employee participation in the improvement of health and safety and encouraging good faith co-operation in places of work.
Providing a range of enforcement methods in response to failure to comply with the Act. The Act imposes duties on a wide range of working relationships in nearly all places of work. This guide describes duties as set out in the Act and affecting different parties in the workplace:
Employers.
Persons who control places of work.
Persons who sell or supply plant for use in places of work.
Self-employed people.
Principals to contracts.
Employees.
Volunteers.
People receiving on the job training or gaining work experience.
2.7.9.4
Land Transport Management Act 2003
The Land Transport Management Act contains particular requirements for content, development of and consultation on the District’s Land Transport Programme prior to its adoption by the Council. The original Act was amended in 2008 by the Land Transport Management Amendment Act, which introduced the requirement for a Regional Transport Committee (RTC) to develop a three year Regional Land Transport Programme (RLTP). The Horizons Regional Council is responsible for preparing the Manawatu-Wanganui programme.
The programme is required to detail at least the first three financial years’ activities, relating to road maintenance, renewals, improvements and public transport services, identified by approved organisations (road controlling authorities) in the region. The regional programme is then submitted to the NZTA for incorporation into the National Land Transport Programme; 10-year forecasts are also required.
Under the 2003 version of the Act road controlling authorities were only required to develop detailed individual annual Land Transport Programmes for the submission to NZTA.
The new requirements are covered in Section 12 of the Act as follows: Section 12 - Overview of Regional Land Transport Programmes
(1) A regional land transport programme allows approved organisations and the Agency to recommend funding for land transport activities or combinations of activities from the national land transport fund that will contribute to—
(a) a region’s outcomes that are identified in the relevant regional land transport strategy; and
(b) any outcomes, objectives and impacts identified by the Crown in any national land transport strategy or the relevant GPS.
(2) Regional land transport programmes, which are prepared by regional transport committees (or, in the case of the Auckland region, ARTA), include—
(a) proposed activities and combinations of activities for 3 financial years; and (b) an indication of significant activities for the following 3 financial years; and (c) a 10-year financial forecast.
(3) This section is intended by way of explanation only, and if this section is inconsistent with another provision of this Act or any other Act, then the other provision prevails. Under the Act, the RTC is responsible for assessing and prioritising proposed transportation activities across the region in relation to both national and regional outcomes and funding priorities. These include, in relation to Manawatu District:
Government Policy Statement (GPS).
Regional Transport Strategies.
2.7.9.5
Local Government Act 2002
Significant requirements affecting this Asset Management Plan are:
Part 6 – Planning, Decision-Making, and Accountability.
The consultation and community outcomes sections of this part are particularly relevant. Appendix T to this plan contains fuller details on consultation. The community outcomes requirements for this Asset Management Plan are met through the Council’s Long Term Plan process.
Part 7 – Specific Obligations and Restrictions On Local Authorities and Other Persons.
Schedule 10 – Council Plans and Reports.
The requirement to consider all options and to assess the benefits and costs of each option (see Appendix ‘F’).