Task Scheduling in Distributed Systems
by Work Stealing and Mugging
— A Simulation Study
Nenad Jovanovi´c
Department of Applied Mathematics and Statistics, State University of New York, Stony Brook, USA
We model and simulate the execution of parallel jobs represented by directed acyclic graphs on a system of networked distributed heterogeneous computers. We tested two online schedulers, the Enhanced Cilk Sched-uler (ECS) and the Central Manager (CM). ECS is a
decentralized scheduler, which implements work stealing and processor mugging techniques. CMis a centralized greedy scheduler. Our simulation results show that
ECS is a well behaved scheduler particularly suited for scheduling task execution in dynamically changing systems because it is robust, requires little communica-tion, and almost matches the performance of the CM
scheduler.
Keywords: distributed systems, parallel computing, scheduling, simulation.
1. Introduction
One of the basic problems in parallel comput-ing is how to execute a parallel program on a collection ofheterogeneousprocessors, that is, processors of different and possibly changing speeds. In this paper we simulate scheduling algorithms that are designed to run efficiently in heterogeneous parallel computing environ-ments.
We model and simulate the execution of paral-lel jobs represented by directed acyclic graphs
(DAG). Each job is a multi-threaded parallel
program. A thread is a chain of tasks ordered by their execution dependencies. Dependencies of the tasks/threads in a job are represented by a
DAG. The nodes in a DAG correspond to tasks and directed edges represent precedence rela-tionship among tasks.
We study two online schedulers — the En-hanced Cilk Scheduler (ECS) and the Central
Manager (CM). Work stealing 6, 7] and
pro-cessor muggingtechniques are central to ECS making a low-overhead, non-centralized, and fault-tolerant scheduler with provable 5]
per-formance guarantees. A centralized omnipotent greedy scheduler, we callCentral Manager, is the benchmark we use to assess theECS perfor-mance.
Applications of decentralized adaptive online scheduling algorithms include web-based com-puting, utilizing idle processors within organi-zations, scientific computing, military applica-tions, etc. Related work is found in the area of asynchronous parallel computing1, 3, 4, 2, 9]
as well as in scheduling theory8].
In our simulation, ECS runs efficiently even when processors have different and dynamically changing speeds. ECS is robust, it is scalable because it is distributed, and it is a fault tolerant scheduler. The quality of schedules exhibited by ECS is almost as good as that of centrally managed ones.
2. Experimental Study
We study a scheduling problem in a networked system of heterogeneous processors. Each pro-cessor is described by its set of attributes: maxi-mum speed, current speed, and steal-mug inter-val(the time between attempts by the processor
to steal/mug work from other processors). Our
Our study compares two types of schedulers on a network of heterogeneous processors, that is, processors of different (fixed or changing)
speeds. The Enhanced Cilk Scheduler (ECS)
(see Fig. 1), is based on a non-centrally
man-aged randomized model that employs steals and muggings. The centrally managed scheduler, or Central Manager (CM) uses a simple greedy
heuristic to assign subtasks to processors, but relies on tightly coupled centralized control.
ENHANCED CILK SCHEDULER
1. Processorichooses a victim processorjuniformly at random.
2. If the victim j’s double ended queue(deque) is not
empty, it steals the threadTfrom thetopof the deque. 3. If the victim j’s deque is empty, but the victim is
working on a threadTandit is slower than processor i, theni mugs j, that is,iinterruptsjand takes the thread
T.
4. If processorihas located a threadT,iworks onTuntil one of four situations:
a) Thread T spawns k new threads. In this case,
the processor putsTand, one by one,k;1 new
threads in order of appearance, on thebottomof the ready deque and starts work on thelastspawned new thread.
b) The threadTreturns or terminates. If the deque
is not empty, the processor begins working on the
bottomthread. If the deque is empty, the processor attempts to work steal.
c) The thread reaches a synchronization point. In this
case, the processor attempts to work steal. (Note
that the deque is empty.)
d) Processoriis mugged and the threadTis migrated
to another processor. In this case, processor i
attempts to work steal.
5. Otherwise, there is a failed steal attempt; processori
tries to steal again.
Fig. 1.The Enhanced Cilk Scheduler.
TheECSattempts to complete tasks in the net-work as quickly as possible by usingwork steal-ingor processor mugging. Work stealing hap-pens when an idle processor takes a ready task from a busy processor’s queue and begins exe-cuting it. An idle processor Pf performs
pro-cessor mugging when it encounters a slower processor Ps executing a taskT and the queue
ofPsis empty. In that case,Pf takes over the
ex-ecution of taskTand processorPsbecomes idle
and starts looking for work. In ECS, the “vic-tim” processor is chosen at random, uniformly among all other processors in the system. At-tempts to steal/mug occur at regular intervals
(specified by the steal/mug interval), whose
lengths are inversely proportional to the speed of the processor exercising the stealing/mugging.
The CM scheduler applies a greedy strategy. It keeps a FIFO queue of the ready-to-process threads and assigns a thread to the currently fastest idle processor. When some processorPi
becomes idle and the queue is empty, the CM scheduler possibly assigns a task to it: if the slowest active processor Ps is slower than Pi,
then the CM reassigns the work on the active processor to Pi, effectively “mugging” Ps by
central authority.
Both the ECS and CM use preemption: each task can be preempted, or interrupted and con-tinued on some faster processor. (This means
that we are assuming checkpointing or other support in order to enable essentially continu-ous preemption and restart.)
In both models, the experimental results re-ported here have the migration cost set to zero
(i.e., there is no calculated delay in migrating
a task, whether by stealing, mugging, or as-signment by the central manager). Instead, we
calculate these communication costs separately because different platforms have different com-munication costs.
Our simulation program is written in Simscript II.5. Processor features, system utilization, network topology, and characteristics of jobs
(DAGs)are part of the input. Experiments were
conducted on a Sun Ultra 30 with 512 MB mem-ory, running Solaris 2.6. Comparison of CM vs. ECS in several contexts is performed with promising results.
2.1. Experiment 1
In this experiment, the input DAG consists of a “fan out” (from a single node to 50 nodes)
followed by a “fan in”(back to a single node).
All tasks are uniform in this case: each of the nodes in the middle of the DAG correspond to tasks requiring 50000 work units. This exper-iment is meant to model the case in which the job is readily parallelized into equal-sized sub-tasks, which are readily combined into the final output.(Note that in the traditional Cilk
imple-mentation7], each thread can fork into only two
8 networked processors. The processors have various speeds: one works at 100 work units per unit time(ms), one at 200, one at 300, two
at 400, two at 800, and one at 1600 work units per unit time. Communication cost is zero along edges of the network, since we count migrations separately.
Time interval I0 denotes initial steal/mug
in-terval, that is approximately proportional to the reciprocal of the processor speed. Specifically, the interval is 1 ms for the processor of speed 100, 0:7 for the processor of speed 200, 0:5 for
the processor of speed 300, 0:3 for the
pro-cessors of speed 400, 0:1 for the processors
of speed 800, and 0:05 for the processor of
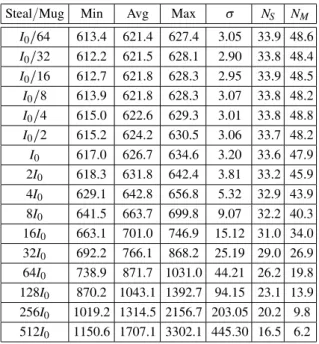
speed 1600. In(Tables 1–2), we show the data
for values of steal/mug interval ranging from
I0=64 up to 512I0. This broad range allows us
to see how the speed approaches an asymptote as the steal/mug interval approaches zero and
how the performance deteriorates as this inter-val increases. For each steal/mug interval, we
ran the simulation 500 times, for every run the processor initiating DAG execution is selected uniformly at random. We tabulated minimum, average, maximum, standard deviation for the completion time and average numbers of suc-cessful steals and muggings over the 500 runs. Two main lower bounds on the time required to complete a DAG in this setting are total work of
Steal/Mug Min Avg Max σ NS NM
I0=64 613.4 621.4 627.4 3.05 33.9 48.6
I0=32 612.2 621.5 628.1 2.90 33.8 48.4
I0=16 612.7 621.8 628.3 2.95 33.9 48.5
I0=8 613.9 621.8 628.3 3.07 33.8 48.2
I0=4 615.0 622.6 629.3 3.01 33.8 48.8
I0=2 615.2 624.2 630.5 3.06 33.7 48.2
I0 617.0 626.7 634.6 3.20 33.6 47.9
2I0 618.3 631.8 642.4 3.81 33.2 45.9 4I0 629.1 642.8 656.8 5.32 32.9 43.9
8I0 641.5 663.7 699.8 9.07 32.2 40.3
16I0 663.1 701.0 746.9 15.12 31.0 34.0
32I0 692.2 766.1 868.2 25.19 29.0 26.9 64I0 738.9 871.7 1031.0 44.21 26.2 19.8
128I0 870.2 1043.1 1392.7 94.15 23.1 13.9
256I0 1019.2 1314.5 2156.7 203.05 20.2 9.8
512I0 1150.6 1707.1 3302.1 445.30 16.5 6.2
Table 1.Simulation data for Experiment 1, using Enhanced Cilk Scheduler(ECS).
DAG divided by sum of processor speeds, and critical path divided by the speed of the fastest processor. However for this special case there is a better lower bound, obtained as follows. First, the sum of the speeds of the 8 processors is 4600 work units per unit time. The best we can hope to do is to process the first task (node) with
the fastest processor in time 50 000=1600, then
the 50 middle tasks in time 50 50 000=4600,
then the final task(after fan-in)with the fastest
processor in time 50 000=1600. This gives a
lower bound of 605.98 time units to complete the DAG. In comparing with this lower bound, we see that the ECS method, using the most frequent steal/mug attempts(I0=64), performs
within 2.5% of lower bound, on average, with the maximum completion time among the 500 runs only 3.5% worse than lower bound for this experiment.
Steal/Mug Min Avg Max σ NS NM
N/A 623.1 623.1 623.1 .00 41.1 6.6
Table 2.Simulation data for Experiment 1, using the central manager scheduler(CM).
The average performance of ECS degrades as the steal/mug intervals increase asymptotically
reaching times when there are no steals and muggings. Still, for steal/mug intervals of 16I0,
on averageECSis lagging 15% behind the lower bound for the configuration, executing 31 steals and 34 muggings on average, compared to aver-age of 34 steals and 49 muggings when attempts are most frequent(I0=64).
The average number of steals decreases with the steal/mug interval. Muggings decrease more
steeply. This behavior is expected, since once the first task is over, 50 tasks are released and put in the queue of the processor that just completed the first task. A smaller number of attempts re-sults in a smaller number of successful steals or muggings.
The completion times and their volatility for the given configuration are increasing with the de-creasing rate of steal/mug attempts. Because
of infrequent steal/mug attempts and random
2.2. Experiment 2
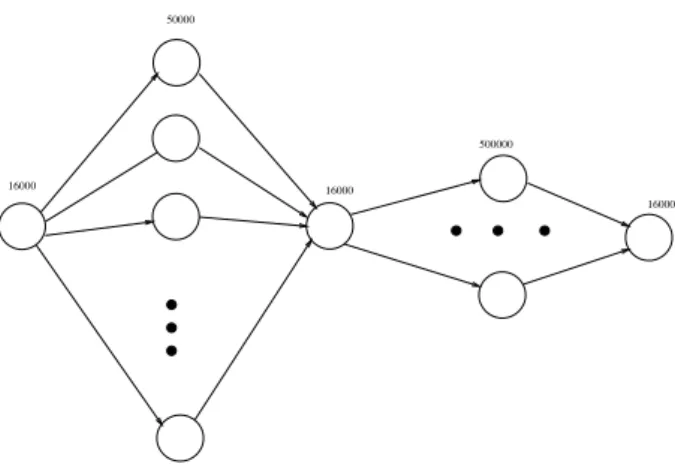
In this experiment, the input task DAG(Fig. 2)
consists of a task of size 16 000, which fans out to 50 parallel tasks, each of size 50 000, then fans in to a task of size 16 000, then fans out to 6 parallel tasks of size 500 000 each, then finally fans in to a task of size 16 000. This experiment is meant to model the case in which the job is initially parallelized into many equal-sized subtasks, which are then combined and a small number of follow-up tasks are run in parallel. This DAG models some practical image-object recognition applications, as the large fan-out is done in the raw image processing, while the longer, narrower part of the DAG models the more time-consuming, less number-crunching tasks of feature matching and object recogni-tion. This experiment uses a network of 12 pro-cessors. The processors have various speeds: one works at 100 work units per unit time(ms),
one at 200, one at 300, three at 400, three at 800, and three at 1600 work units per unit time. For each processor, the product of speed and time interval I0 is 80 work units. Each batch
of 500 runs increases steal-mug interval 20% in respect to the previous batch. Each run starts on a randomly selected processor. Task migrations are counted separately.
16000 16000
16000 500000
50000
Fig. 2.The DAG for Experiment 2.
We can compute readily a lower bound on the processing time of the DAG, by keeping the maximum possible number of fastest proces-sors busy all the time in each phase (e.g., in
the second parallel phase of the DAG we have 6 tasks so only 6 fastest processors can be em-ployed simultaneously). The resulting bound is
724.44 time units.
Steal/Mug Min Avg Max σ NS NM
I0 788.70 796.38 804.01 2.75 46.9 74.2
(1:2)I0 789.36 797.50 805.29 2.86 46.9 73.8 (1:2)
2I
0 790.54 798.64 808.10 3.04 46.8 72.9
(1:2)
3I
0 792.20 800.17 808.72 2.92 46.7 72.3
(1:2)
4I
0 792.33 801.72 809.13 3.10 46.5 71.1
(1:2)
5I
0 792.34 803.61 820.46 3.48 46.4 70.0
(1:2)
6I
0 796.39 806.52 820.25 3.67 46.3 69.7
(1:2)
7I
0 798.90 809.75 821.28 4.26 46.1 68.0
(1:2)
8I
0 800.96 812.75 825.12 4.39 46.1 66.7
(1:2)
9I
0 804.80 817.58 840.77 5.21 46.0 65.4
Table 3.Simulation data for Experiment 2, using the enhanced Cilk scheduler(ECS).
Steal/Mug Min Avg Max σ NS NM
N/A 795.62 795.62 795.62 0. 59.3 10.6
Table 4.Simulation data for Experiment 2, using the central manager scheduler(CM).
Refer to (Tables 3–4). On average, ECS run
with the most frequent steal/mug attempts is
10% above the lower bound. This lag is mostly due to “persistence” of fast processors; i.e., once they grab a task, it will be processed completely. For experiment, 2 processors, with the first be-ing twice as fast as the second one, work on 2 equally long tasks. It would be efficient to swap tasks at halftime of the optimal run. That way, both would be active from the beginning to the end. Instead, the faster processor finishes his task first and then takes over the other, leaving the slower processor idle.
2.3. Experiment 3
This experiment runs simulations of the ECS system withchangingspeeds of processors. In the following set of simulations, we testedECS method robustness to processors’ speed change, as may be expected to occur in real systems. Processors change speed in a stepwise manner
(an alternating renewal process); i.e. they start
speed drops down to a level randomly chosen from a uniform distribution between two input parameters: minimum and maximum percent-age of full speed. After the exponential random time of a processor working at full speed, the speed changing pattern is repeated. We exe-cuted five simulations and compared average completion times with the system in which pro-cessors work full speed all the time. Each sim-ulation is executed for 100 DAGs of “graphic” and “fan-out-fan-in” type. This experiment em-ploys a network of 12 processors. The proces-sors have various speeds: one works at 100 work units per unit time(ms), one at 200, one at
300, two at 400, four at 800, and three at 1600 work units per unit time. For each processor, the product of speed and steal/mug interval is
80 work units. Communication cost for task migration is zero along the edges of the net-work. For each simulation run, the duration of both full speed periods and reduced speed pe-riods are randomly chosen from an exponential distribution with the mean of 50 time units.
DAG 100 80-100 60-80 50-70 40-60 10-50
Graphic 785 825 917 939 1018 1097
Fan-out. 346 361 397 407 441 493
Table 5.Average execution times when processors exhibit speed change.
Refer to Table 5. The top row denotes speed range during the slowdown phase as the per-centage of full speed. The first data column is the benchmark – when speeds do not change. In the first run, speeds are only reduced to between 80 and 100%. Consecutive simulations are re-ducing processor speeds to 60-80%, 50-70%, 40-60%, and finally to 10-50%. As the overall system computing power decreases, the com-pletion times are decreasing linearly. Thus,ECS performance degrades gracefully with changes of processor speeds.
2.4. Experiment 4
In this experiment, we simulate a networked system of 100 processors. Their speeds range
from 1600 down to 100(17 processors of speed
1600, 29 of speed 800, 25 of speed 400, 12 of speed 300, 8 of speed 200 and 9 of speed 100).
Two types of DAGs, “graphic” and “fan-out-fan-in” with uniformly-sized tasks(as described
in Experiments 1 and 2), arrive into a system
ac-cording to a Poisson process with some mean DAG inter-arrival time. At the arrival time, the type of DAG is randomly determined, according to a discrete uniform distribution. The simula-tion is continuous, and statistics are collected after each consecutive 1000 DAG completions. Both systems are simulated on an identical DAG arrival timeline; thus, we can directly compare the quality of scheduling schemes. Again, we simulateECSandCMsystems behavior. In the ECSsystem, processors attempt to steal/mug at
theI0level as described in Experiment 2.
The ECS scheme is implemented here by two queues on each processor. A ready queue is maintaining tasks of a DAG in process and a waiting queueis keeping newly arriving DAGs in FIFO order. When a DAG appears on a cessor, it is processed immediately if the pro-cessor is idle. If the propro-cessor is busy, the initial task of the DAG is placed in the waiting queue. When a processor is finished with a task, succes-sor tasks from the DAG are released and placed in the ready queue and the processor contin-ues with the tasks from the bottom of the ready queue. If the ready queue is empty, the proces-sor takes on the task from the top of the waiting queue. If both queues are empty, the processor attempts to steal/mug. The steal/mug
proce-dure is as follows: the victim’s ready queue is checked first and if not empty the task from the top is stolen. If the ready queue is empty, the waiting queue is checked and the task from the top, if any, is stolen. If both queues are empty, we have a mug attempt.
The mean DAG inter-arrival time is 300 time units. The system utilization1 is low, slightly
above 0.2(0.2047); thus, completion times
dis-tribution is positively skewed, i.e. more than 50% of DAGs are completed in time less than average. Longer completion times are due to peaks in DAG arrivals. Again,CM model per-forms slightly better on average but it is not penalized for polling the status of each proces-sor in the system that usually requires enormous
1 Thesystem utilizationis defined to be the ratio of the time integral of the active processing power to the time integral of the
amount of network traffic. ECS steal/mug
at-tempts are one-on-one, requiring far less polling network traffic. On the other hand, task migra-tions from processor to processor are almost 50% more frequent inECSthan they are inCM system. This will lead to network traffic de-lays of DAG completion times(we don’t incur
migration costs in this experiment.) The lower
bound on processing time of graphic DAG is 390.58 and our statistical analysis shows that 95% of the time that kind of DAG will be pro-cessed in time less than 534.03 time units; a result is only 37% worse than the lower bound. Half of the times that type of DAG will be pro-cessed in time less than 421.85 time units, only 8% slower than lower bound.
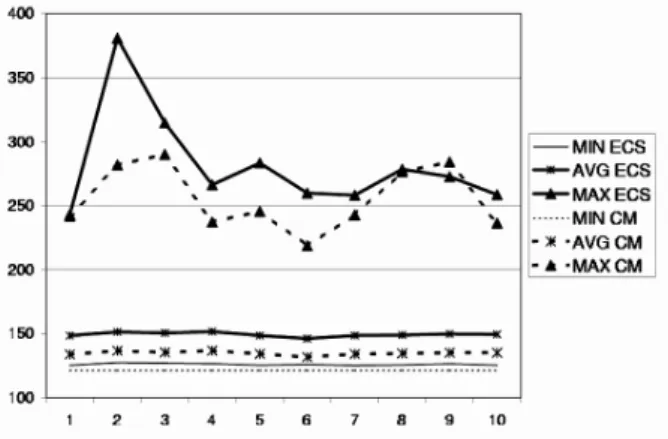
Refer to Fig. 3. CM performs slightly better than ECSon the “fan-out-fan-in” DAG, as ex-pected, but the lag is small. The system is
Fig. 3.The minimum, average, and maximum completion times of 10 batches of 1000 “fan-out-fan-in”
DAG completions inECSandCMscheme with system utilization of 0.2.
Fig. 4.The minimum, average, and maximum completion times of 10 batches of 1000 “graphic” DAG
completions inECSandCMscheme with system utilization of 0.6.
lightly loaded and DAGs are with high prob-ability completed at most 50% beyond lower bound. The vertical axis measures time units; the horizontal axis refers to the actual runs(with
marks per 1000 runs).
In Fig. 4, completion times with “graphic” DAGs batches of size 1000 are given. DAGs enter the system according to a Poisson process, with ex-ponential inter-arrival time distribution having a mean of 100 time units. System utilization is thus increased to about 0.6 and completion times are more volatile. CM scheduler is still better thanECSon average, but it exhibits larger spreads between minimum and maximum times and maximum completion times are larger in CMthan inECS.
3. Conclusions
Based on our simulation results it can be stated thatECSis a viable well behaved scheduler in distributed heterogeneous environment. Even thoughCMwas equipped with much higher de-gree of knowledge of overall system state, the results show that on average ECS is not that much slower and measured by QoS measure it performs even better. Another huge benefit of the ECS is its decentralized nature and adapt-ability versusCM’s centralized control. Once control unit fails or becomes unusable the whole system is rendered unusable as well (unless
there is some mechanism of control component back up). On the other hand,ECS system
par-ticipants behave according to simple local pro-tocol and thus the system is highly scalable and resilient to failures of its elements.
Future work may include: (1) Further
under-standing of parallel program types; (2)
Inclu-sion of migration costs, query costs for CM system, faults (within the system or coming
from outside), multi-layered systems
inhomo-geneous processors; (3) Perform the
simula-tion experiments with real-world parameters and compare ECS with Depth First (DF) and
Depth First Deques(DFD); and(4)Implement
4. Acknowledgments
I thank E. Arkin, R. Estkowski, and J. Mitchell for useful discussions on the work reported here. I especially thank Michael A. Bender, my coau-thor on the earlier version of this paper. This work was funded by a grant from ISX Corpora-tion(as a DARPA subcontract).
References
1] T. E. ANDERSON, D. E. CULLER ANDD. A. PATTER
-SON. A Case for NOW(Networks of Workstations).
IEEE Micro, 15(1):54–64, February 1995.
2] N. ARORA, R. BLUMOFE AND G. PLAXTON. Thread
scheduling for multiprogrammed multiprocessors. In
Proceedings of the 10th ACM Symposium on Parallel Algorithms and Architectures (SPAA), pp. 119–129, 1998.
3] Y. AUMANN, M. A. BENDER ANDL. ZHANG. Efficient
execution of nondeterministic parallel programs on asynchronous systems. Information and Computa-tion, 139(1):1–16, 1997.
4] Y. AUMANN, K. PALEM, Z. KEDEM ANDM. O. RA
-BIN. Highly efficient asynchronous execution of large
grained parallel programs. InProceedings of the 34th Annual Symposium on Foundations of Computer Science (FOCS), pp. 271–280, 1993.
5] M. A. BENDER ANDM. O. RABIN. Scheduling Cilk
multithreaded parallel programs on processors of different speeds. In Proceedings of the 12th ACM Symposium on Parallel Algorithms and Architectures (SPAA), pp. 13–21, 2000.
6] R. BLUMOFE ANDC. LEISERSON. Scheduling
multi-threaded computations by work stealing. In Proceed-ings of the 35th Annual Symposium on Foundations of Computer Science (FOCS), pp. 356–368, 1994.
7] R. D. BLUMOFE, C. F. JOERG, B. C. KUSZMAUL, C. E.
LEISERSON, K. H. RANDALL ANDY. ZHOU. Cilk: An
efficient multithreaded runtime system. Journal of Parallel and Distributed Computing, 37(1):55–69,
1996.
8] C. CHEKURI AND M. A. BENDER. An efficient
ap-proximation algorithm for minimizing makespan on uniformly related machines.Journal of Algorithms, 41:212–224, 2001.
9] P. DASGUPTA, Z. M. KEDEM ANDM. O. RABIN.
Par-allel processing on networks of workstations: A fault-tolerant, high performance approach. In Proc. 15th IEEE International Conference on Distributed Computing System, pp. 467–474, 1995.
Received:June, 2002
Accepted:September, 2002
Contact address:
Nenad Jovanovi´c Department of Applied Mathematics and Statistics
State University of New York Stony Brook, NY 11794-4400, USA e-mail:[email protected]