49
Head-Discharge Relationships for Rectangular
Flat-Crested Slit Weir
Rosley Jaafar
Faculty of Mechanical Engineering, Universiti Teknologi MARA, Pulau Pinang Malaysia.
Abstract
The rectangular weir is the most commonly used device in channel and laboratory for flow measurement due to its simplicity. The rectangular sharp-crested slit weir has been shown to be good at measuring small (< 0.005 m3/s) flow rates. In this study, the rectangular slit weir concept is extended to find the
head-discharge relationship of water flows over a contracted rectangular flat-crested slit weir under free flow conditions. The head-discharge relationship is determined experimentally using a nine different weir heights with 10 mm weir width and 4 mm weir crest thickness at small discharges (< 0.00067 m3/s). The
experimental data of actual and predicted discharge is verified by using a statistical analysis. A linear regression equation correlating the head-discharge relationship provides an accurate prediction of free flow discharge over the weir to yield results within 2.1% error of actual discharges and have a strong relationship. The presented head-discharge equation can use to estimate the discharge flow of water over rectangular flat-crested slit weir with an appropriate limitation.
Keywords: discharge equation; water discharge; discharge coefficient; slit weir
Introduction
Weirs are among the oldest and simplest hydraulic structures that have been used for many years by hydraulic engineers for flow measurement, energy dissipation, flow diversion and other means (Borghei et al.1999). Flow measurement structure is generally designed to act as a control in the channel in order to provide a unique relationship between the upstream head and the discharge (Boiten, 2002). The relationship of discharge to a measurement of water level can be forecast either from basic physical principles or from empirical evidence on performance. The discharge equation as well as a head-discharge relationship for a weir cannot be derived exactly since the flow which is affected by viscosity, surface tension, the geometry of the weir and several other parameters is complicated.
Therefore, weir types and dimensions are standardized an accurate discharge formula are developed empirically using extensive experimental data. The general form of free flow head-discharge relationship for any weir can be expressed as:
n
KH
Q
(1)where Q is the discharge, H is the depth of the flow upstream of the weir measured above the weir crest or head, K is a flow coefficient and n is an exponent number and theoretically equal to 1.5 and 2.5 for rectangular and triangular weirs respectively. The
accuracy of discharge measurements depends on the precision of the reading at the head over the weir.
For many years, the problem of flow over sharp-crested weirs has been a subject of many investigations. In general, the investigation is carried out to study the relationship between discharges and head such as Shesha Prakash and Shivapur (2004), Mallikarjuna et.al (2005), Baddour (2008), Tullis and Neilson (2008) and Aydin et.al (2011). Rectangular sharp-crested weirs placed perpendicularly across the rectangular channel are widely used for the measurement of flow in the laboratory as well as in small channels in the field (Wu and Rajaratnam, 1996). Aydin et al. (2002 and 2006) introduced the concept of slit weir. This weir is a rectangular sharp-crested with very small weir width, in which is effective in measuring very small of water flow rates. Ramamurthy et al. (2007) extended the study of the slit weir concept with experiments on rectangular sharp-crested multislit weir for measuring a wide range of water flow rates.
50 sharp-crested weir for measuring flow of water at
small flow rates at different weir heights. The effect of fluid properties and channel geometry are not considered. The discharge characteristics are investigated in laboratory to find the head-discharge relationships of the weir Experimental Setup and Procedures
Experiments were performed in a rectangular stainless steel channel of 1100 mm long, 200 mm wide and 200 mm deep (Figure 1). The channel entrance is installed with baffle plates to ensure smooth entry of water in the channel. The slit weirs were fabricated from perspex plates 4 mm thick, which is similar to the weir crest thickness (Figure 2). Plasticine was used to prevent water leakage between channel walls and frame edges of weir plate. A rotameter was used to determine the actual discharge measurements. The discharges examined in this study are from 0.00033 to 0.00067 m3/s. The
steel ruler, in which the accuracy is about 5% of the scale, was used to measure the water level at the position of 390 mm from the weir plate. Ackers et al. (1978) stated that the gauging station should be located sufficiently far upstream to avoid the area of water surface draw-down, that is between three to four times the maximum total head over the weir. In this study, the location is about 3.7 times of the maximum total head over the weir upstream from the face of the weir (390 mm as shown in Figure 1) in which it follows the recommendation.
The experiment has been repeated for nine different weir plates with the total of 45 runs in which five
series of discharge for each weir plate. Water is filled in the feed tank with water from the tap and the pump is started to admit water into the main tank until it discharges over the weir plate. The flow control valve is adjusted to obtain the appropriated discharges reading at the rotameter. The water in the channel is supplied and circulated using a water pump at constant speed. Head measurements were replicated thrice, and the mean was used in the analysis. Measurements were conducted for nine different weir heights P (0.035m, 0.04m, 0.045m, 0.05m, 0.055m, 0.06m, 0.065m, 0.07m, 0.075m) in a channel with a width (B) of 0.2 m. According to Aydin et al. (2002), the width of a weir is not classified a slit if the width exceeds more than 0.075 m. Therefore, following their recommendation, the weir width b = 0.01 m is used for this study. The minimum and maximum values of head H measured for each weir height are shown in Table 1. The Experimental data are covered for the range of 6.3 < H/b < 10.4 and 0.853 < H/p < 2.852 collectively.
The liquid used was clean water at 22° C, which is considered to possess the standard properties of water such as surface tension = 0.0728 N/m, dynamic viscosity = 1.002 x 10⁻³ kg/ms,
kinematic viscosity = 1 x 10⁻⁶ m2/s, density =
998.2 kg/m3, and specific weight = 9789 N/m3.
Figure 1: Top and side views of the experimental apparatus 708 mm
200 mm Weir plate
1100 mm Baffle plates
Channel
Main tank
Pipe line
Feed tank
Rotameter
Supports
Inflow, Q
51 Figure 2: Sketch of contracted rectangular flat-crested slit weir
Discussion of Results
As the depth of water above the weir head increases, the discharge over the weir increases correspondingly. The relationship that is always sought with a weir is between the head H over the crest and the discharge Q. From the actual values of QA, for each weir height P, the experimental result
in the minimum and maximum values of weir heads H are shown in Table 1, however the majority of the values were between 0.064 m and 0.096 m.
Table 1: Minimum and maximum values of weir heads
Series P (m) Hmin (m) Hmax
(m)
1 0.035 0.069 0.100
2 0.040 0.067 0.102
3 0.045 0.064 0.104
4 0.050 0.065 0.102
5 0.055 0.066 0.101
6 0.060 0.066 0.101
7 0.065 0.063 0.099
8 0.070 0.064 0.098
9 0.075 0.064 0.096
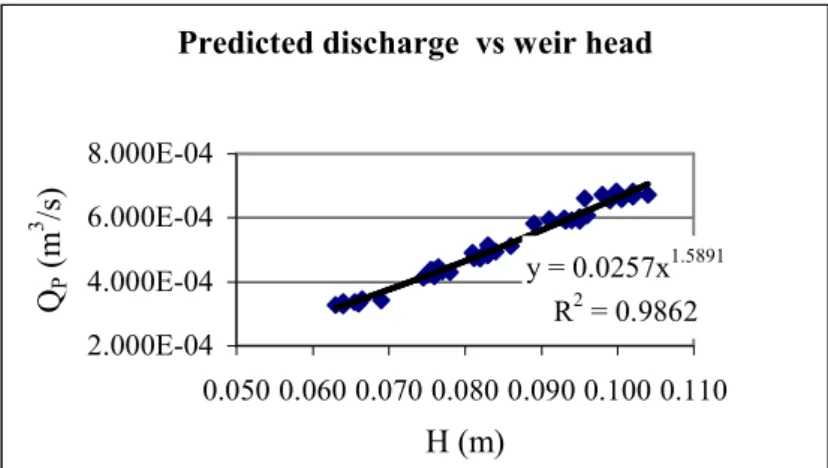
The variation of the head-discharge relationship of actual discharge QA with head H and predicted
discharge QP with head H are shown in the power
graph form as shown in Figure 3 and 4 respectively. The best-fitted curve lines are obtained by the following relationships:
QA = 0.0257H1.592 (2)
QP = 0.0257H1.589 (3)
Equation (2) and (3) show the values of n are not equal 1.5, in which n =1.592 and 1.589 respectively. Thus, a number of alternative equations can be written that may fit the actual discharges or even better than the standard equation. The values of coefficient of determination R2 are 0.978 and 0.986 for Q
A with H and QP with
H respectively, suggesting a very good fit of the regression model. The values also indicate clearly the strong positive non-linear relationship between the discharge and head. The graphs also show a curve line with positive slopes, means that the weir head increases exponentially with increasing discharge.
t = 4 mm
B
Approach channel
Flow
b
P
52 y = 0.0257x1.592
R² = 0.9778
2.000E-04 3.000E-04 4.000E-04 5.000E-04 6.000E-04 7.000E-04 8.000E-04
0.050 0.070 0.090 0.110
Q
A(m
3
/s)
H (m)
Actual discharge vs weir head
Figure 3: Actual discharge QA plotted against weir head H for head-discharge relationship of contracted
rectangular flat-crested slit weir
Predicted discharge vs weir head
y = 0.0257x1.5891 R2 = 0.9862 2.000E-04
4.000E-04 6.000E-04 8.000E-04
0.050 0.060 0.070 0.080 0.090 0.100 0.110
H (m)
Q
P(m
3
/s)
Figure 4: Predicted discharge QP plotted against weir head H for head-discharge relationship of
contracted rectangular flat-crested slit weir
Error in water measurement is commonly expressed in percent of actual discharge EQA as follows:
A A p QA
Q
Q
Q
E
(
)
100
(4)where QA (or measured discharge) is the actual
discharge from the device output and QP is the
predicted discharge.
The comparison of actual discharges with predicted discharges can be seen in Table 2. The outcome of the result indicate that the ranges of the absolute error of QP are 0.14% - 7.01% of actual
discharges. The average value of the absolute error of discharge measurement is 2.1% of actual discharges for QP as shown in Table 3. In other
words, the accuracy at the point of average error is 97.9% of actual discharges. Aydin et al. (2006) who was investigated experimentally a contracted rectangular sharp-crested slit weir in small discharges obtained the error was + 2.25%. In addition, most water measuring devices can be produced accuracies of +1% to +5% (USBR 1997)
and the accuracy of 3% to 8% of the actual discharges can be obtained for structures with free flow conditions (Kolkman et al. 1994). As a result, the values of absolute error are acceptable and the accuracy of the data for contracted rectangular flat-crested slit weir is good.
The ratio of the actual discharges is compared with the predicted discharges is denoted by a (
= QA/QP). The results are shown in Table 2. The
range values of is 0.94 – 1.06 with the average value of 0.99 as shown in Table 3. If the average
value of equals 1.0, it means the actual discharges are equal to the predicted discharges. If the average value of is greater (or less) than 1.0, it means the actual discharges are greater (or less) than the predicted discharges. Even though the result shows the mean value of QP is slightly higher than QA, it
53 of is equal 1.062, which can be in-line with the findings in this study.
Table 2: Comparison of values of actual discharge and predicted discharge obtained for contracted rectangular flat-crested slit weir.
Weir height (P), m Actual discharge (QA)
10-4 m3/s
Predicted discharge (QP)
10-4 m3/s
Error (EQA)
%
Ratio ()
0.035 3.33 – 6.67 3.43 – 6.81 2.12 – 5.52 0.97 – 1.06
0.040 3.33 – 6.67 3.45 – 6.82 0.8 – 5.19 0.96 – 1.01
0.045 3.33 – 6.67 3.37 – 6.71 0.64 – 2.50 0.98 – 0.99
0.050 3.33 – 6.67 3.37 – 6.66 0.15 – 4.06 0.96 – 1.01
0.055 3.33 – 6.67 3.34 – 6.58 0.44 – 3.26 0.97 – 1.01
0.060 3.33 – 6.67 3.32 – 6.61 0.23 – 3.45 0.99 – 1.01
0.065 3.33 – 6.67 3.28 – 6.54 0.14 – 4.64 0.96 – 1.02
0.070 3.33 – 6.67 3.34 – 6.72 0.26 – 4.99 0.95 – 1.02
0.075 3.33 – 6.67 3.27 – 6.60 0.25 – 7.01 0.94 – 1.02
Table 3: Statistical results of discharges for contracted rectangular flat-crested slit weir
Parameters QA (10-4 m3/s) QP (10-4 m3/s) EQA (%)
Mean 5.0 5.03 2.1 0.99
Standard deviation () 1.19 1.19 1.63 -
Standard error of the mean (m) 0.178 0.178 0.243 -
The values of QA and QP are very close as shown in
Table 3. The values of mean, standard deviation and standard error of the mean for the parameters QP do not differ significantly with QA. The small
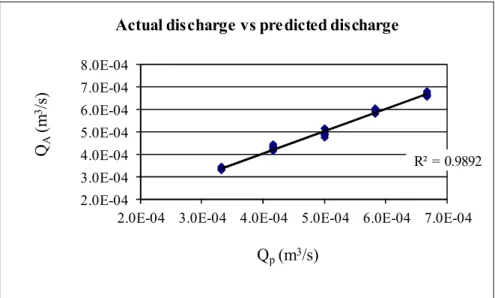
values of standard deviation and standard error mean that the data are clustered closely around the mean value and it gives an indication that the accuracy of the measurements is good. The actual discharges are plotted against predicted discharges
(Figure 5). For the upper part, QA values increase
with increasing values of the head as predicted by equation (3). The graphs show a similar trend in positive slope and perfectly linear, validity the equation developed and the prediction of value QP.
The value of coefficient of determination R2 in
Figure 5 is 0.99, which indicates a strong relationship between the variables
R² = 0.9892
2.0E-04 3.0E-04 4.0E-04 5.0E-04 6.0E-04 7.0E-04 8.0E-04
2.0E-04 3.0E-04 4.0E-04 5.0E-04 6.0E-04 7.0E-04
Q
A(m
3
/s)
Q
p(m
3/s)
Actual discharge vs predicted discharge
Figure 5: Actual discharge QA plotted against predicted discharge QP for contracted rectangular flat-crested slit
weir
Conclusions
The head-discharge relationships of water flows over a contracted rectangular flat-crested slit weir in predicting discharge values from an experimental
54 accuracy of the obtained predicted discharge is
good. As a result, the contracted rectangular flat-crested slit weir can be designed to measure a small range of discharges (< 0.00067 m3/s) at various
weir heights to the limits of 6.3 < H/b < 10.4 and 15.75 < H/p < 2.85.
References
Ackers, P. White, W.R., Perkins, J.A., and Harrison, A.J.M., (1978). Weir and flumes for flow
measurement. John Wiley & Sons, New York.
Aydin, I., Ger, A.M. and Hincal, O. (2002).
Measurement of small discharges in open channels by slit weir. Journal of Hydraulic Engineering,
Vol.128. No.2,pp. 234 –237.
Aydin, I., Ger, A.M. and Altan-Sakarya, A.B.(2006). Performance of slit weir. Journal of Hydraulic engineering, Vol.132. No.9, pp.987 - 989.
Aydin,I., Altan-Sakarya, A.B. and Sisman Cigdem. (2011). Discharge formula for rectangular
sharp-crested weirs. Flow Measurement and Instrumentation, 22 (2011), pp.144 -151.
Baddour, R.E.,(2008). Head-Discharge Equation
for Sharp-Crested Polynomial Weir. Journal of
Irrigation and Drainage Engineering. Vol.134, No.2. pp.260-262
Boiten, W. (2002). Flow Measurement Structures. Journal: Flow Measurement and Instrumentation, Vol. 13, pp.203-207.
Borghei, S.M., Jalili, M.R and Ghodsian, M. (1999). Discharge coefficient for sharp-crested side
weir in subcritical flow. Journal of Hydraulic
Engineering. Vol.125, No.10, pp.1051 – 1056.
Jan, C.D, Chang C.J, and Lee, M.H., (2006). Discussion of Design and calibration of a
compound sharp-crested weir. by J. Martinez,
J.Reca, M.T. Morillas, and J.G. Lopez. Journal of Hydraulic Engineering, Vol. 132. No.8, pp.868-870.
Kolkman, P.A, Miller, D.S., and Hager, W.H., (1994). Discharge characteristics. International Association for Hydraulic Research (IAHR), Rotterdam Netherlands.
Mallikarjuna, P., Reddy, K.C., and Lakshmi, A.G., (2006). Model Studies on Discharge Characteristics of Weirs with Modified Crest Shapes. Institution of Engineers (India)
Journal-CV, Vol.87, pp.64-68.
Prakash, M.N.S., and Shivapur, A.V., (2004).
Generalizes Head-Discharge Equation for Flow Over Sharp-Crested Inclined Inverted V-Notch Weir. Journal of Irrigation and Drainage Engineering. Vol.130, No.4. pp.325-330.
Ramamurthy, A.S., Qu, J., Zhai, C. and Vo, D. (2007). Multislit weir characteristics. Journal of Irrigation and Drainage Engineering. Vol.133, No.2, pp.198 –200.
Subramanya, K. (2005). Flow in Open Channels, 2nd edition. Tata McGraw-Hill India.
Tullis, B.P., and Neilson, J., (2008). Performance
of Submerged Ogee-Crest Weir Head-Discharge Relationships, Journal of Hydraulic Engineering.
Vol.134, No.4. pp.486-491.
United States Department of the Interior, Bureau of Reclamation (USBR). (1997). Water measurement
manual, 3rd edition. Denver. USA.
Wu, S. and Rajaratnam, N. (1996). Submerged flow
regimes of rectangular sharp-crested weirs. Journal