THE IMPLEMENTATION OF TAGUCHI APPROACH ON ECM
PROCESS PARAMETERS FOR MILD STEEL AND ALUMINUM
R.Goswami*R. Chouhan*
V. Chaturvedi**
ABSTRACT
In this paper, the cutting of Mild Steel and Aluminum using electrochemical machining
(ECM) with a electrode by using Taguchi approach has been reported. The Taguchi
orthogonal array design is used to formulate the experimental layout, to analyze the effect of
each parameter on the machining characteristics, and to predict the optimal choice for each
ECM parameter such voltage, tool feed and current. It is found that these parameters have a
significant influence on machining characteristic such as metal removal rate (MRR) and
surface roughness (SR). The analysis of the Taguchi method show that, in general the current
significantly affects the SR and voltage affects the MRR. Verification of taguchi approach is
done by confirmation test.
Keywords: ECM, Taguchi method, Aluminum, Mild steel, metal removal rate, Surface roughness, ANOVA.
Electrochemical machining (ECM) is a method of removing metal by a process. It is normally used for mass production and is used for working extremely hard materials or materials that are difficult to machine using conventional methods.[1] Its use is limited intricate contours or cavities in that it removes material instead of adding it. Through a process having a negatively charged electrode a conductive work piec tool is guided along the desired path close to the work but without touching the piece. High metal removal rates are possible with ECM, with no thermal or mechanical stresses being transferred to the part, and mirror surface finishes can be achieved.
In the ECM process, a cathode (tool) is advanced into an anode (work piece). The pressurized electrolyte is injected at a set temperature to the area being cut. The feed rate is the same as the rate of "liquefaction" of the material. The gap between the tool and the work piece varies within 80-800 micrometers (.003 in. and .030 in.) As electrons cross the gap, material from the work piece is dissolved, as the tool forms the desired shape in the work piece. The electrolytic fluid carries away the metal hydroxide formed in the process.
The Implementation of Taguchi Method on ECM Process of Mild Steel and Aluminum study
of these parameters has been performed by many researchers; most of the studies do not much consider both engineering philosophy (DOE) and mathematical formulation (ANOVA) particularly in machining very hard materials such as Aluminum and mild steel. Therefore, the Taguchi method, which is a powerful tool for parametric design of performance characteristics, is used to determine the optimal machining parameters for maximum material removal rate and minimum surface roughness in the ECM operations. The experimental details when using the Taguchi method are described.
2. EXPERIMENTAL PROCESS
Aluminum and mild steel alloy was the target material used in this investigation. Table 1
Figure 1: schematically the experimental set-up ECM
Table1 : Properties of Mild Steel
Table2: Properties of Aluminum
Property Value
Modulus of Elasticity (GPa) 68.3
Poissons Ratio 0.34
Thermal Conductivity (0-100°C) (cal/cms. °C) 0.57 Co-Efficient of Linear Expansion (0-100°C) (x10-6/°C) 23.5
Electrical Resistivity at 20°C (Ω.cm) 2.69
Density (g/cm3) 2.6898
Melting Point (°C) 660.2
Boiling Point (°C) 2480
Property Value
Young’s modulus 210,000M
Density 7.85gm/cm3
3.1. Design of Experiments
The experimental plan for the machining parameters using the L9 orthogonal array was used in this study. This array consists of three control parameters and three levels, as shown in table 3. In the Taguchi method, most all of the observed values are calculated based on ‘the higher the better’ and ‘the smaller the better’. Thus in this paper, the observed values of MRR and SR were set to maximum and minimum respectively. Each experimental trial was performed with three simple replications at each set value. Next, the optimization of the observed values was determined by comparing the standard analysis and analysis of variance (ANOVA) which was based on the Taguchi method.
3.2. Selection of the machining parameters and their levels
The experimental plan has three variables, namely, tool feed, current and applied voltage. On the basis of preliminary experiments conducted by using one variable at a time approach, the feasible range for the machining parameters was defined by varying the voltage (05-15 V) , tool rate (0.10 – 0.30 mm/min) and current (0 – 100 A). In the machining parameter design, three levels of the cutting parameters
Table 3: Design scheme of experiment of Parameters and levels
Process parameter Level
1
Level 2
Level 3
A
Voltage(V) 05 10 15B
Tool feed (mm/min) 0.10 0.20 0.30C
Current(A) 20 60 100Table 4: Experimental layout using L9 orthogonal array
Experiment No. A
Voltage(V)
B Tool feed (mm/min)
C Current(A)
1 1 1 1
2 1 2 2
3 1 3 3
4 2 2 3
5 2 3 1
6 2 1 2
7 3 3 2
3.3. Analysis of Variance (ANOVA)
Analysis of variance (ANOVA) and the F test (standard analysis) are used to analyze the experimental data as follows [2, 3, 4]:
CF = T2/n (1)
(2)
Sz = (Yz12/Nz1 + Yz22/Nz2 + Yz32/Nz3) –CF (3)
fz = (number of levels of parameter z) – 1 (4)
fT = (total number of results) – 1 (5)
fe = fT - Σfz (6)
Vz = Sz/fz (7)
Se = ST - ΣSz (8)
Ve = Se/fe (9)
Fz = Vz/Ve (10) Sz’ = Sz - (Ve * fz) (11)
Pz = Sz’/ ST * 100% (12)
Pe = (1 - Σ Pz) * 100% (13)
Where;
CF correction factor T total of all results
n total number of experiments
ST total sum of squares to total variation
Yi value of results of each experiment (i= 1 to 27) Sz sum of squares due to parameter z(z= A, B and C) Nz1, Nz , Nz3 repeating number of each level(1, 2, 3) of parameter z Yz1, Yz , Yz3 value of results of each level(1, 2, 3) of parameter z fz degree of freedom(DOF) of parameter z
fT total degree of freedom
fe degree of freedom(DOF) of error term Vz variance of parameter z
Se sum of squares of error term Ve variance of error term Fz, F ratios of parameter z Sz’ pure sum of square
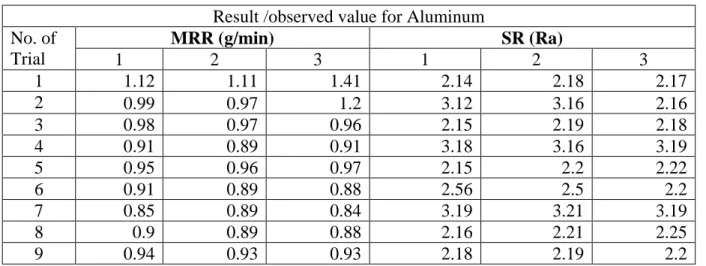
In this paper, all the analysis based on the Taguchi method is done by Taguchi to determine the main effects of the process parameters, to perform the analysis of variance (ANOVA) and to establish the optimum parameter conditions. The main effects analysis is used to study the trend of the effects of each of the factors, as shown in figures 2. The machining performance (ANOVA-significant factor) for each experiment of the L9 can be calculated by taking the observed values of the as an example from table 5 and 8.
Table 5 : Result /observed value for Aluminum
Result /observed value for Aluminum No. of
Trial
MRR (g/min) SR (Ra)
1 2 3 1 2 3
1 1.12 1.11 1.41 2.14 2.18 2.17
2 0.99 0.97 1.2 3.12 3.16 2.16
3 0.98 0.97 0.96 2.15 2.19 2.18
4 0.91 0.89 0.91 3.18 3.16 3.19
5 0.95 0.96 0.97 2.15 2.2 2.22
6 0.91 0.89 0.88 2.56 2.5 2.2
7 0.85 0.89 0.84 3.19 3.21 3.19
8 0.9 0.89 0.88 2.16 2.21 2.25
9 0.94 0.93 0.93 2.18 2.19 2.2
Table 6: Analysis of variance (ANOVA) and F-test for MRR
Factor DF SS Varience F-ratio s'z %
A 2 0.181 0.090 12.857 0.177 46.286
B 2 0.005 0.003 0.428 0.001 0.262
C 2 0.070 0.035 5.000 0.066 17.272
e 18 0.126 0.007 0.121 31.675
Table 7: Analysis of variance (ANOVA) and F-test for SR
Factor DF SS Varience F-ratio s'z %
A 2 0.213 0.107 1.138 0.129 2.407
B 2 1.672 0.836 8.893 1.588 29.613
C 2 1.783 0.892 9.489 1.699 31.682
Table 8: Result observed valau for Mild steel
Result /observed value for Mild steel No. of
Trial
MRR (g/min.) SR (Ra)
1 2 3 1 2 3
1 0.73 0.76 0.77 3.14 3.12 3.16
2 0.67 0.66 0.65 3.28 3.3 3.32
3 0.76 0.73 0.73 3.69 3.7 3.71
4 0.97 0.88 0.89 3.63 2.99 2.36
5 0.89 0.91 0.9 2.64 2.66 2.68
6 1.02 1.09 1.11 3.69 3.71 3.73
7 0.9 0.9 0.91 3.5 3.51 3.53
8 1.03 1.04 1.02 3.69 3.7 3.72
9 0.88 0.89 0.87 2.69 2.72 2.7
Table 9: Analysis of variance (ANOVA) and F-test for MRR
Factor DF SS Varience F-ratio s'z %
A 2 0.326 0.163 32.600 0.322 71.912
B 2 0.010 0.005 1.000 0.006 1.339
C 2 0.012 0.006 1.200 0.008 1.737
e 18 0.100 0.005 0.096 21.428
Table 10: Analysis of variance (ANOVA) F-test for SR
Factor DF SS Varience F-ratio s'z %
A 2 0.320 0.160 1.428 0.236 4.683
B 2 0.140 0.070 .625 0.056 1.112
C 2 2.560 1.280 11.428 2.476 49.034
e 18 2.03 0.112 1.946 38.534
For Aluminum
Main effects of each factor on MRR
Main effects of each factor on SR
0 1 2
0 10 20
M R R VOLTAGE 0.8 0.91 1.1
0 0.2 0.4
M R R TOOL FEED 0.8 0.91 1.1
0 100 200
M R R CURRENT 0 2 4
0 10 20
S R VOLTAGE 2.48 2.5 2.52 2.54
0 0.2 0.4
S R TOOL FEED 2.452.5 2.552.6 2.65
0 100 200
S R
For Mild Steel
Main effects of each factor on MRR
Main effects of each factor on SR
CONCLUSION
This research paper is used to optimize the machining condition of Aluminum and Mild Steel by ECM with an electrode. Taguchi approach has been used to determine the main effects, significant factors and optimum machining condition to the performance of ECM Based on the results presented herein, we can conclude that, the voltage is the most significant parameter for MRR in both material, and the current most significant parameter for SR in both material and according to graph predicted optimal parameter setting for MRR of Aluminum is (A1,B1,C1) and SR of Aluminum is (A1,B1.C1). In case of Mild Steel
0 0.5 1
0 10 20
M R R VOLTAGE 0 1 2
0 0.2 0.4
M R R TOOL FEED 0 0.5 1
0 100 200
M R R CURRENT 2.5 3 3.5
0 10 20
S R
VOLTAGE
3.253.3 3.353.4
0 0.2 0.4
S R TOOL FEED 2.5 3 3.5
0 100 200
S R
(A3,B3,C2).
CONFIRMATION TEST
According graph to predicted optimal parameter setting for MRR of Aluminum (A1,B1,C1)
used have been consider the experiment found is MRR 1.08 (g/min.) and SR of Aluminum (A1,B1,C1) have been used to consider the experiment for SR and found the value 1.99(Ra).In case of parameter setting for MRR of Mild Steel (A2,B2,C2) have been consider for the experiment and found MRR is 1.02(g/min.) and SR of Mild Steel (A3,B3,C2) have been consider for the experiment for SR and found the value 2.20(Ra). These result those same implementation of Taguchi Method ECM.REFERENCES
[1] J.A. McGeough, “Advanced Methods of Machining”, Chapman and Hall, New York, 1998. [2] Ranjit K.Roy, “A Premier On The Taguchi Method”, Van Nostrand Reinhold, New York, 1996.
[3] Ranjit K.Roy, ”Design of Experiments Using the Taguchi Approach”, John Wiley & Sons, New York, 2001.
[4] Glen Stuart Peace, “Taguchi Methods”, Addison-Wesley Publishing, inc, 1993
[5] Process. Ross PJ. Taguchi techniques for quality engineering. New York: McGraw-Hill; 1988
[6] Sorkhel S K, Bhattacharyya B, “Parametic control for optimal quality of the workpiece surface in ECM,” J. Mater. Process. Technol., vol. 40, pp. 271-286, January 1994.