ASIMPLEMENTATION OF TAGUCHI TECHNIQUE FOR
OPTIMIZATION OF GMAW PROCESS PARAMETERS
Amit Soni*Prof. Sanjay Goyal**
Prof. Ranjeet P.S. Chauhan***
ABSTRACT
The present study is to investigate the optimization process parameters for Gas Metal Arc
Welding (GMAW).The joint quality can be defined in terms of properties such as weld-bead
geometry, mechanical property & distortion. The optimization of GMAW operating
parameters are for alloy steel work piece using Taguchi technique. Nine experimental runs
based on an orthogonal array Taguchi method were performed. This paper presents the
influence of welding parameters like welding current, travel speed, and wire feed speed. The
objective functions have been chosen in relation to parameters of GMAW bead geometry
Bead width, Bead height and Penetration for quality target. When the experiment is
completed then the desired inputs are given to the model and it gives estimated the error
between the actual and predicted result. The signal–to-noise (S/N) ratio is also applied to
identify the most significant factor and predicted optimal parameter setting. Experiment with
the optimized parameter setting, which have been obtained from the analysis, are giving to
validate the result. The confirmation test is conducted and found the result closer to the
optimize result. These result showed the successful implementation of methodology.
Keywords: - Weld bead geometry, Taguchi orthogonal array, Signal-to-Noise (S/N) ratio,
GMAW
*Pg Student, Mechanical Engg. Deptt. Mpct Gwalior, India
**Associate Professor, Mechanical Engg. Deptt., Mpct Gwalior, India ***
INTRODUCTION
Welding is a fabrication or sculptural process that joins materials, usually metals or thermoplastics, by causing coalescence. This is often done by melting the work pieces and adding a filler material to form a pool of molten material (the weld pool) that cools to become a strong joint, with pressure sometimes used in conjunction with heat, or by itself, to produce the weld. Gas Metal Arc Welding (GMAW) is a welding process which joins metals by heating the metals to their melting point with an electric arc. The arc is between a continuous, consumable electrode wire and the metal being welded. The arc is shielded from contaminants in the atmosphere by a shielding gas. GMAW can be done in three different ways:
1. Semiautomatic Welding - equipment controls only the electrode wire feeding. Movement of welding gun is controlled by hand. This may be called hand-held welding.
2. Machine Welding - uses a gun that is connected to a manipulator of some kind (not hand-held). An operator has to constantly set and adjust controls that move the manipulator.
3. Automatic Welding - uses equipment which welds without the constant adjusting of controls by a welder or operator. On some equipment, automatic sensing devices control the correct gun alignment in a weld joint.
the influence of welding parameters like welding current, welding voltage, welding speed on penetration depth of MS C20 material during welding. A plan of experiments based on Taguchi technique has been used to acquire the data. An orthogonal array, signal-to-noise (S/N) ratio and analysis of variance (ANOVA) are employed to investigate the welding characteristic of MS C20 material & optimize the welding parameters.
M. Aghakhani et al [6] developed Taguchi’s method of design of experiments a mathematical model using parameters such as, wire feed rate (W), welding voltage (V), nozzle-to-plate distance (N), welding speed (S), and gas flow rate (G) on weld dilution. After collecting data, signal-to-noise (S/N) were calculated and used in order to obtain the optimum level for every input parameter. Subsequently, using analysis of variance the significant coefficients for each input factor on the weld dilution were determined and validated. Farhad Kolahan et al [11] used modelling and optimization using a set of experimental data and regression analysis. The set of experimental data has been used to assess the influence of GMAW process parameters in weld bead geometry. The process variables considered here include voltage (V); wire feed rate (F); torch Angle (A); welding speed (S) and nozzle-to-plate distance (D). The process output characteristics include weld bead height, width and penetration. The Taguchi method and regression modelling are used in order to establish the relationships between input and output parameters. Dinesh Mohan Arya et al [9] used optimization of MIG welding process parameters for alloy steel work piece using grey relational analysis method. Sixteen experimental runs based on an orthogonal array Taguchi method were performed. The welding parameters like welding diameter, welding current, arc voltage, welding speed and gas flow rate optimization based on bead geometry of welding joint. Tensile strength, Bead width, Bead height, Penetration and Heat affected zone (HAZ) for quality target.
MATERIAL SELECTION
Alloy steel pipe as a work piece.The chemical composition of alloy steel by (mass %) is given as follows: Table: 1. Chemical composition of alloy steel
Alloy steel C Mn P S Si Cr Mo Cu
Composition % mass
0.08- 0.12
0.30- 0.60
0.020 0.010 0.20- 0.50
8.0- 9.5
0.85- 1.05
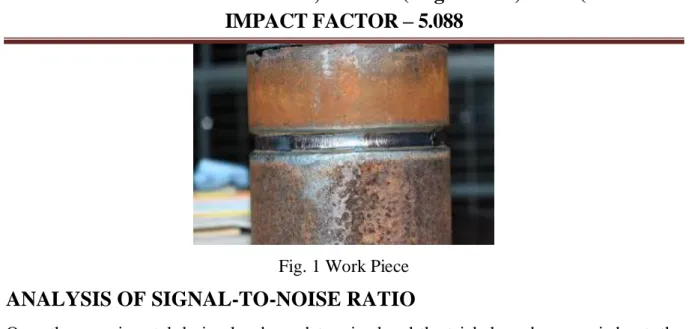
Fig. 1 Work Piece
ANALYSIS OF SIGNAL-TO-NOISE RATIO
Once the experimental design has been determined and the trials have been carried out, the measured performance characteristic from each trial can be used to analyze the relative effect of the different parameters. To demonstrate the data analysis procedure, the following L9 array will be used, but the principles can be transferred to any type of array.
In this array, it can be seen that any number of repeated observations (trials) may be used. Ti,j represents the different trials with i=experimental number and j=trial number. it should be noted that the Taguchi method allows for the use of a noise matrix including external factors affecting the process outcome rather than repeated trials, but this is outside of the scope of this article.
Table: 2. Array Matrix Experiments
Exp.No P1 P2 P3 T1 T2 … TN
1 1 1 1 T1,1 T1,2 … T1,N
2 1 2 2 T2,1 T2,2 … T2,N
3 1 3 3 T3,1 T3,2 … T3,N
4 2 1 2 T4,1 T4,2 … T4,N
5 2 2 3 T5,1 T5,2 … T5,N
6 2 3 1 T6,1 T6,2 … T6,N
7 3 1 3 T7,1 T7,2 … T7,N
8 3 2 1 T8,1 T8,2 … T8,N
9 3 3 2 T9,1 T9,2 … T9,N
of the performance characteristic. In the equation below, it is the mean value and Si is the variance. It is the value of the performance characteristic for a given experiment.
; ;
Where,
i=experiment number, u=Trial number, Ni=Number of trials for experiment i
For the case of minimizing the performance characteristic, the following definition of the SN ratio should be calculated.
For the case of maximizing the performance characteristic, the following definition of the SN ratio should be calculated.
After calculating the SN ratio for each experiment, the average SN value is calculated for each factor and level. This is done as shown for parameter 3 (P3) in the array:
Table :3. Calculation of S/N values Experiment
Number
P1 P2 P3 SN
1 1 1 1 SN1
2 1 2 2 SN2
3 1 3 3 SN3
4 2 1 2 SN4
5 2 2 3 SN5
6 2 3 1 SN6
7 3 1 3 SN7
8 3 2 1 SN8
9 3 3 2 SN9
S
Once these SN ratio values are calculated for each factor and level, they are tabulated as shown below and the range R(R=high SN-low SN) of the SN for each parameter is calculated and entered into the table. The larger the R value for a parameter, the larger the effect the variable has on the process. This is because the same change in signal causes a larger effect on the output variable being measured.
Table:4. Rank Determination
LEVEL P1 P2 P3
1 SNP1,1 SNP2,1 SNP3,1
2 SNP1,2 SNP2,2 SNP3,2
3 SNP1,3 SNP2,3 SNP3,3
RP1 SNP2,4 SNP3,4
RANK … … …
The Taguchi method is a systematic application of design and analysis of experiments for the purpose of designing and improving product quality. This method determines the parameter settings, which maximizes the S/N ratio in each problem by performing the designed experiment systematically. The procedure of the Taguchi method is as follows.
Step 1: Identify the main function, side effects, and failure mode Main function - Optimize the process parameters namely
A. Bead Width B. Bead Height C. Penetration
D. Heat Effected Zone E. Height of reinforcement F. Strength
Side effects - Since the first trial application no other quality characteristics will be observed. Failure mode – Control factor levels are selected so that there will not be any failure during experimentation leading to aborting an experiment.
Step 2: Identify the noise factors, testing condition, and quality characteristics
Some Noise Factors – Humidity, Ambient temperature, Shock, Vibration, Consumer’s usage conditions, Filler Wires made by different manufactures (ESAB, Lincoln, Advani-Kirloskar), Weld machines built by different manufacturers (Fronious, ESAB, Miller, Lincoln, L&T, Excel)
Testing condition – Keep the diameter constant of consumable electrode for all experiments Quality characteristics – Bead width, Bead height, Penetration
Step 3: Identify the objective function to be optimized 1) Bead Width Smaller-the-better 2) Bead Height Smaller-the-better 3) Penetration Larger-the-better Step 4: Identify the control factors and their levels
Table: 5. Control factors and their levels
Serial No. Control Factors Notations Level 1 Level 2 Level 3 1 Welding Current
(amp)
A 80 85 90
2 Travel Speed (mm/min)
B 90 100 110
3 Wire Feed Speed (m/min)
C 2.5 2.6 2.7
Table: 6. Operating range of parameters
Serial No. Control Variable Notations Value with range
1 Welding Current (Amp) A 80-90
2 Travel Speed (mm/min) B 90-110
3 Wire Feed Speed (m/min) C 2.5-2.7
Step 5: Select the orthogonal array matrix experiment Orthogonal Arrays with 3 – Level Factors
NO. OF FACTORS 2-4 5-7 8-13
ORTHOGONAL ARRAY L9 L18 L27
Table: 7. Experimental layout using L9Orthogonal array
Step 6: Conduct the matrix experiment
Table: 8. Experimental data
Experiment No. Bead Width (mm) Bead Height (mm) Penetration(mm)
1 5.61 0.201 1.201
2 5.89 0.209 1.311
3 6.31 0.205 1.198
4 6.02 0.198 1.213
5 6.21 0.193 1.105
6 5.13 0.213 0.997
7 5.29 0.211 0.992
8 7.12 0.198 1.314
9 6.35 0.201 1.213
Step 7: Analyze the data; predict the optimum levels for each control factors
The experiment was performed on alloy steel pipe work piece. The three process variables namely, welding current, travel speed and wire feed speed, which affects the bead width, bead height and penetration were selected for the Taguchi design. A L9 (33) orthogonal array design is adopted for experimentation for alloy steel. The nine experiments for alloy steel work piece were conducted by varying all the parameters and study the influence of these parameters (between smaller is better and larger is better) on material surface bead width, bead height and penetration. Alloy steel work piece was taken to measure the welding bead
Experiment No. A B C
1 1 1 1
2 1 2 2
3 1 3 3
4 2 1 2
5 2 2 3
6 2 3 1
7 3 1 3
8 3 2 1
width, bead height, Penetration. The bead width, bead height and penetration were measured using bridge cam gauge (BCG) in one time.
The optimal parameter settings are then determined by analyzing the S/N ratio data.
EXPERIMENTAL RESULTS
BEAD WIDTH
Table: 9. Response table for Signal-to-noise ratio (smaller is better)
Level A B C
1 -15.46 -15.01 -15.41
2 -15.22 -16.10 -15.68
3 -15.86 -15.42 -15.44
Delta 0.64 1.09 0.27
Rank 2 1 3
Table: 10. Response table for Means
Level A B C
1 5.937 5.640 5.953
2 5.787 6.407 6.087
3 6.253 5.930 5.937
Delta 0.467 0.767 0.150
Rank 2 1 3
B is the most significant factors i.e. Travel Speed
Table: 11. S/N ratio for bead width
Sr. No A B C Bead-width SNRA1 MEANS1
1. 1 1 1 5.61 -14.9793 5.61
2. 1 2 2 5.89 -15.4023 5.89
3. 1 3 3 6.31 -16.0006 6.31
4. 2 1 2 6.02 -15.5919 6.02
5. 2 2 3 6.21 -15.8618 6.21
6. 2 3 1 5.13 -14.2023 5.13
7. 3 1 3 5.29 -14.4691 5.29
8. 3 2 1 7.12 -17.0496 7.12
3 2 1 -15.00 -15.25 -15.50 -15.75 -16.00 3 2 1 3 2 1 -15.00 -15.25 -15.50 -15.75 -16.00 A M e a n o f S N r a ti o s B C
Main Effects Plot for SN ratios
Data Means
Signal-to-noise: Smaller is better
Figure 2 S/N ratio graph
The normalization of bead width is done according to smaller is better. From the table 5.6 it is shown that the parameter B (Travel speed) is the significant parameter in case of bead width and graph for S/N ratio Graph 5.1. Shows the predicted optimal parameter setting which is found A2B1C1.
BEAD HEIGHT
Table: 12. Response table for signal-to-noise ratio
Level A B C
1 13.77 13.84 13.81
2 13.93 13.98 13.87
3 13.84 13.71 13.86
Delta 0.16 0.27 0.05
Rank 2 1 3
Table: 13. Response table for means
Level A B C
1 0.2050 0.2033 0.2040
2 0.2013 0.2000 0.2027
3 0.2033 0.2063 0.2030
Delta 0.0037 0.0063 0.0013
Rank 2 1 3
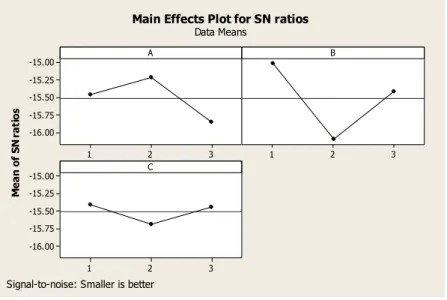
Table :14. S/N ratio for bead height 3 2 1 14.0 13.9 13.8 13.7 3 2 1 3 2 1 14.0 13.9 13.8 13.7 A M e a n o f S N r a ti o s B C
Main Effects Plot for SN ratios
Data Means
Signal-to-noise: Smaller is better
Figure 3 - S/N ratio graph
The normalization of bead height is done according to smaller is better. From the table 5.9 it is shown that the parameter B (Travel Speed) is the significant parameter in case of bead height and graph for S/N ratio Graph 5.2. Shows the predicted optimal parameter setting which is found A2B2C2.
PENETRATION
Table: 15. Response table for signal-to-noise ratio (Larger-is-better)
Level A B C
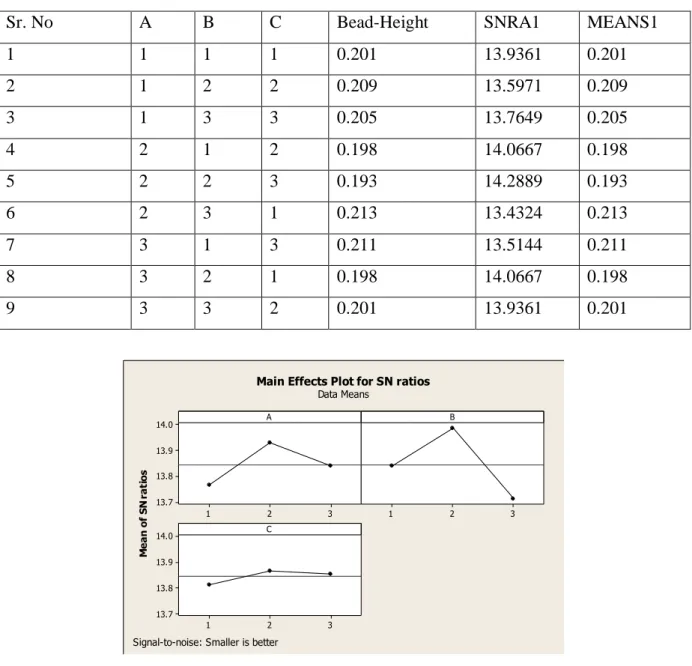
Sr. No A B C Bead-Height SNRA1 MEANS1
1 1 1 1 0.201 13.9361 0.201
2 1 2 2 0.209 13.5971 0.209
3 1 3 3 0.205 13.7649 0.205
4 2 1 2 0.198 14.0667 0.198
5 2 2 3 0.193 14.2889 0.193
6 2 3 1 0.213 13.4324 0.213
7 3 1 3 0.211 13.5144 0.211
8 3 2 1 0.198 14.0667 0.198
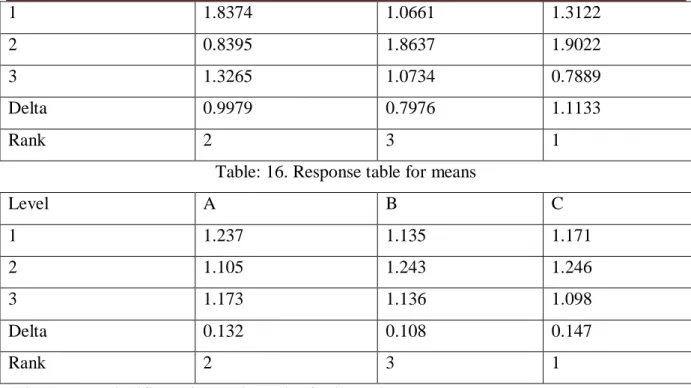
1 1.8374 1.0661 1.3122
2 0.8395 1.8637 1.9022
3 1.3265 1.0734 0.7889
Delta 0.9979 0.7976 1.1133
Rank 2 3 1
Table: 16. Response table for means
Level A B C
1 1.237 1.135 1.171
2 1.105 1.243 1.246
3 1.173 1.136 1.098
Delta 0.132 0.108 0.147
Rank 2 3 1
C is the most significant factors i.e. Wire feed speed
Table :17. S/N ratio for penetration
Sr. No A B C Penetration SNRA1 MEANS1
1 1 1 1 1.201 1.59086 1.201
2 1 2 2 1.311 2.35205 1.311
3 1 3 3 1.198 1.56914 1.198
4 2 1 2 1.213 1.67722 1.213
5 2 2 3 1.105 0.86725 1.105
6 2 3 1 0.997 -0.02610 0.997
7 3 1 3 0.992 -0.06977 0.992
8 3 2 1 1.314 2.37191 1.314
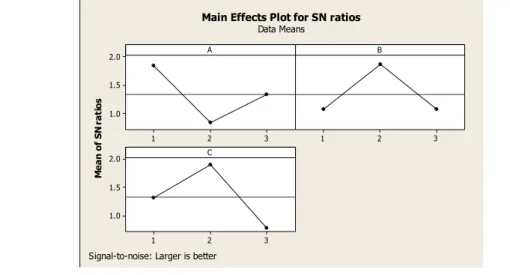
3 2 1 2.0 1.5 1.0 3 2 1 3 2 1 2.0 1.5 1.0 A M e a n o f S N r a ti o s B C
Main Effects Plot for SN ratios
Data Means
Signal-to-noise: Larger is better
Figure 4 - S/N ratio graph
The normalization of Penetration is done according to Larger is better. From the table 5.12 it is shown that the parameter C (Wire feed speed) is the significant parameter in case of Penetration and graph for S/N ratio Graph 5.3. Shows the predicted optimal parameter setting which is found A1B2C2.
Step 8: Perform the verification experiment
A verification experiment is carried out to prove the analysis results.
According to optimal parameter setting for Bead width which is (A2B1C1) the confirmation test has conducted to check the validation and found Bead width is (5.10) which is smaller among all nine results of bead width.
According to optimal parameter setting for Bead height which is (A2B2C2) the confirmation test has conducted to check the validation and found Bead height is (0.187) which is smaller among all nine results of bead height.
According to optimal parameters setting for Penetration is (A1B2C2) the confirmation test has conducted to check the validation and found Penetration is (1.350) which is larger among all nine results of penetration.
RESULT & DISCUSSION
Analysis of GMAW welding process parameters have been done for alloy steel hollow pipe welding and as a response three parameters are considered i.e. Bead width, Bead height and Penetration. We have used signal-to-noise ratio methodology for optimization of this response. Bead width, Bead height is normalized according to Smaller-is-better and Penetration is normalized according to Larger-is-better criteria.
A1B2C2 for Penetration. In case of bead width travel speed is the most significant parameter, in case of bead height travel speed is the most significant parameter and in case of penetration wire feed speed is the most significant parameter.
CONCLUSION
In this study, GMAW welding process parameters are optimized using Taguchi’s signal-to – noise ratio methodology. Three process parameters are considered and experiment is done according to L9 orthogonal array with the control limit of parameters. Response data are found for various quality targets and analysed these data using S/N ratio methodology. S/N graph shown the optimal parameter setting for various responses and according to predicted optimal parameter setting confirmation test have been done to verify the adequacy of the model and found with the expected range for all three responses. These results show the successful implementation of optimization technique in GMAW welding process.
This is a technique which is used for optimization of process parameter; where some parameters within the control range are affecting the performance of the process. In future this technique can be used for performance measurement of any machine and process where responses are depend on some variables.
REFERENCES
[1] G. Haragopal, , P V R Ravindra Reddy, G Chandra Mohan Reddy and J V Subrahmanyam, “Parametric design for MIG welding of Al-65032 alloy using Taguchi Technique”, Journal of Scientific and Industrial Research, Vol. 70, October 2011, pp.844-858
[2] Pawan Kumar, “Parametric Optimization of Gas Metal Arc Welding of Austenitic Stainless Steel (AISI 304) & Low Carbon Steel using Taguchi’s technique”, International Journal of Engineering Research and Management research, Vol. 3, Issue 4, Aug 2013, pp.18-22
[3] H.J. Park, D.C. Kim, M.J. Kang, S. Rhee, “Optimization of wire feed rate during pulse MIG welding of AI sheets” Journals of Achievements in material and Manufacturing Engineering. Volume 27,Issue 1, March 2008, by international OCSCO world.
[4] M. Suban, J.Tusek-“Dependence of Melting Rate in MIG/MAG Welding on the type of Shielding Gas used” Journal of Material Processing Technology, 119 (2001) 185-192.
Minerals & Material Characterization & Engineering” Volume9, No. 4, pp.353-363, 2010.
[6 ] M.Aghakhani, EMehrdad and E.Hayati, “Parametric optimization of Gas Metal Arc Welding on weld dilution” International Journal of Modelling and Optimization, Vol. 1, No. 3, August 2011
[7] J. Pasupathy, V. Ravisankar “Parametric optimization of TIG welding parameters using Taguchi method for dissimilar joint” International Journal of Science & Engineering Research, Volume 4, Issue 11, November 2013
[8] S.Suresh kumar, Dr. S.M. Verma, P. Radhakrishna Prasad, P. Kiran Kumar, Dr. T.Shiva Shanker “Experimental Investigation for Welding Aspects of AISI & 316 by Taguchi technique for the process of TIG/MIG Welding” International Journal of Engineering Trends and Technology- Volume 21, Issue2-2011
[9] Dinesh Mohan Arya, Vedansh Chaturvedi, Jyoti Vimal-“Application of Signal to Noise Ratio Methodology for Optimization of MIG Welding Process Parameters” International Journal of Engineering Research and Applications” ISSN:2248-9622, Volume3, Issue4, August 2012.
[10] S. R. Patil1, C. A. Waghmare – “Optimization of Welding Parameters for Improving Strength of Welded Joints” International Journal of Advanced Engineering Research and Studies E-ISSN2249–8974.
[11] Farhad Kolahan, Mehdi Heidari- “A New approach for predicting and optimizing weld bead geometry in GMAW” World Academy of Science, Engineering and Technology
Vol:3 2009-11-21
[12] D. Yap, S.A. Blackman- “Resents Developments in High Productivity Pipeline Welding” Welding engineering Research Centre Cranfield University Cranfield United Kingdom.