Adaptive Random Testing Based on Two-Point Partitioning
Chengying Mao
School of Software and Communication Engineering,
Jiangxi University of Finance and Economics, 330013 Nanchang, China Email: [email protected]
Keywords:adaptive random testing, test data generation, partition, failure pattern, candidate set
Received:October 24, 2011
Test data generation is a key issue in the field of software testing. Adaptive random testing (ART) method has been proposed by Chen et al. to improve the fault-revealing ability of random testing. In the paper, we are mainly concerned with the partitioning-based adaptive random testing and present a new ART based on two-point partitioning. In the new algorithm, the current max-area region is partitioned by the midpoint of two points instead of a single point. The first point is randomly generated, and the second point is picked out from the candidate set according to the farthest distance criterion. In order to compare our algorithm with other two well-known algorithms, the experiments for the case of two-dimension are performed. The results show that our ART-TPP algorithm has a positive improvement for the other two, i.e. ART-RP and ART-BP. Moreover, the appropriate size of candidate set is determined as 2 or 3 based on our sensitivity analysis.
Povzetek: Predstavljena je nova metoda za generiranje podatkov na osnovi dvo-toˇckovne porazdelitve
1
Introduction
In the past decades, software testing has proved to be an ef-fective way to ensure software quality. As stated by NIST, software errors cost the U.S. economy about $59.5 billion each year, but the testing infrastructure could save 1/3 cost [1]. However, software testing is also a time-consuming and high cost activity in the whole life-cycle of software development. Consequently, it is is necessary to realize the automation of testing activity so as to improve the effi-ciency. At present, test data generation is recognized as the most difficult for automated software testing.
In fact, test data generation is a search process of se-lecting the representative data from the input domain of the program under test. In recent years, the most popu-lar way is to use meta-heuristic search (MHS) techniques such as simulated annealing (SA) [2], ant colony optimiza-tion (ACO) [3], and generic algorithm (GA) [4], to produce test inputs which can find faults with high probability. But this kind of test data generation method has two limitations: (1) It needs the guideline information about program’s in-ternal constructs, and (2) the search process consumes a lot of time due to slow convergence speed. On the other hand, in general, black-box (functional) testing methods, such as random testing and boundary value analysis, can produce test data with high speed and low cost. However, these methods fail to show strong fault revealing capabil-ity. Therefore, a possible solution is to rebuild the low-cost functional testing method to generate more effective test inputs.
Random testing (RT) is a naïve method for generating test data, and has been widely adopted by most popular
testing tools. However, the size of test data set is very lim-ited in comparison with the whole input space of program under test, so the test inputs generated by RT are not really even distribution yet. In order to overcome this problem, Chenet al. proposed an improved method, called adap-tive random testing(ART) [5, 6], to produce more decen-tralized test inputs. Their experimental results show that ART can find potential faults faster than the traditional RT. At present, two kinds of ART have been confirmed effec-tive. One is partitioning-based method [6], and the other is distance-based method [7]. In the former method, random partitioning and bisection are two well-known strategies. In the paper, a new partitioning strategy named two-point partitioning is proposed. We believe that it is a useful sup-plement for the existing ART methods.
The paper is structured as follows. In the next section, it reviews the background of adaptive random testing. It mainly includes two parts: software failure pattern and the basic idea of ART. Then, the two-point partitioning-based ART is addressed in Section 3. In Section 4, some ex-periments are studied to validate the effectiveness of our method. Finally, the concluding remarks are given in Sec-tion 5.
2
Background
2.1
Software failure pattern
speaking, the knowledge about location and shape of fail-ure patterns can facilitate black-box testing methods to se-lect test data.
The failure pattern of program under test, in fact, it is the rule of failure-causing inputs of the program. According to Chen and Schneckenburger’s analysis [6, 7, 8], the patterns of failure-causing inputs can be classified into three types: block pattern, strip pattern and point pattern. As illustrated in Figure 1, for the block failure pattern, the inputs causing program failure are within a specific area. From the per-spective of program code, this kind of fault may lie in the statement block under a compound predicate. For exam-ple, if a fault exists in the branch such asif(a<=x && x<=b && c<=y && y<=d), the failure-causing input area can be denoted as{(a, b),(c, d)}. In the second pat-tern, i.e. strip failure patpat-tern, the failure may be attributed to predicate fault in a branch. For example, if an expected form of predicate if(x+y>=k1) is wrongly written as if(x+y>=k2)by a programmer, the failure-causing in-puts will lie in a strip, whose width is determined by the value of|k1−k2|. In the last failure pattern, the failure-causing inputs will scatter into some points or small areas in the whole input domain. The corresponding faults may occur in a branch with modulo operation or bitwise op-eration etc. For instance, if some statements in a branch if(x%10==0 && y%10==0)contain faults, the corre-sponding failure pattern belongs to the point case.
It should be noted that, we only discuss the two-dimensional case in the above analysis. But these three failure patterns are also applicable to other cases, such as one dimension or high dimension.
2.2
Adaptive random testing
As mentioned above, ART attempts to generate test data which can evenly scatter in the input space with the great-est possible. Hence, this method can enhance the fault-revealing capability of test cases. Based on this idea, Chen
et al. developed a series of ART methods for generating test data set [5, 6, 7]. Furthermore, Ciupaet al. have suc-cessfully used ART to test object-oriented software, and their ARTOO method [10] can reduce the number of tests generated to reveal the first fault.
All existing ART methods can be classified into two types: distance-based strategy and partitioning-based egy. In the paper, we only pay attention to the second strat-egy. Here, we primarily introduce two well-known parti-tioning algorithms proposed by Chenet al[6].
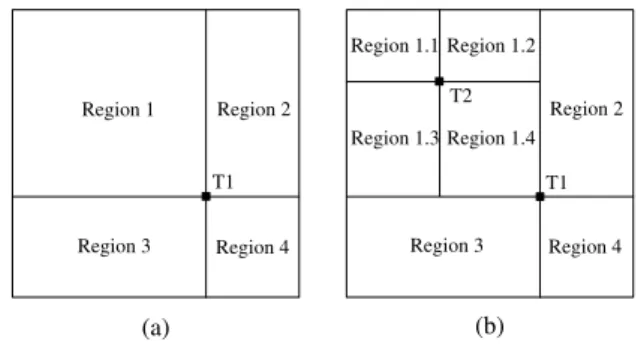
(1)Random Partitioning Algorithm(ART-RP). This kind of partitioning algorithm samples test data according to the proportion of region area to whole input space. The basic process of producing test cases can be described as below.
Without loss of generality, here we assume the input do-main as a rectangle for two-dimension case. As illustrated in Figure 2(a), the initial test input is randomly selected
of the initial input point. Next, the max-area region is se-lected out from them, and the second test input is randomly generated from this area (as shown in Figure 2(b)). At this moment, the whole input domain has been divided into seven regions. Hereafter, the random partitioning is itera-tively performed on the current max-area region until the termination condition is satisfied.
Region 1 Region 2
Region 3 Region 4
Region 2
Region 3 Region 4 Region 1.1 Region 1.2
Region 1.3 Region 1.4
(a) (b)
T1 T1
T2
Figure 2: The illustration for random partitioning algo-rithm (2-Dcase).
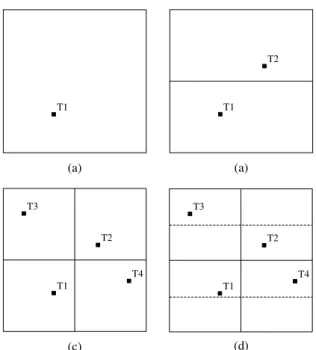
(2)Bisection Algorithm(ART-BP). The second kind of partitioning strategy proposed by Chenet al. is bisection. In this strategy, the partitioning is not based on the coor-dinates of test input points but the width and height of a region.
Initially, as shown in Figure 3(a), a test input T1 is ran-domly generated from the whole input domain. Then, the whole region is divided into two parts through performing a partition on the bisector of region height. Meanwhile, an-other test input T2 is randomly generated in the sub-region, which previously does not contain any test input points (re-fer to Figure 3(b)). Similarly, the region can also be divided on the bisector of width. As shown in Figure 3(c), test input T3 and T4 can be generated in the next step. Subsequently, the partition process can be continued by alternately bisect-ing the height and width of each sub-region until the termi-nation condition is satisfied.
2.3
Basic terms
In order to facilitate the expression below, we also fol-low and define some basic terms about ART. For an in-put domainD, the corresponding domain size is denoted as d. Meanwhile, we usemandnto denote the number of failure-causing inputs and number of test inputs, respec-tively. Then, the sampling rateσand failure rateθcan be defined asn/dandm/d, respectively.
It should be noted that, the case of two-dimension input domain is utilized to describe our partitioning algorithm. For the two-dimension case, a region can be expressed via pointPllandPur, wherePllrepresents the lower-left point
of the region and Pur is the upper-right point. For each
(a) Block Pattern (b) Strip Pattern (c) Point Pattern
Figure 1: Block, strip, and point failure patterns in a two-dimensional input domain. Here, the shaded areas represent failure-causing inputs.
(d) (e)
(c)
(b) T1
C2 (T2)
T1
T2
Pm1
Region 1
Region 2
Region 3 Region 4
T1
T2
Pm1
C1' (T3)
T1
T2
Pm1
T3
Pm2
(a) T1
C1
d1
d2
C2'
d1'
d2'
Figure 4: The illustration for the algorithm of two-point partitioning strategy.
P=(x, y). During the process for generating test inputs, the set of test data can be denoted as ST={Ti|1 ≤ i ≤ n}, and the candidate set of random points is denoted as
SC={Cr|1≤r ≤k}, wherekis the pre-specified size of
test input candidate set.
Here, we also use the number of test cases re-quired to detect the first failure (referred to as the F -measure) as the effectiveness metric. For a test data set
ST={T1, T2,· · ·, Tn}, if the correspondingF-measure is
equal tou(1 ≤u ≤ n), which means that the test input between 1 tou−1can’t reveal faults but theu-th can find them. Formally, it can be denoted asF=u. With regarding to the traditional random testing, in theory, itsF-measure is equal tod/m. When comparing two test data generation methods, the lower value of F-measure means the higher effectiveness, because the low F-measure means few test inputs which are required to reveal the first fault.
3
Two-point Partitioning Algorithm
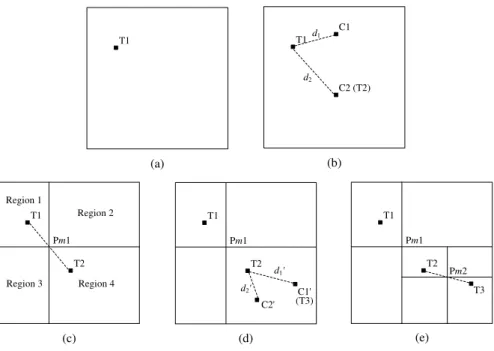
In the traditional partitioning strategies, it is possible that the two sampled test inputs are very close with each other. Here, we propose a new test data generation strategy based on two points partitioning. The basic process is illustrated in Figure 4, and the steps can be stated as below.
(1) Add the whole input domain into the region listL, and setST=Ø.
(2) Select the max-area region fromL, denote it ascurReg, and remove it fromL.
(3) If there are no previous test inputs incurReg, a new in-put point should be randomly generated in this region, then add it intoST. Otherwise, go to step (4).
(4) Suppose the existing test input in curReg denoted as Ti, randomly generate k candidate points in
upper-right point.
Output: The set of test dataST={T1, T2,· · ·, Tn}. Stage 1: Initialization
1: regionList= Ø; //regionListis a list of regions
2: set the region (bndP[0],bndP[1]) ascurReg; //curRegrepresents the current region needed to be partitioned
3: tempP=generateRandPoint(curReg.ll,curReg.ur);
4: ST=ST ∪
{tempP};
5: addcurRegintoregionList; Stage 2: Test Data Generation
6: whiletruedo
7: pIndex=findMaxRegion(regionList); //find the max-area region inregionList, andpIndexis the index of region needed to be partitioned
8: curReg=regionList.get(pIndex);
9: regionList.remove(pIndex); //remove the max-area region fromregionList 10: ifcurRegdoesn’t contain an existing test inputthen
11: generate a new test input using functiongenerateRandPoint(curReg.ll,curReg.ur), denote it as P1;
12: ST=ST
∪ {P1};
13: ifP1 hits the failure-causing regionthen
14: break;
15: end if
16: randomly generatekcandidate points incurReg, and store them inSC; //SCis the test input candidate set
17: select the point fromSCwhich is the farthest from P1 as the second test input P2;
18: else
19: P1 = the existing test input incurReg;
20: randomly generatekcandidate points incurReg, and store them inSC;
21: select the point fromSCwhich is the farthest from P1 as the second test input P2;
22: end if
23: ST=ST ∪
{P2};
24: ifP2 hits the failure-causing regionthen
25: break;
26: end if
27: calculate the midpoint of P1 and P2, dividecurReginto four new sub-regions via this midpoint, and then add them into region-List;
28: locate P1 and P2 to their corresponding sub-regions;
29: end while
30: return ST;
point, and select the point which is farthest from Ti
as the second test input (denoted asTi+1) incurReg, ST=ST
∪
{Ti+1}.
(5) In the step (3) and (4), once a new test input is gener-ated and added intoST, we should validate whether it
can hit the failure-causing region. If true, terminate the process and outputST. Otherwise, continue the
pro-cess to append other test inputs.
(6) Compute the midpoint of the corresponding points of
TiandTi+1, denoted asPmi. Then, partition the
cur-rent max-area region into four sub-regions via Pmi,
add these sub-regions intoL, go to step (2).
Formally, the adaptive random test data generation al-gorithm based on two-point partitioning can be described in the form of pseudo-code (cf. algorithm ART-TPP). It should be noted that, we are mainly concerned with the case of two dimension here. Accordingly, the high dimension case can be treated in the similar way. In
the line 3 and 11 of algorithm pseudo-code, function generateRandPoint(curReg.ll, curReg.ur) can ran-domly generate a test input (or point) in the current region, wherecurReg.ll refers to the lower-left point of region, and
curReg.ur is the upper-right point. curRegis a rectangle region object which contains two main member variables: lower-left point (ll) and upper-right point (ur). The func-tionfindMaxRegion(regionList) in line 7 returns the in-dex of the max-area region inregionList. There are several kinds of operations can be invoked by object regionList, such asget(),remove() etc.
Here, we suppose the size of test data set isn. Obviously, the time complexity of function findMaxRegion() is
O(l), wherelis the length of region list, and it varies from 0 ton. Therefore, the time complexity of whole algorithm is O(n2/2). In general, n is in the same magnitude of
(c) (d) T1
T2 T3
T4
(a) T1
T2
(a) T1
T1 T2 T3
T4
Figure 3: The illustration for bisection algorithm (2-D
case).
4
Experimental Analysis
4.1
Analysis on failure patterns
In this section, we perform the simulation analysis on the case of two-dimension. The experiment is employed in the environment of Eclipse 3.6 and JRE 1.6.0_05. The program runs on a computer with Pentium IV 1.8 GHz CPU, 1 GB RAM and Windows XP SP2. In this sub-section, we want to investigate the following two questions.
RQ1: How effective is the ART-TPP algorithm for three types of failure patterns?
RQ2: Does the failure rate affect theF-measure ratio (F -ratio for short)?
F-measure ratio =FART
FRT , whereFART represents theF -measure value of ART method, andFRT is theF-measure
of the general RT method. According to the description in section 2.3,FRT is equal to1/θ.
As shown in Figure 5, we firstly analyze theF-measure ratios for 20 different random failure regions. For each re-gion, we repeat 5000 runs to get the average value ofF -ratio. In the figure, the square-marked curve represents the theoretical value of RT’sF-ratio, the other three curves are ART’sF-ratios for three kinds of failure patterns. It is not hard to find that, the location of failure region does not im-pose a great impact onF-ratio. TheF-ratio of ART-TPP for block failure pattern is about 76.5%, but itsF-ratios of strip and point failure patterns are very close to the theoret-ical value of RT. This phenomenon is in accordance with Chen’s research results [6]. It means that the ART is more
effective than the general random testing method, and es-pecially for the block failure pattern.
2 4 6 8 10 12 14 16 18 20
0.65 0.7 0.75 0.8 0.85 0.9 0.95 1 1.05
Trials on Failure Region
F−measure Ratio (Fart / Frt)
RT
ART−TPP(Block) ART−TPP(Strip) ART−TPP(Point)
Figure 5: TheF-measure ratios for different failure region locations.
2 2.5 3 3.5 4
0.65 0.7 0.75 0.8 0.85 0.9 0.95 1 1.05
−log10θ
F−measure Ratio (Fart / Frt)
RT
ART−TPP(Block) ART−TPP(Strip) ART−TPP(Point)
Figure 6: TheF-measure ratio vs. failure rateθ.
Meanwhile, we also analyze the F-ratio through vary-ing the failure rate θ from 0.01 to 0.0001 (see Figure 6). For the reason of computing time, whenθis equal to 0.01, 0.005, 0.002 and 0.001, we randomly select 100 locations of failure regions, and repeat 5000 runs for each location to get the averageF-ratio. Whenθis equal to 0.0005 and 0.0002, 20 random locations and 1000 runs are used for ex-periments. Moreover, we set 20 random locations and 200 runs whenθis 0.0001. As illustrated in Figure 6, the failure rate does not cause obvious fluctuation onF-ratio. When
θvaries from 0.01 to 0.0001,F-ratio approximately keeps the value of 0.765 for block failure pattern, 0.95 for strip pattern and 0.97 for point pattern.
4.2
Comparison analysis
In this sub-section, we want to perform a comparison anal-ysis and answer the question as below.
rate ART-RP ART-BP
TPP ART-RP ART-BP TPP ART-RP ART-BP TPP
0.01 77.4% 72.1% 75.3% 92.8% 91.9% 93.6% 99.5% 97.7% 97.1%
0.005 77.4% 74.3% 76.5% 97.1% 95.5% 95.0% 99.6% 98.1% 97.9%
0.002 78.0% 73.6% 76.0% 95.3% 95.1% 95.3% 99.7% 98.7% 96.8%
0.001 79.6% 74.1% 76.9% 96.5% 96.6% 96.5% 98.0% 96.8% 97.5%
Table 1: Comparison analysis between ART-TPP and other two ART algorithms
In the experiment, our algorithm is run for different fail-ure rates and different failfail-ure region types, the results are shown in Table 1. In the same way, we randomly select 100 locations of failure regions, and repeat 5000 runs for each location to get the averageF-ratio. The results of other two algorithms are referred from [6]. Here, we compare the
F-ratios of three algorithms as follows.
For the block failure pattern, the effect of ART-TPP al-gorithm is better than ART-RP but worse than ART-BP for all the values ofθ. On average, theF-ratio of our ART-TPP algorithm is lower than that of ART-RP about 2 percent, but greater than that of ART-BP about 2.6 percent.
For the strip failure pattern, the results of ART-TPP are equal to those of other two algorithms on the whole. When
θ=0.01, the performance of BP is the best, while ART-TPP is on the worst performance. Whenθ=0.005, theF -ratio of ART-TPP is the lowest one, and ART-RP acts the worst performance. For the rest values of failure rate (θ), the difference of three algorithms is basically within 0.2 percentage points. The results indicate that, for the strip failure pattern, ART-TPP is quite good in the case of low fault density, but the performance is not good in the case of high fault density.
For the point failure pattern, theF-ratio of ART-TPP is lower and more stable than other two ART methods. When
θis from 0.01 to 0.002, theF-ratio of ART-TPP is always the lowest one in the three algorithms. Whenθis equal to 0.001, ART-TPP’s F-ratio is higher than that of ART-BP, but lower than that of ART-RP. It is worth noting that the fluctuations of theF-ratios of ART-TPP is the least of three algorithms
Based on the above analysis, we can argue that our ART-TPP algorithm has a positive improvement over the existing two well-known ART algorithms, especially for the ran-dom partitioning algorithm (ART-RP).
4.3
Sensitivity analysis
In the above experiments, we fix the candidate set size to 2. In fact,kacts as a parameter of our algorithm, so we have to answer the following question.
RQ4: Doeskplay an important role in algorithm effec-tiveness? And whichkvalue is the appropriate choice?
In order to answer this question, we take the block fail-ure pattern as an example to analyze the impact of can-didate set size. The results ofθ=0.001 andθ=0.0005 are
1 2 3 4 5 6 7
0.74 0.76 0.78 0.8 0.82 0.84 0.86
Candidate Set Size (k)
F−measure Ratio (Fart / Frt)
(a) θ=0.001
1 2 3 4 5 6 7
0.74 0.76 0.78 0.8 0.82 0.84 0.86
Candidate Set Size (k)
F−measure Ratio (Fart / Frt)
(b)θ=0.0005
Figure 7: TheF-measure ratio vs. candidate set sizek.
shown in Figure 7(a) and 7(b), respectively. We can find that, theF-ratio value greatly decreases whenkis from 1 to 2, i.e. from 0.84 to 0.767. TheF-ratio value decreases 0.017 when k is from 2 to 3. When kis greater than 3, theF-ratio has no obvious change and keeps the value on 0.745. Therefore,k=3 is the best value for the size of can-didate set, andk=2 is also a suitable choice while consid-ering the computing cost. More importantly, the F-ratio will sharply increase if we choose the second point without candidate selection (i.e.k=1).
5
Conclusion
realization and low cost. Unfortunately, this method usu-ally reveals the potential faults with the large amount of test inputs, so its cost-benefit is not very good. Chen et al. proposed an improved strategy namedadaptive ran-dom testingto overcome this shortage. In the paper, we are mainly concerned with the partitioning-based ART. A new algorithm based on two-point partitioning (i.e. ART-TPP) is presented here. In our algorithm, we also select the cur-rent max-area region as partition object, but the region is partitioned at the midpoint of two points. At first, we ran-domly generate a test point in the region. Then, the second point is picked out from a candidate set according to the far-thest distance criterion. The partition can be iteratively per-formed until the potential faults are found or the size of test data set reaches the pre-set limit. In order to validate the effectiveness of ART-TPP algorithm, we compare it with the other two well-known algorithms: random partitioning (ART-RP) and bisection partitioning (ART-BP). The exper-imental results show that ART-TPP is better than ART-RP but worse than ART-BP in the case of block failure pat-tern. For the strip failure pattern, the three algorithms have no obvious difference. While considering the point failure pattern, ART-TPP algorithm is better and more stable than other two algorithms.
Of course, there are still some open research issues that need to explored in the next step. For example, we can continue to conduct comparative analysis of the three algo-rithms in high-dimensional case. Meanwhile, we are plan-ning to use some real-world programs to analyze the effect of our ART-TPP algorithm.
Acknowledgement
This work was supported in part by the National Nat-ural Science Foundation of China (NSFC) under Grant No. 60803046 and 61063013, the Natural Science Founda-tion of Jiangxi Province under Grant No. 2010GZS0044, the Science Foundation of Jiangxi Educational Commit-tee under Grant No. GJJ10433, the Open Foundation of State Key Laboratory of Software Engineering under Grant No. SKLSE2010-08-23, and the Program for Outstanding Young Academic Talent in Jiangxi University of Finance and Economics.
References
[1] National Institute of Standards and Technology, (2002).The Economic Impacts of Inadequate Infras-tructure for Software Testing, Planning Report 02-3.
[2] N. Tracey, J. Clark, K. Mander, and J. McDer-mid, (1998). An Automated Framework for Structural Test-Data Generation,Proc. of the 13th Int’l Confer-ence on Automated Software Engineering (ASE’98), IEEE CS Press, Honolulu, Hawaii, USA, pp. 285– 288.
[3] K. Ayari, S. Bouktif, and G. Antoniol, (2007). Auto-matic Mutation Test Input Data Generation via Ant Colony,Proc. of the 9th Annual Conference on Ge-netic and Evolutionary Computation (GECCO’07), ACM Press, London, England, UK, pp. 1074–1081.
[4] R. P. Pargas, M. J. Harrold, and R. Peck, (1999). Test-Data Generation Using Genetic Algorithms,Software Testing, Verification and Reliability, vol. 9, no. 4, pp. 263–282.
[5] T. Y. Chen, F.-C. Kuo, R. G. Merkel, and T. H. Tse, (2010). Adaptive Random Testing: The ART of Test Case Diversity,The Journal of Systems and Software, vol. 83, pp. 60–66.
[6] T. Y. Chen, R. G. Merkel, G. Eddy, and P. K. Wong, (2004). Adaptive Random Testing Through Dynamic Partitioning, Proc. of the 4th Int’l Conference on Quality Software (QSIC’04), IEEE CS Press, Braun-schweig, Germany, pp. 79–86.
[7] T. Y. Chen, F.-C. Kuo, and H. Liu, (2007). Dis-tribution Metric Driven Adaptive Random Testing,
Proc. of the 7th Int’l Conference on Quality Software (QSIC’07), IEEE CS Press, Portland, Oregon, USA, pp. 274–279.
[8] C. Schneckenburger and J. Mayer, (2007). Towards the Determination of Typical Failure Patterns,Proc. of the 4th Int’l Workshop on Software Quality Assur-ance in conjunction with ESEC/FSE’07, ACM Press, Dubrovnik, Croatia, pp. 90–93.
[9] E. Allen, (2002).Bug Patterns in Java (2nd Edition), Apress.